SkatterBencher #45: AMD Ryzen 9 7950X Overclocked to 5950 MHz

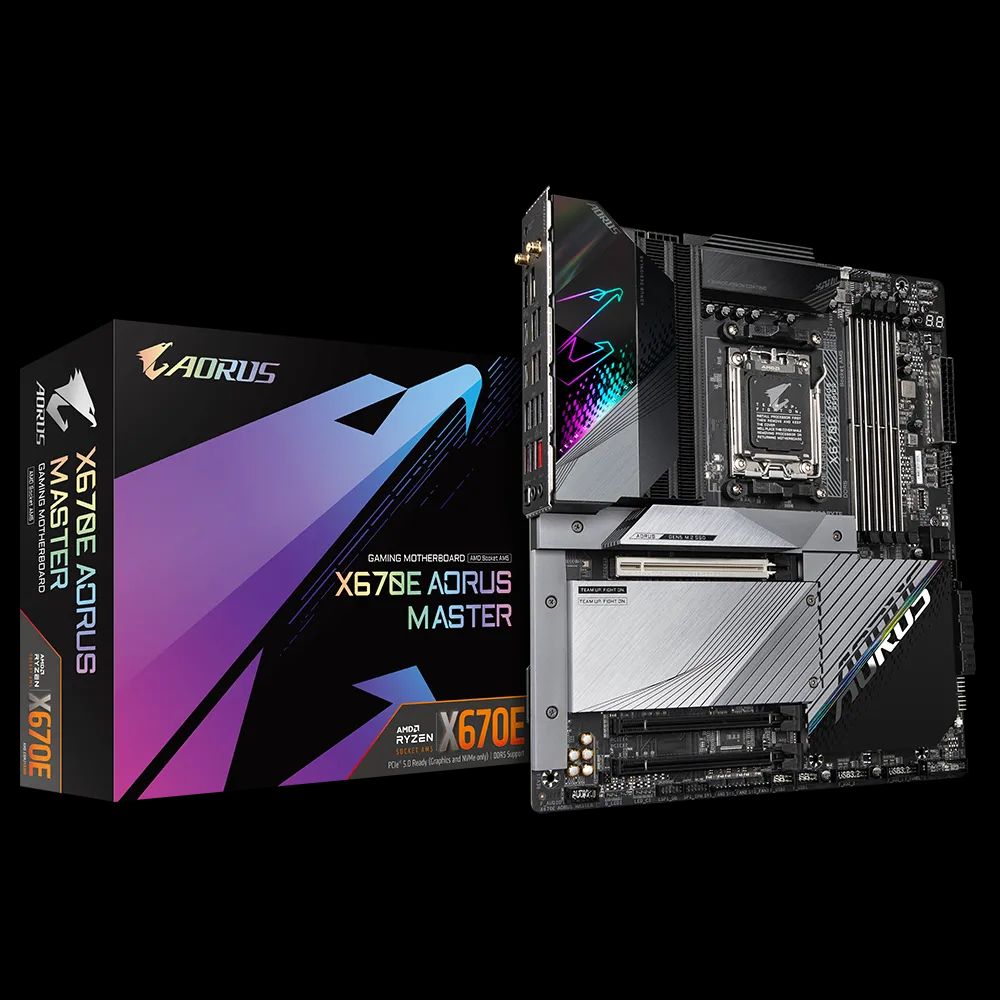
We overclock the AMD Ryzen 9 7950X up to 5950 MHz with using the GIGABYTE X670E Aorus Master motherboard and EK-Quantum water cooling.
Zen 4 provides a unique set of overclocking tools, so we will go over a wide variety of overclocking strategies. Hopefully, it gives you a solid foundation to start your overclocking adventure.
Alright, we have lots to cover, so let’s jump straight in.
AMD Ryzen 9 7950X: Introduction
The AMD Ryzen 9 7950X processor is part of the Ryzen 7000 Zen 4 AM5 desktop product line-up.
The Zen 4 desktop CPUs codenamed Raphael launched on August 29, 2022, during an AMD Livestream. At launch, there were 4 SKUs available, of which the Ryzen 9 7950X we are overclocking today is the flagship product.
Zen 4 Raphael is very similar to Zen 3 Vermeer, but there are some noteworthy differences. Most importantly, Raphael requires the new AM5 socket and supports DDR5 memory. The CCDs, featuring the Zen 4 CPU cores, is AMD’s first chip using TSMC N5 manufacturing technology. Raphael also introduces AVX-512 support and operates at significantly higher clock frequencies.
The Ryzen 9 7950X has 16 cores with 32 threads, a base frequency of 4.5 GHz, and a maximum listed boost frequency of 5.7GHz. The TDP is 170W, and PPT is 230W.

In this video, we will cover five overclocking strategies:
- First, we simply rely on AMD PBO and EXPO performance boost technologies
- Second, we tune Precision Boost Overdrive with Curve Optimizer
- Third, we tune Precision Boost Overdrive with asynchronous eCLK
- Fourth we try to do a manual overclock
- Lastly, we use GIGABYTE Active OC Tuner.
However, before we jump into overclocking, let us quickly review the hardware and benchmarks used in this video.
AMD Ryzen 9 7950X: Platform Overview
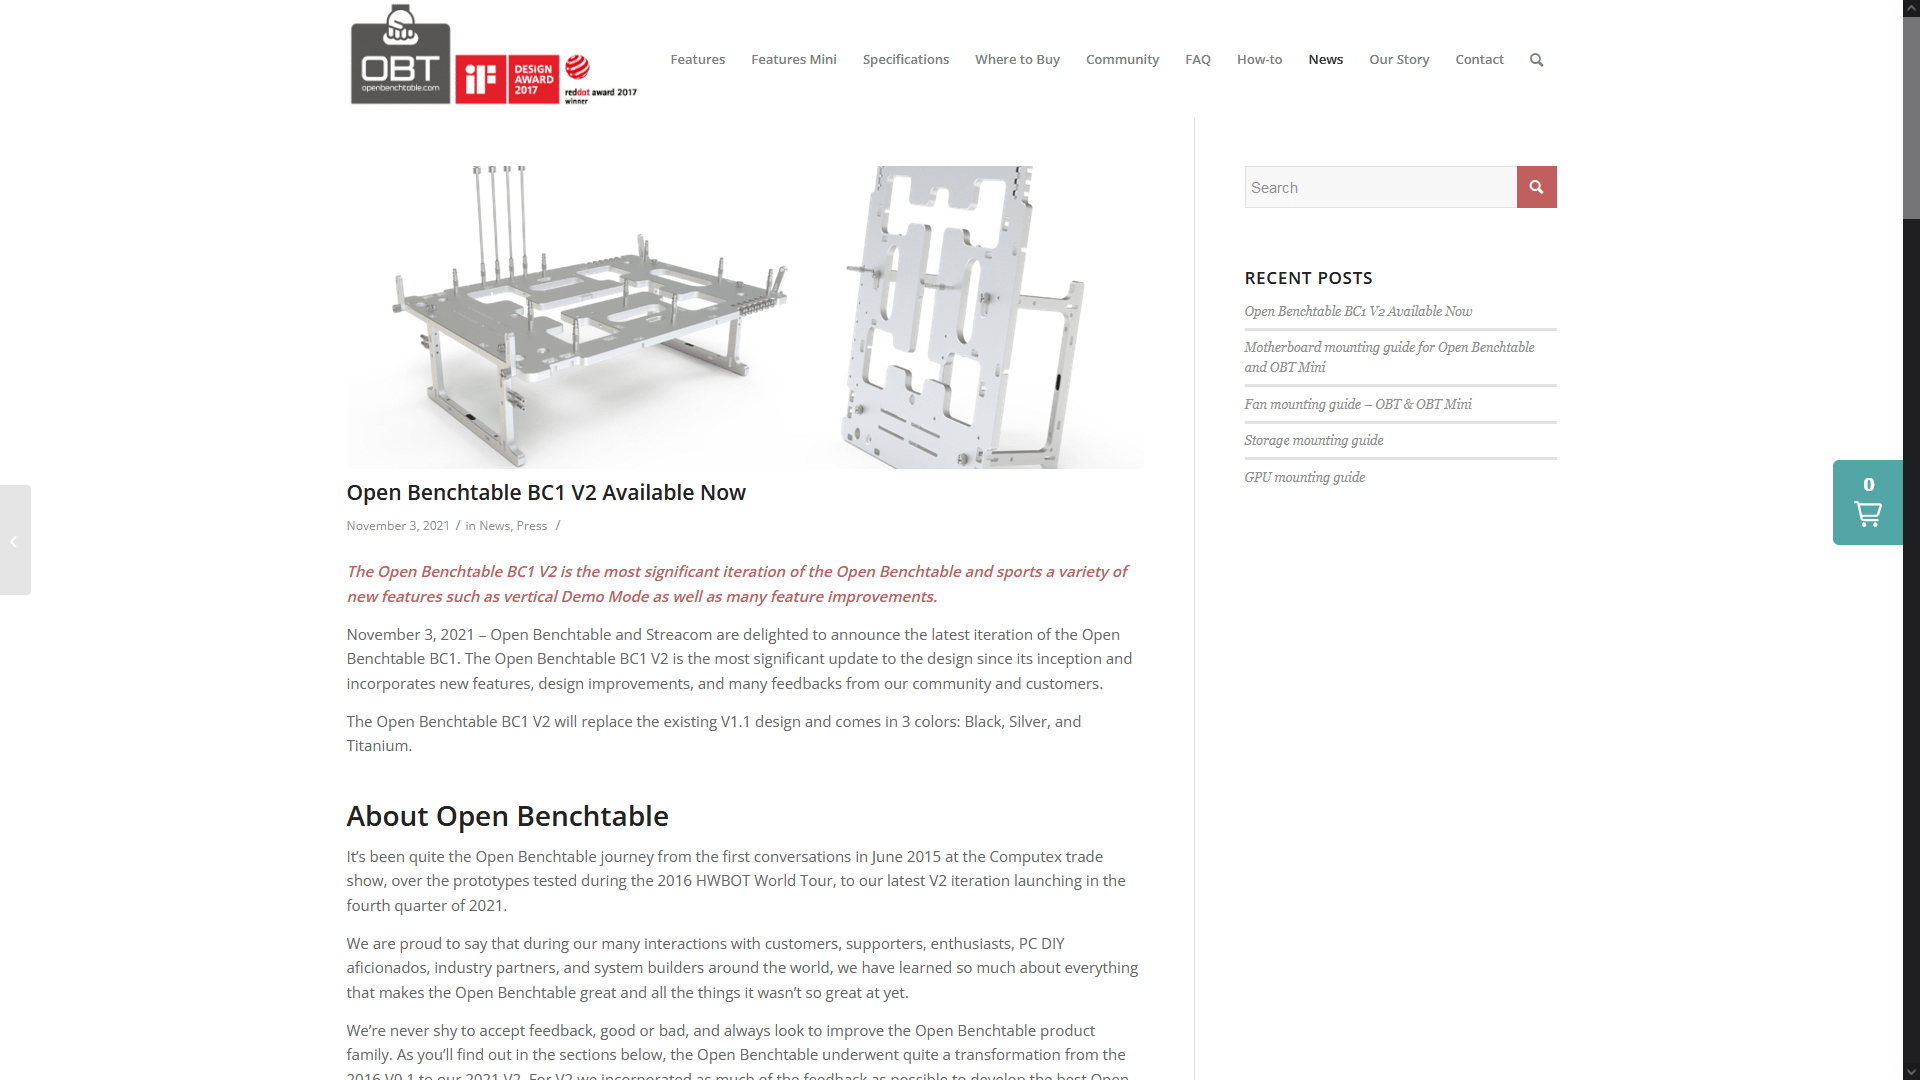
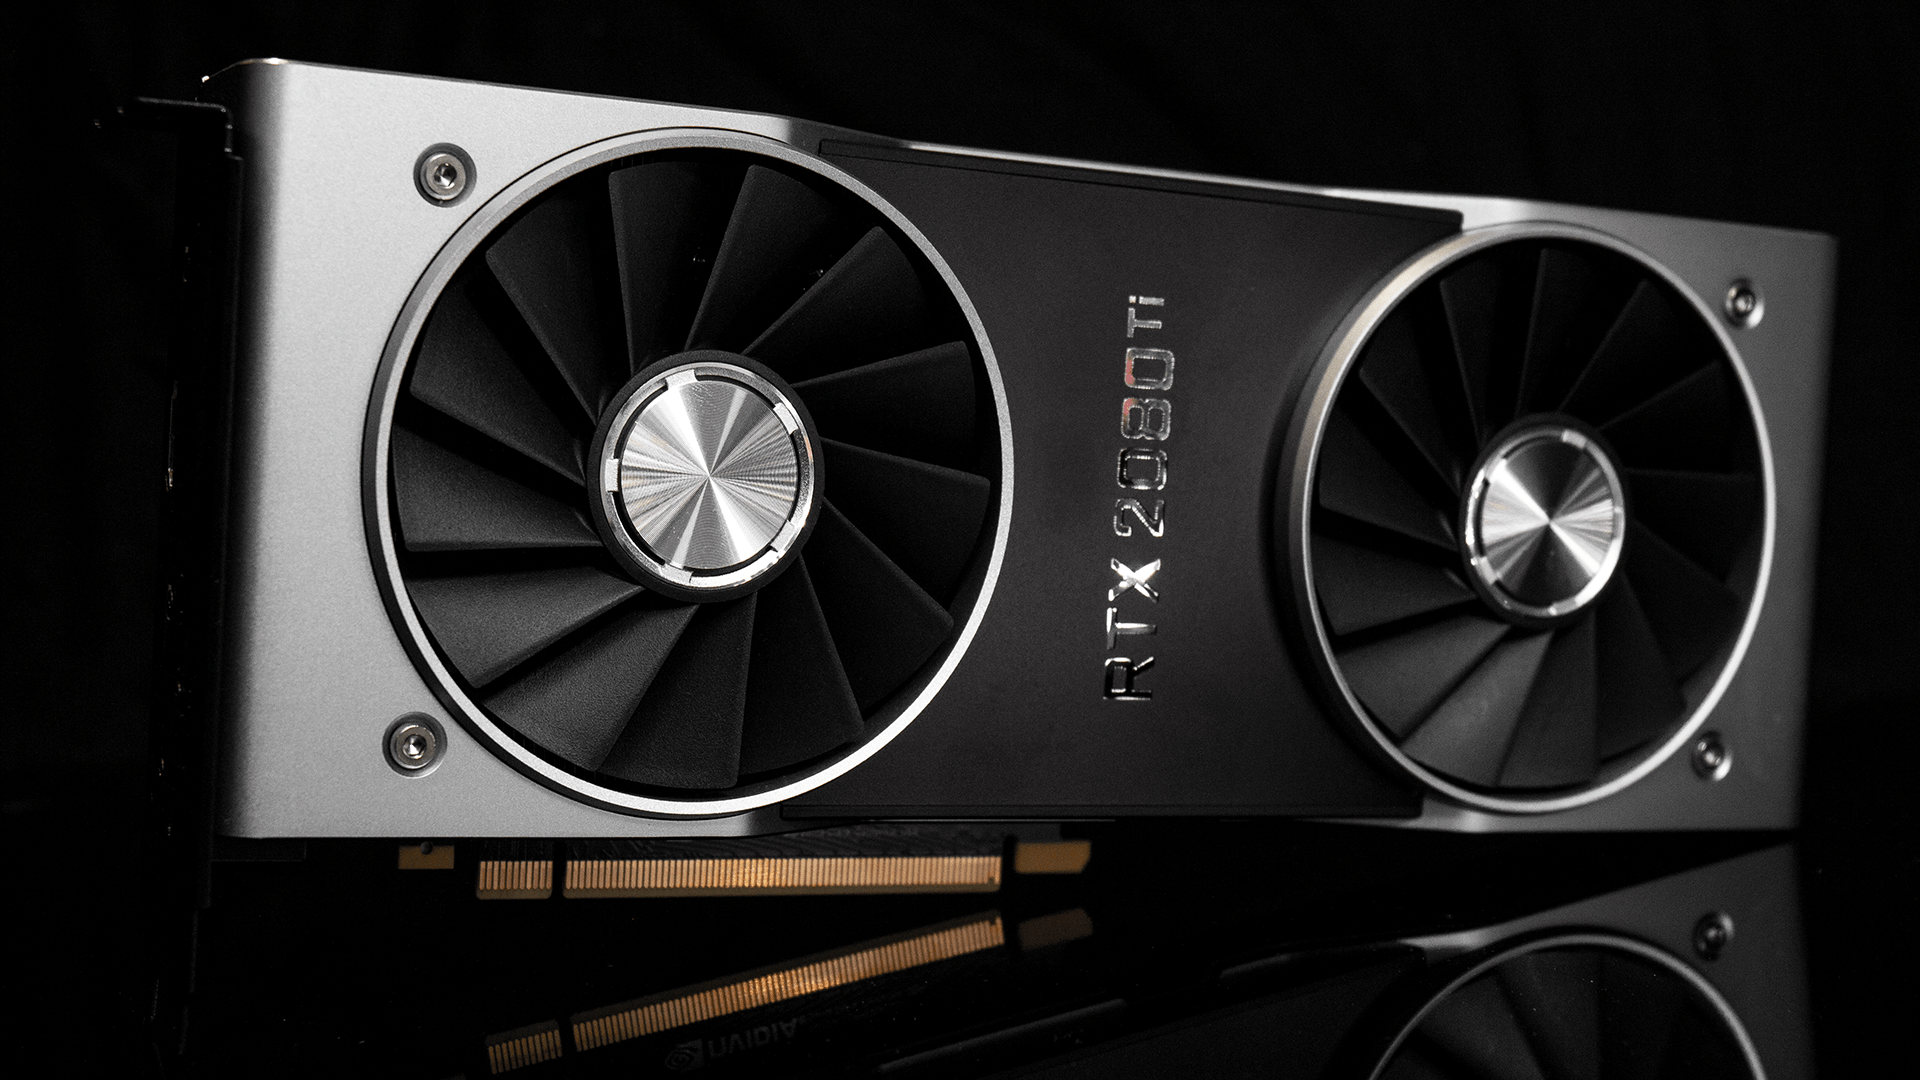
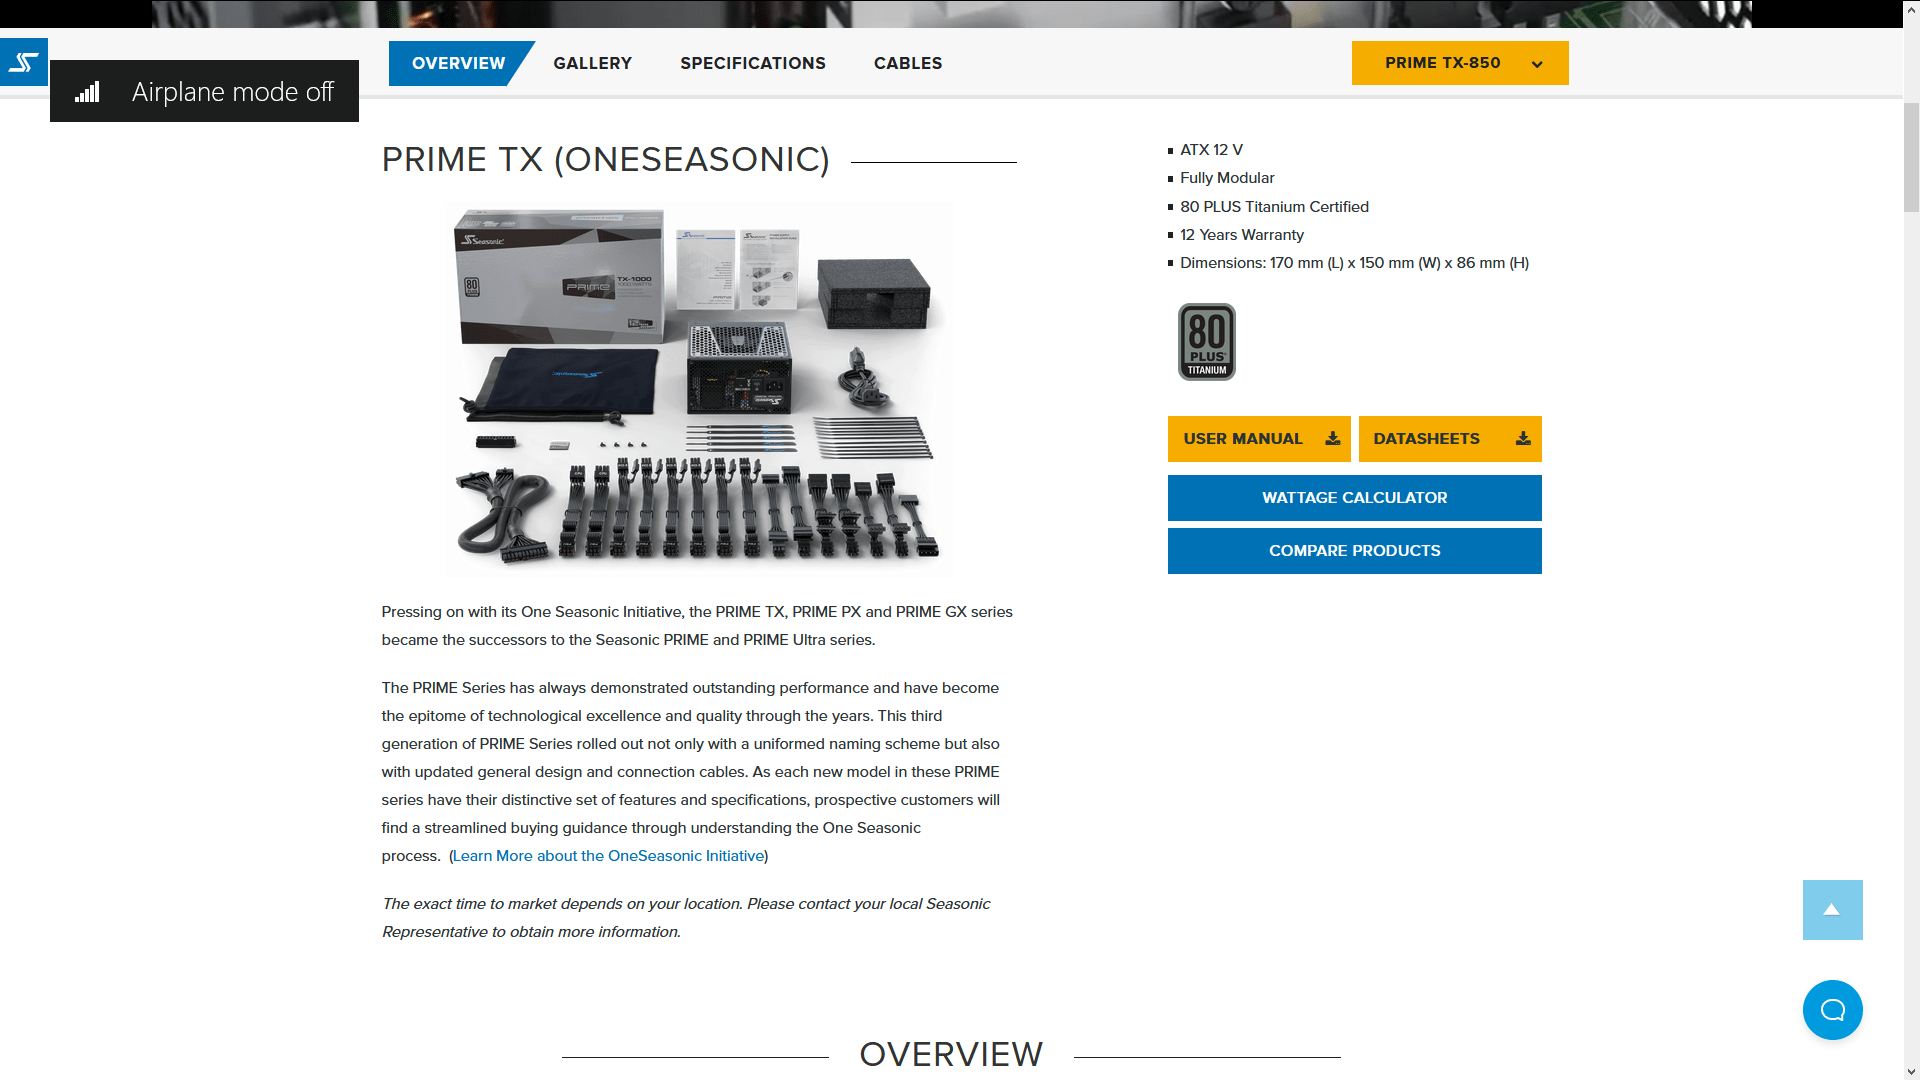
Along with the AMD Ryzen 9 7950X processor and GIGABYTE X670E Aorus Master motherboard, in this guide, we will be using a pair of G.SKILL Trident Z5 Neo DDR5-6400 memory sticks, an ASUS ROG STRIX RTX 2080TI graphics card, an 512GB M.2 NVMe SSD, a Seasonic Prime 850W Platinum power supply, the ElmorLabs Easy Fan Controller, the ElmorLabs EVC2SX, the EK-Quantum Magnitude water block, and EK-Quantum water cooling. All this is mounted on top of our favorite Open Benchtable V2.


ElmorLabs EFC & EVC2
I explained how I use ElmorLabs products in SkatterBencher #34. By connecting the EFC and PMD to the EVC2 device, I monitor the ambient temperature (EFC), water temperature (EFC), fan duty cycle (EFC), and CPU input power (PMD). I include the measurements in my Prime95 stability test results.
I also use the ElmorLabs EFC to map the radiator fan curve to the water temperature. Without going into too many details: I have attached an external temperature sensor from the water in the loop to the EFC. Then, I use the low/high setting to map the fan curve from 25 to 40 degrees water temperature. I use this configuration for all overclocking strategies.
AMD Ryzen 9 7950X: Benchmark Software
We use Windows 11 and the following benchmark applications to measure performance and ensure system stability.
- SuperPI 4M https://www.techpowerup.com/download/super-pi/
- Geekbench 5 https://www.geekbench.com/
- Cinebench R23 https://www.maxon.net/en/cinebench/
- CPU-Z https://www.cpuid.com/softwares/cpu-z.html
- V-Ray 5 https://www.chaosgroup.com/vray/benchmark
- AI-Benchmark https://ai-benchmark.com/
- 3DMark CPU Profile https://www.3dmark.com/
- 3DMark Night Raid https://www.3dmark.com/
- CS:GO FPS Bench https://steamcommunity.com/sharedfiles/filedetails/?id=500334237
- Shadow of the Tomb Raider https://store.steampowered.com/app/750920/Shadow_of_the_Tomb_Raider_Definitive_Edition/
- Final Fantasy XV http://benchmark.finalfantasyxv.com/na/
- Prime 95 https://www.mersenne.org/download/

AMD Ryzen 9 7950X: Stock Performance
Before starting overclocking, we must check the system performance at default settings. Note that on this motherboard, Precision Boost Overdrive is enabled by default.
So, to check the performance at default settings, you must enter the BIOS and
- Switch to Advanced Mode
- Enter the Advanced CPU Settings submenu
- Enter the Precision Boost Overdrive submenu
- Set Precision Boost Overdrive to Disabled
- Enter the Precision Boost Overdrive submenu
Then save and exit the BIOS.
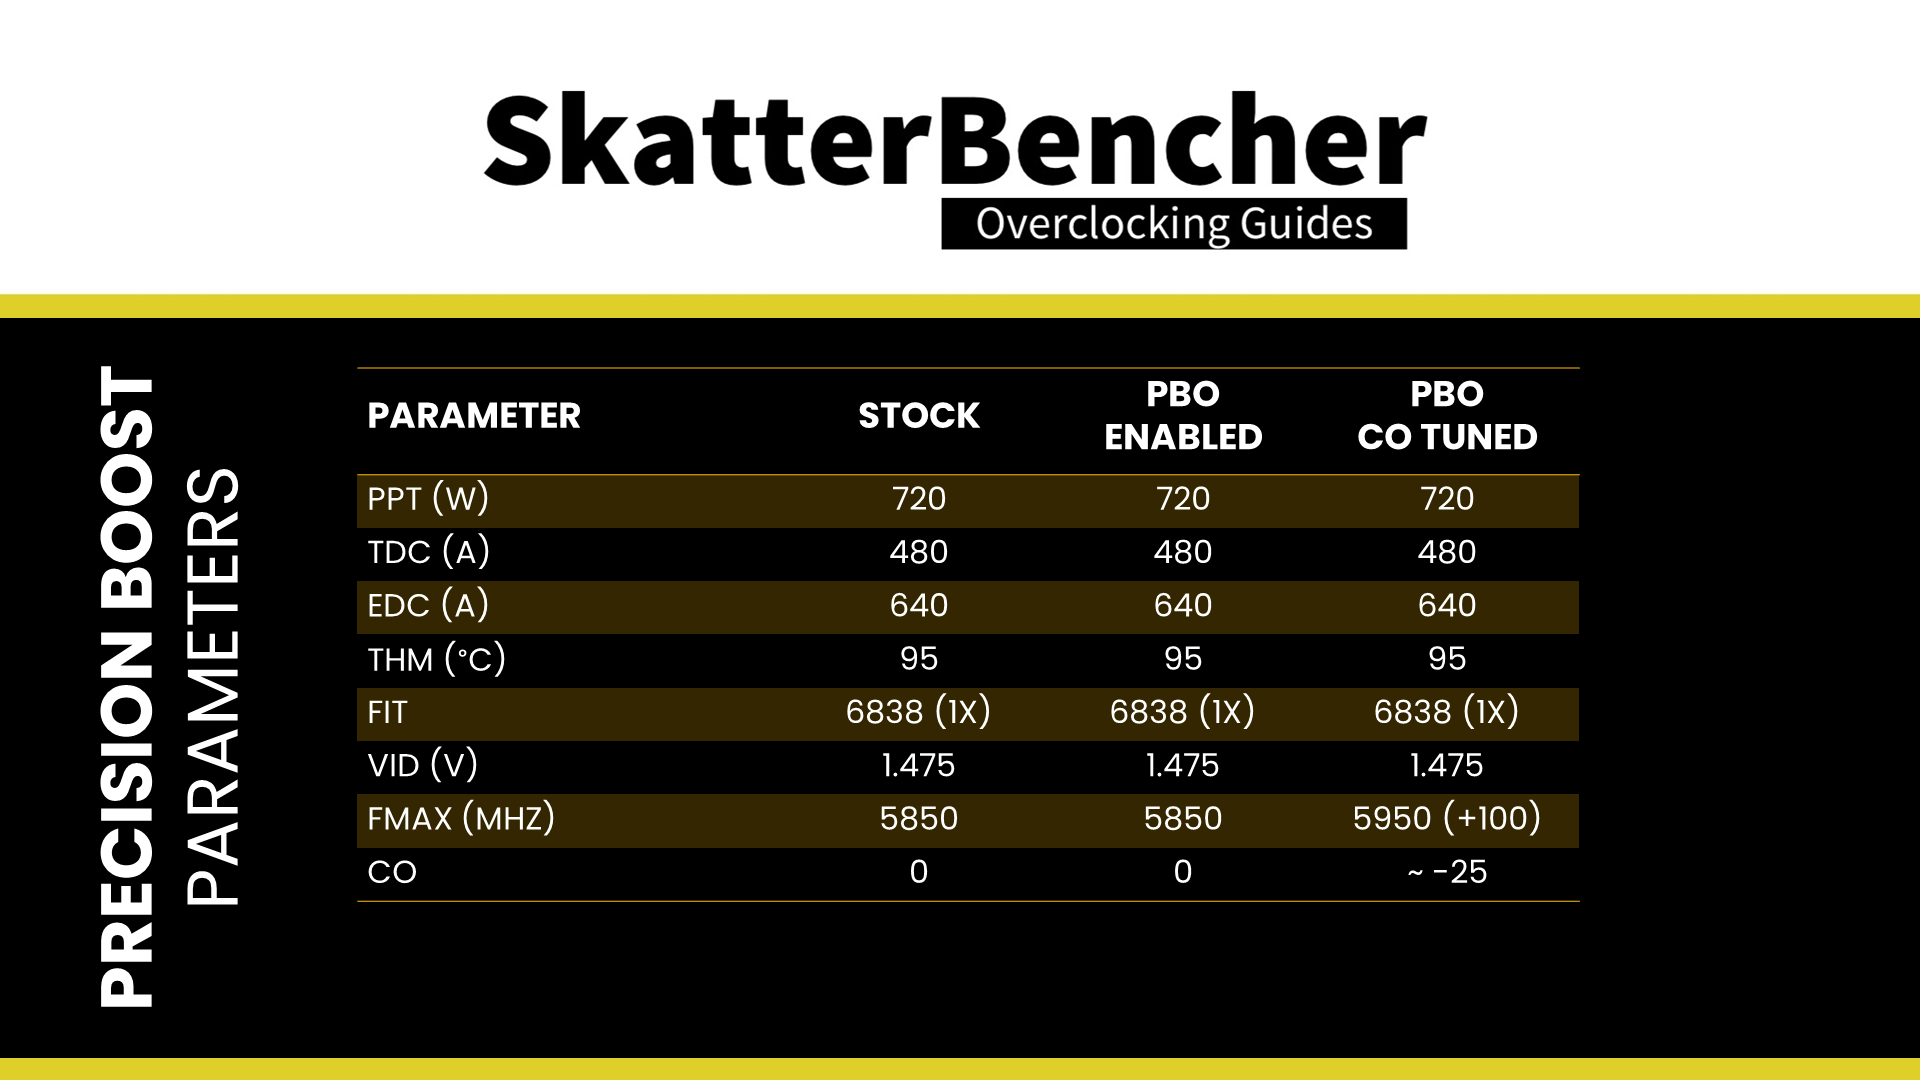
Note that the Precision Boost 2 boosting algorithm is still active even though we disabled Precision Boost Overdrive. The standard parameters of the Precision Boost algorithm for the Ryzen 9 7950X are as follows:
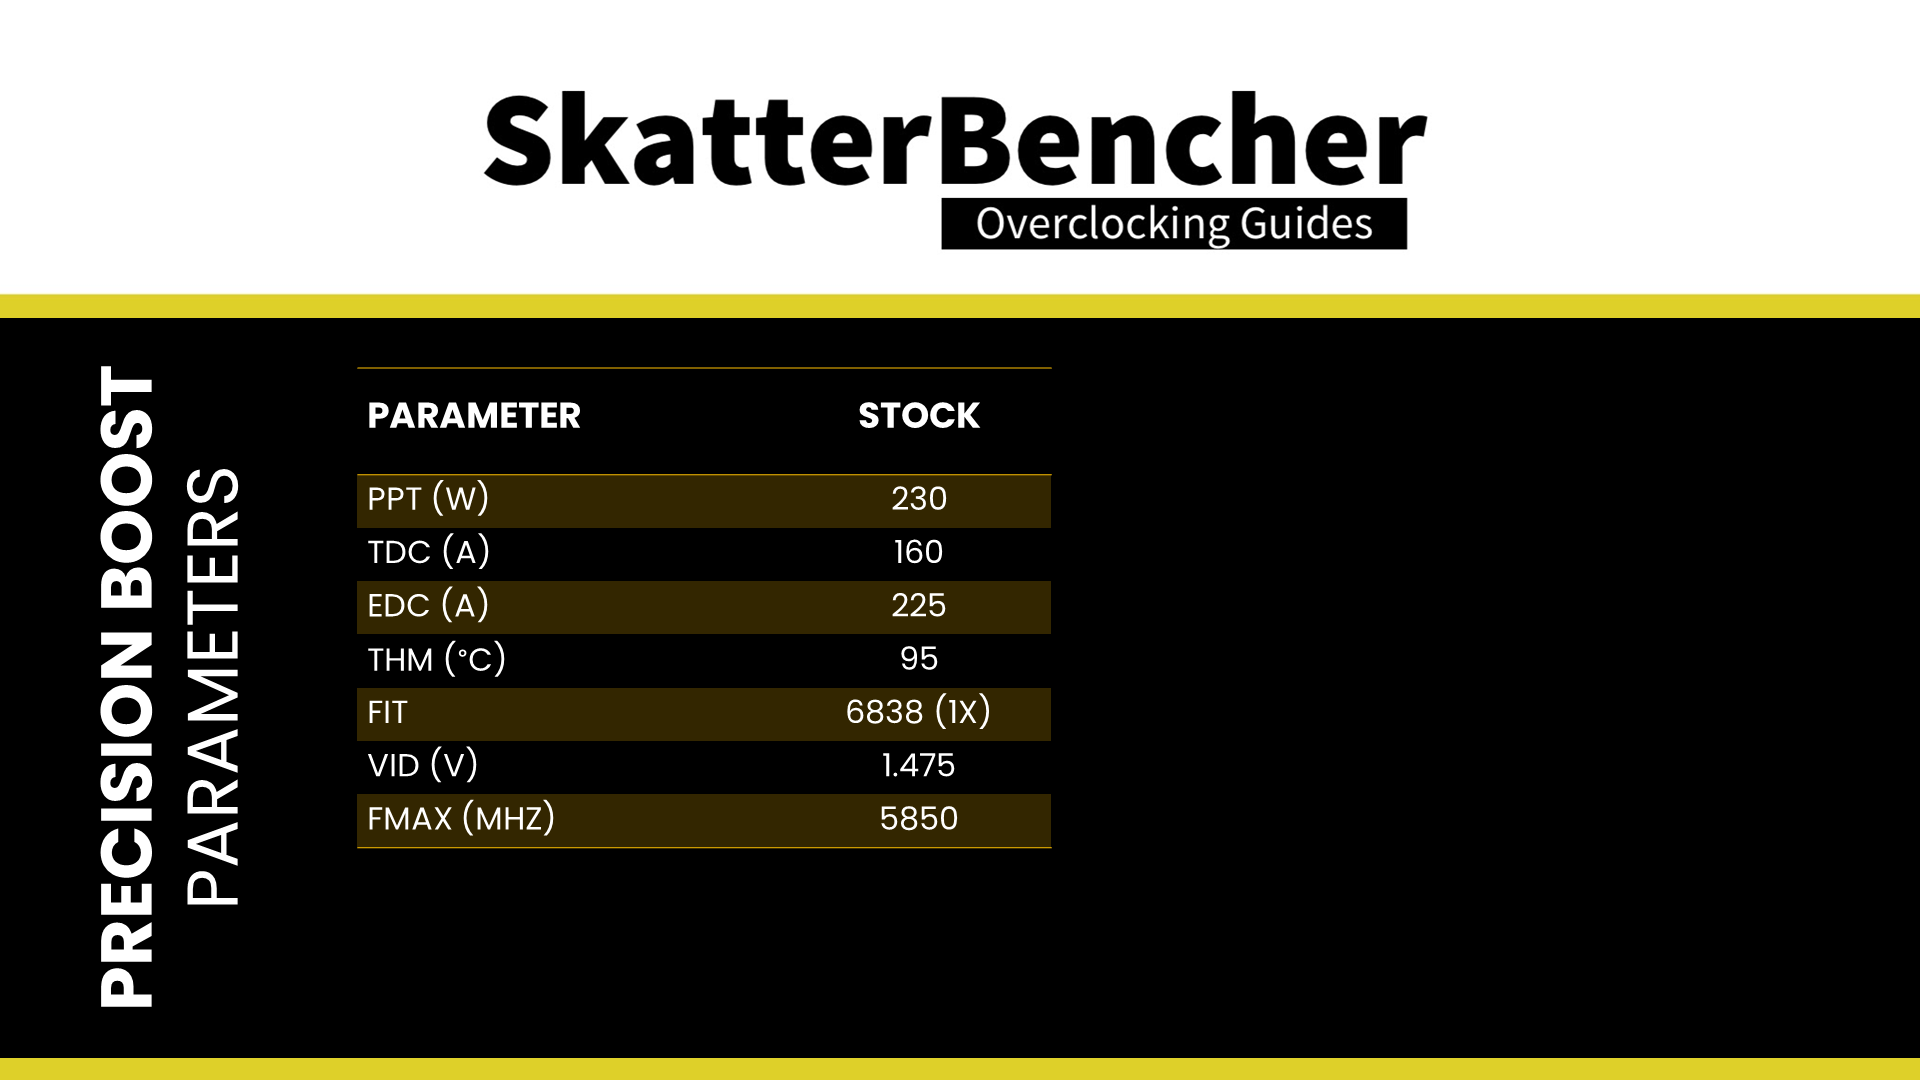
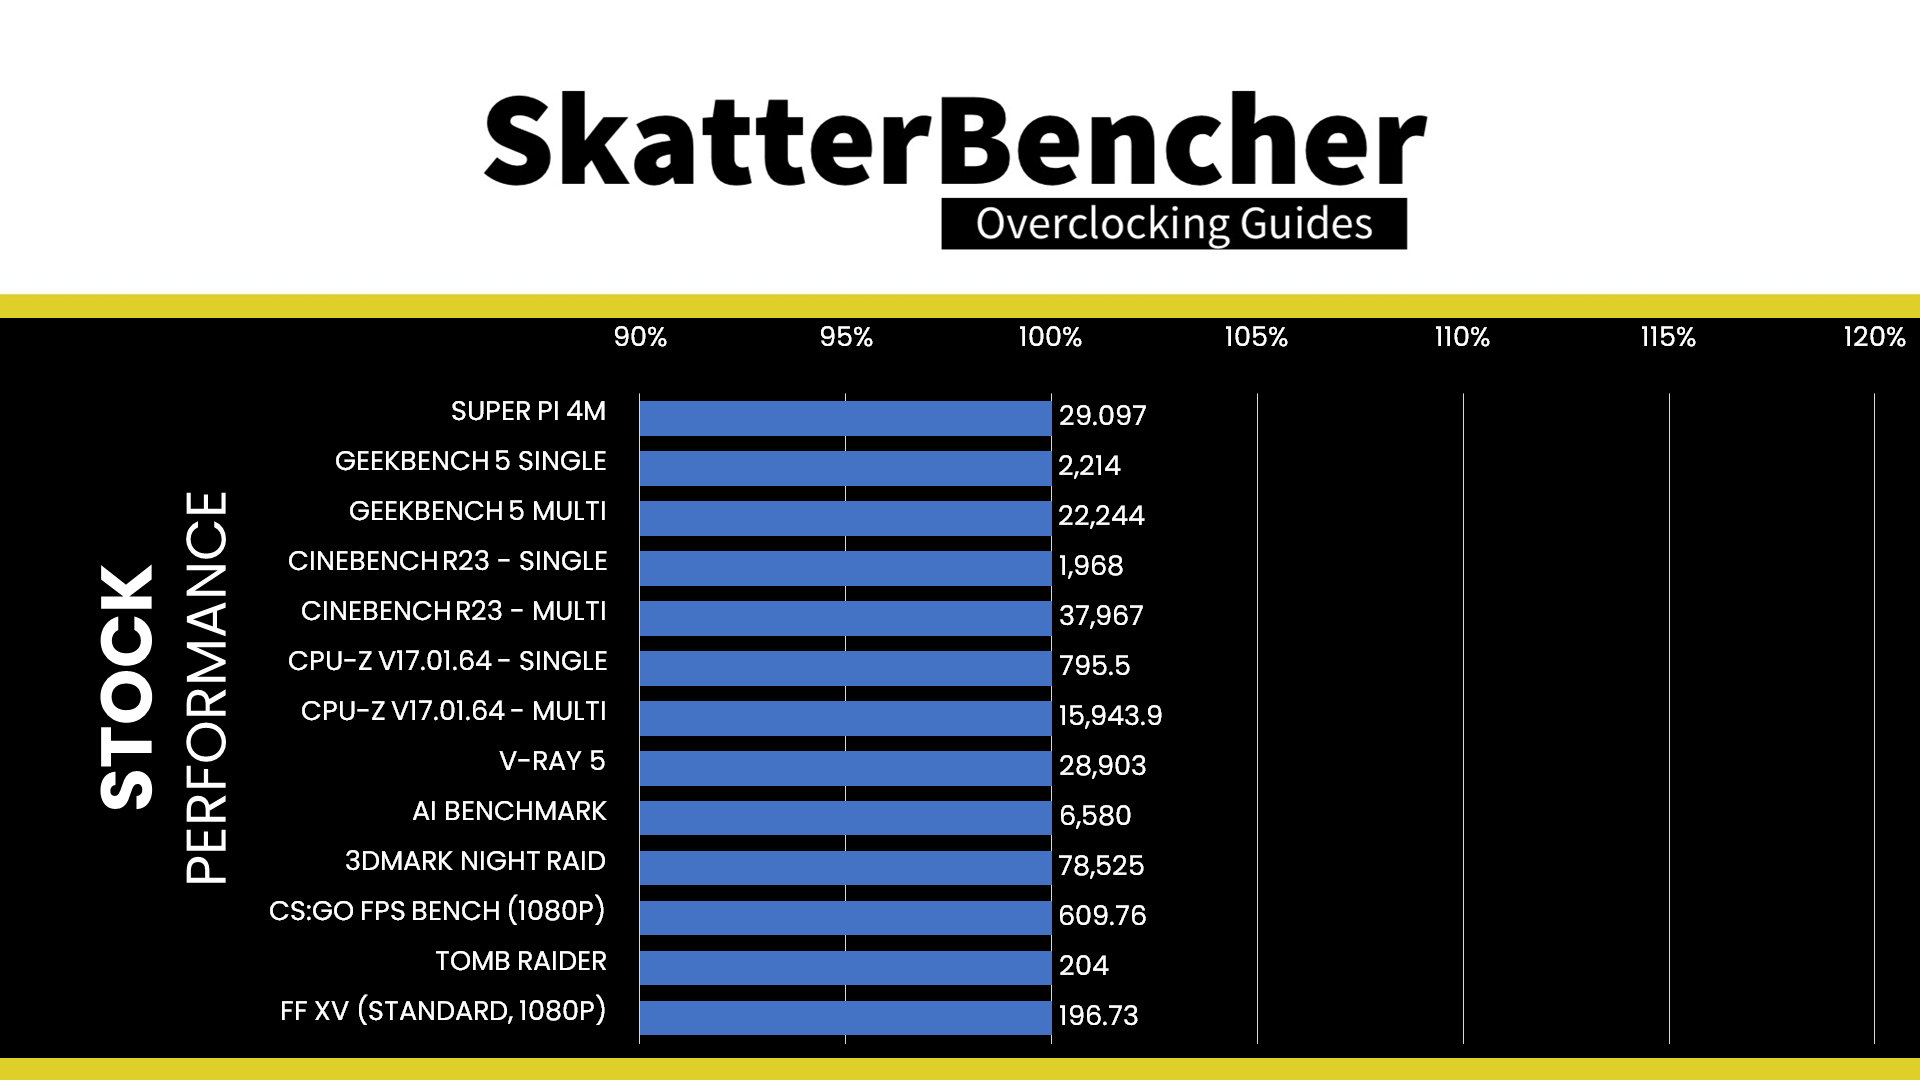
Here is the benchmark performance at stock:
- SuperPI 4M: 29.097 seconds
- Geekbench 5 (single): 2,214 points
- Geekbench 5 (multi): 22,244 points
- Cinebench R23 Single: 1,968 points
- Cinebench R23 Multi: 37,967 points
- CPU-Z V17.01.64 Single: 795.5 points
- CPU-Z V17.01.64 Multi: 15,943.9 points
- V-Ray 5: 28.903 vsamples
- AI Benchmark: 6,580 points
- 3DMark Night Raid: 78,525 points
- CS:GO FPS Bench: 609.76 fps
- Tom Raider: 204 fps
- Final Fantasy XV: 196.73 fps
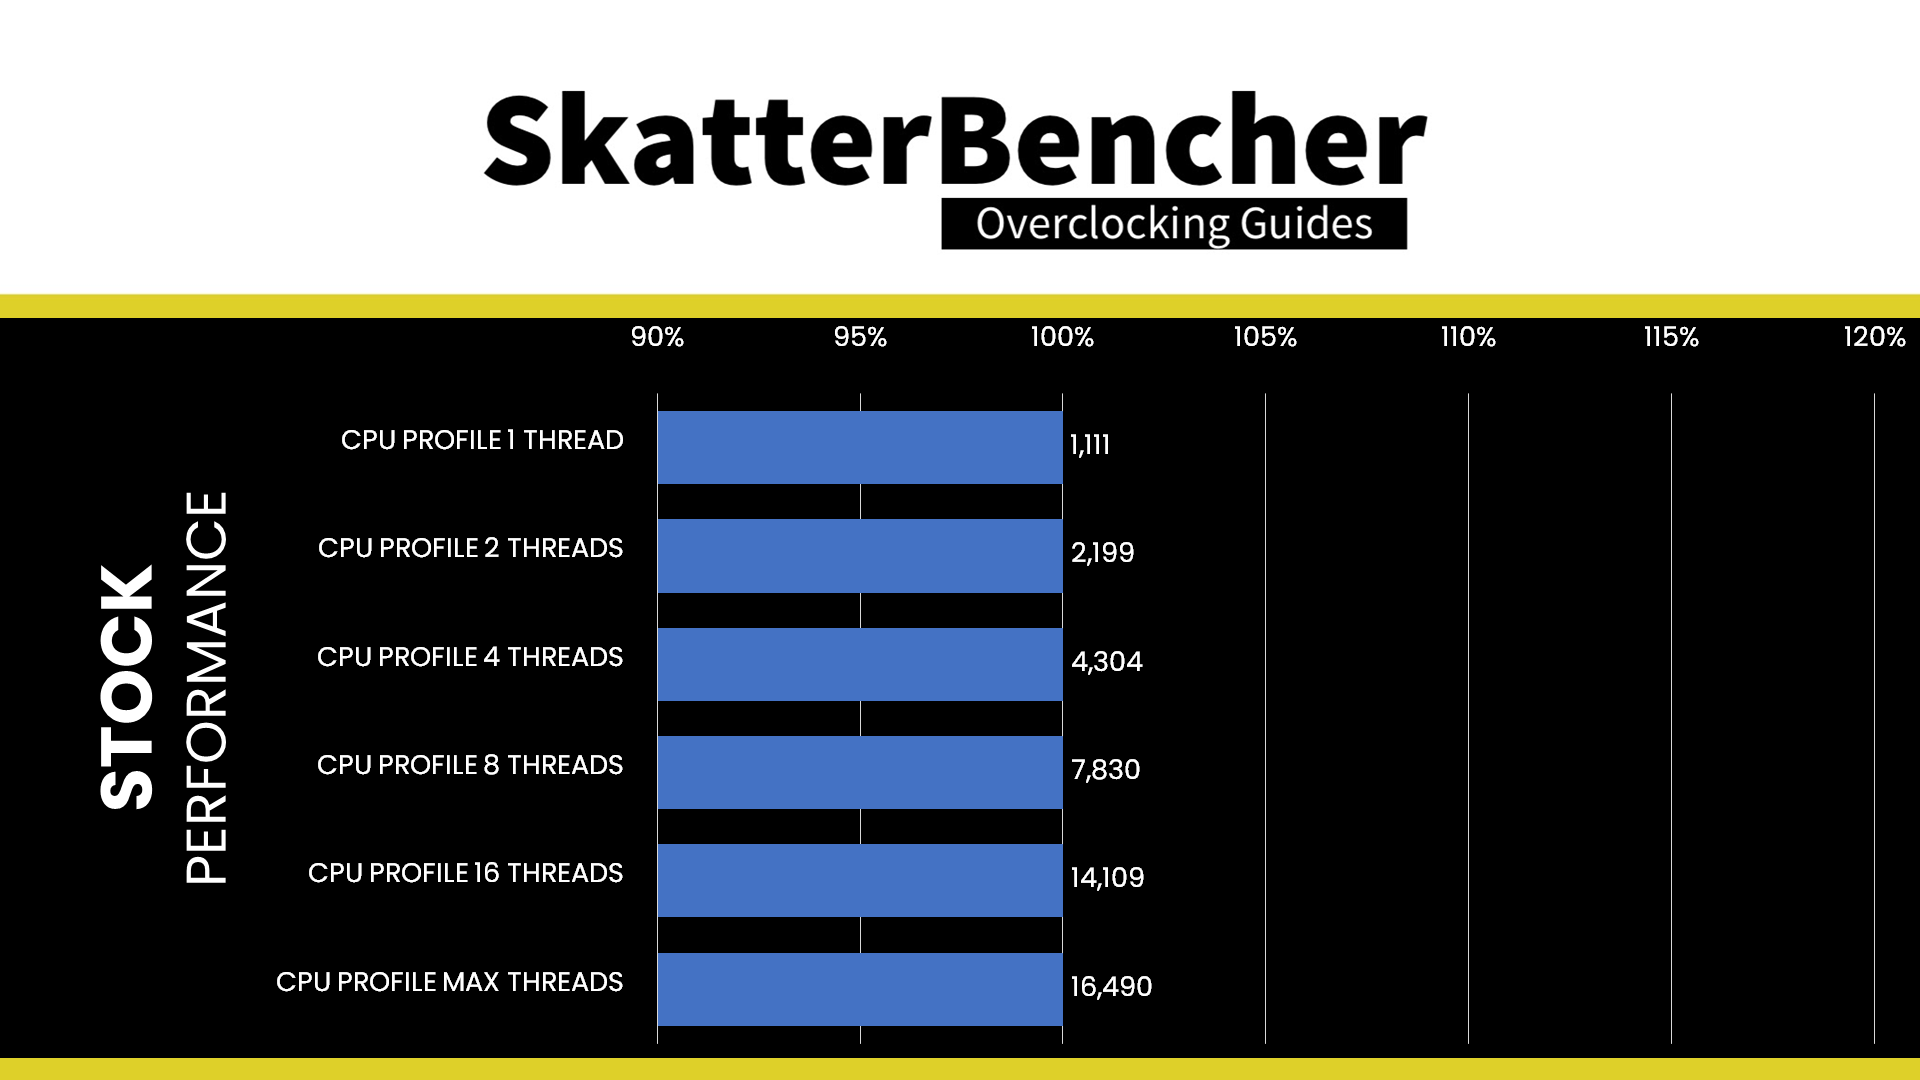
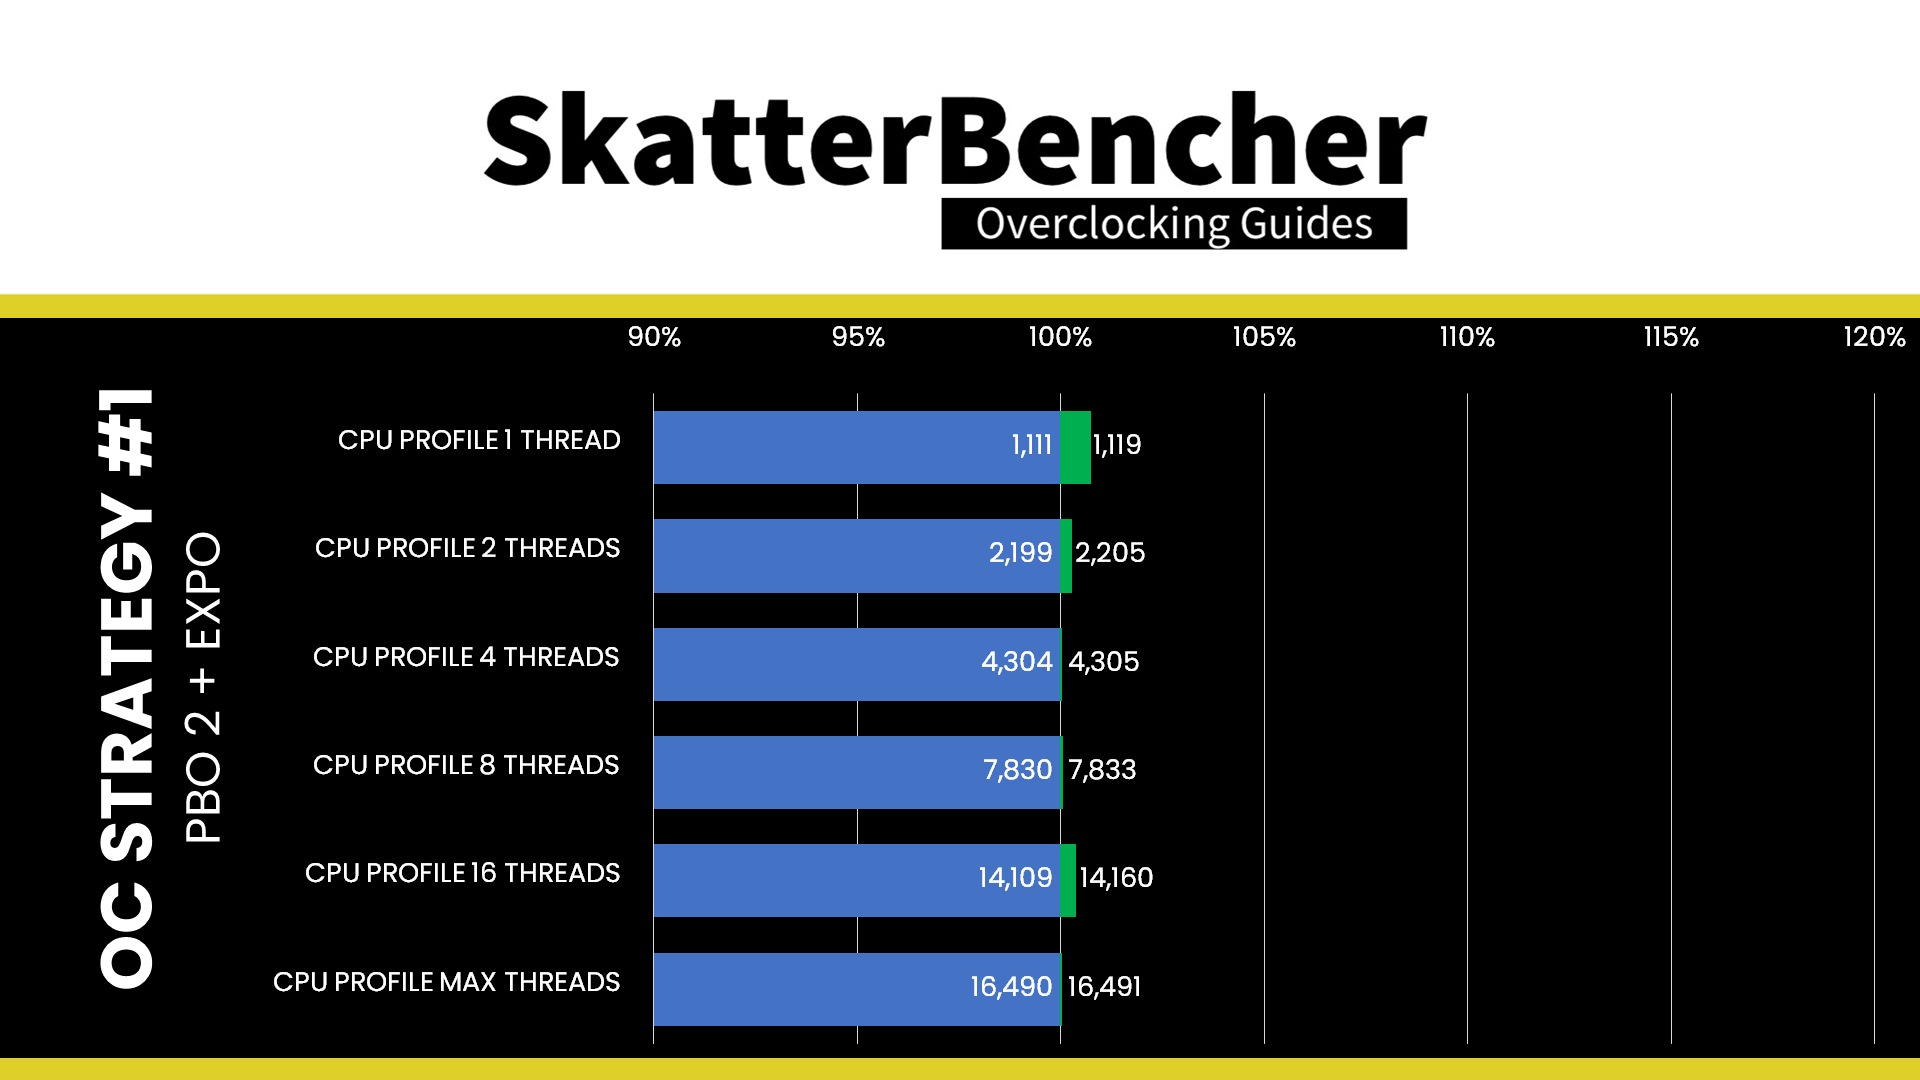
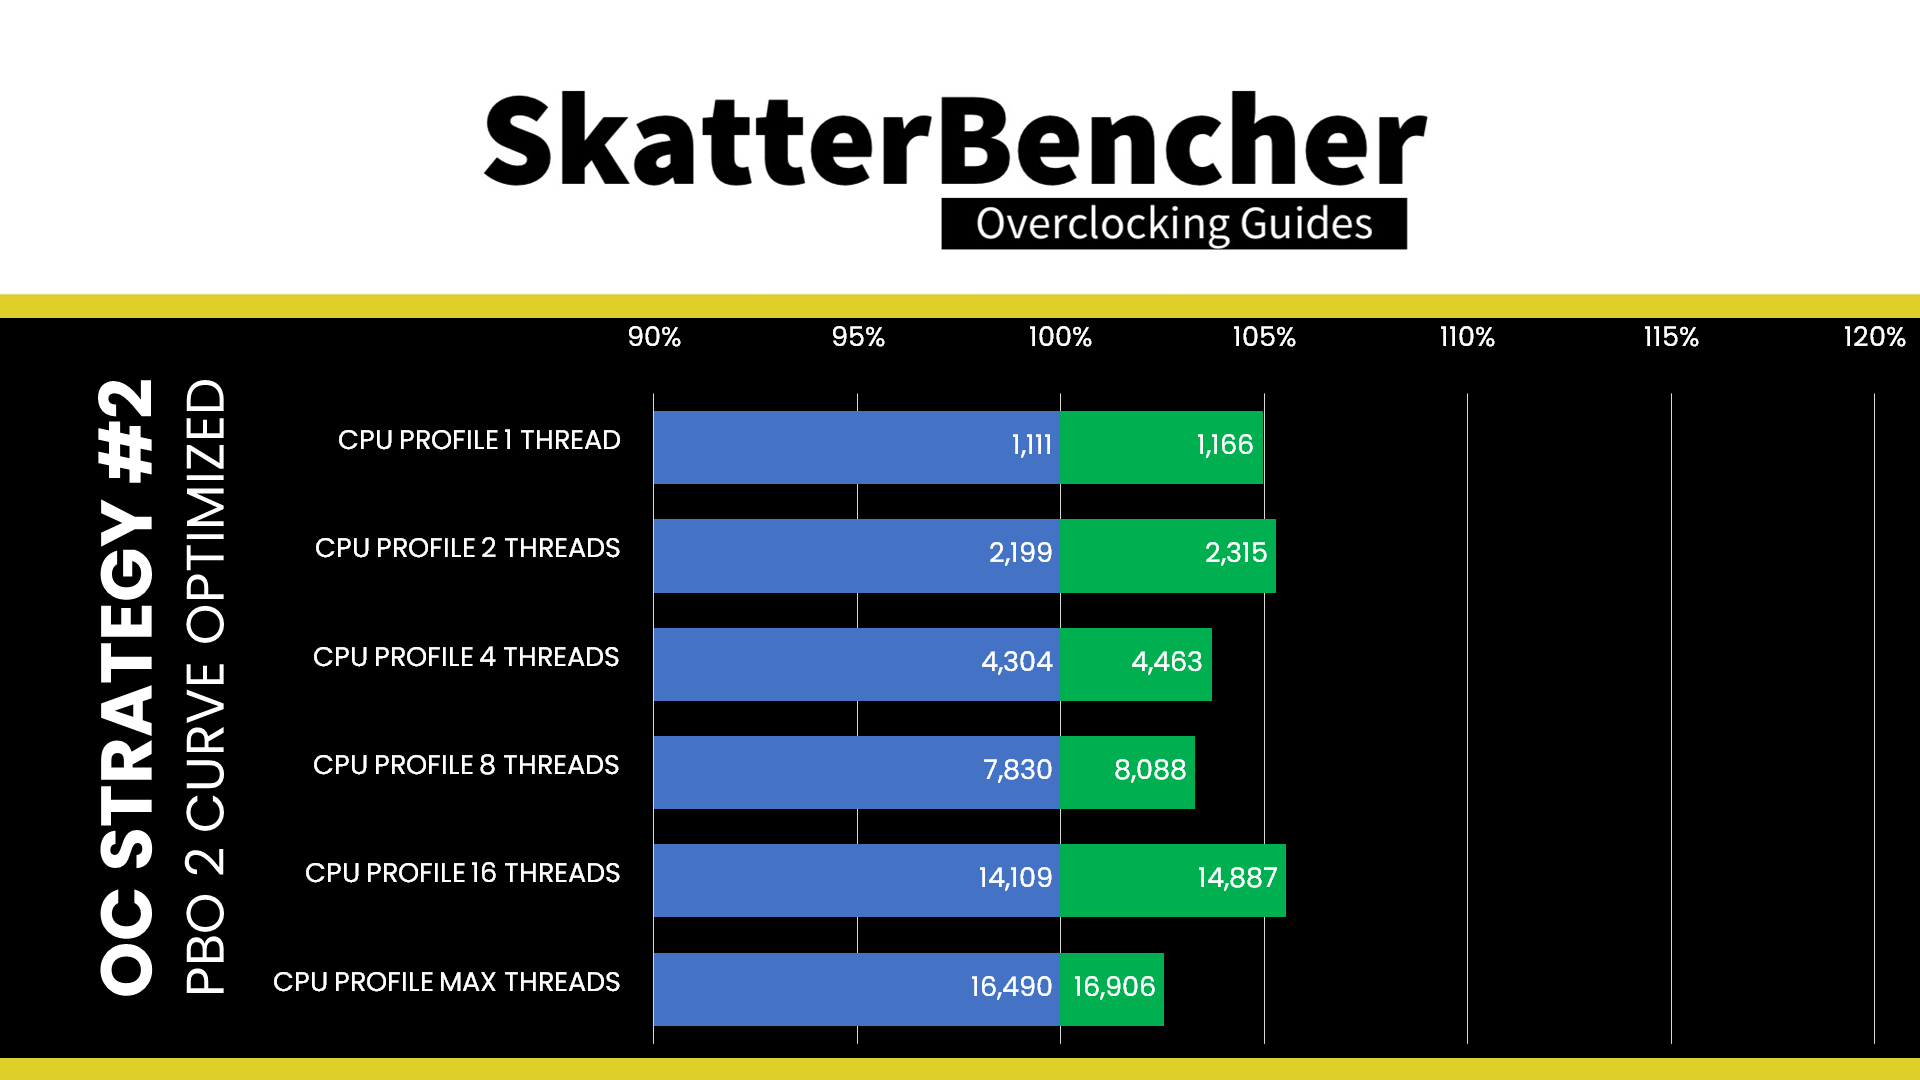
Here are the 3DMark CPU Profile scores at stock
- CPU Profile 1 Thread: 1,111
- CPU Profile 2 Threads: 2,199
- CPU Profile 4 Threads: 4,304
- CPU Profile 8 Threads: 7,830
- CPU Profile 16 Threads: 14,109
- CPU Profile Max Threads: 16,490
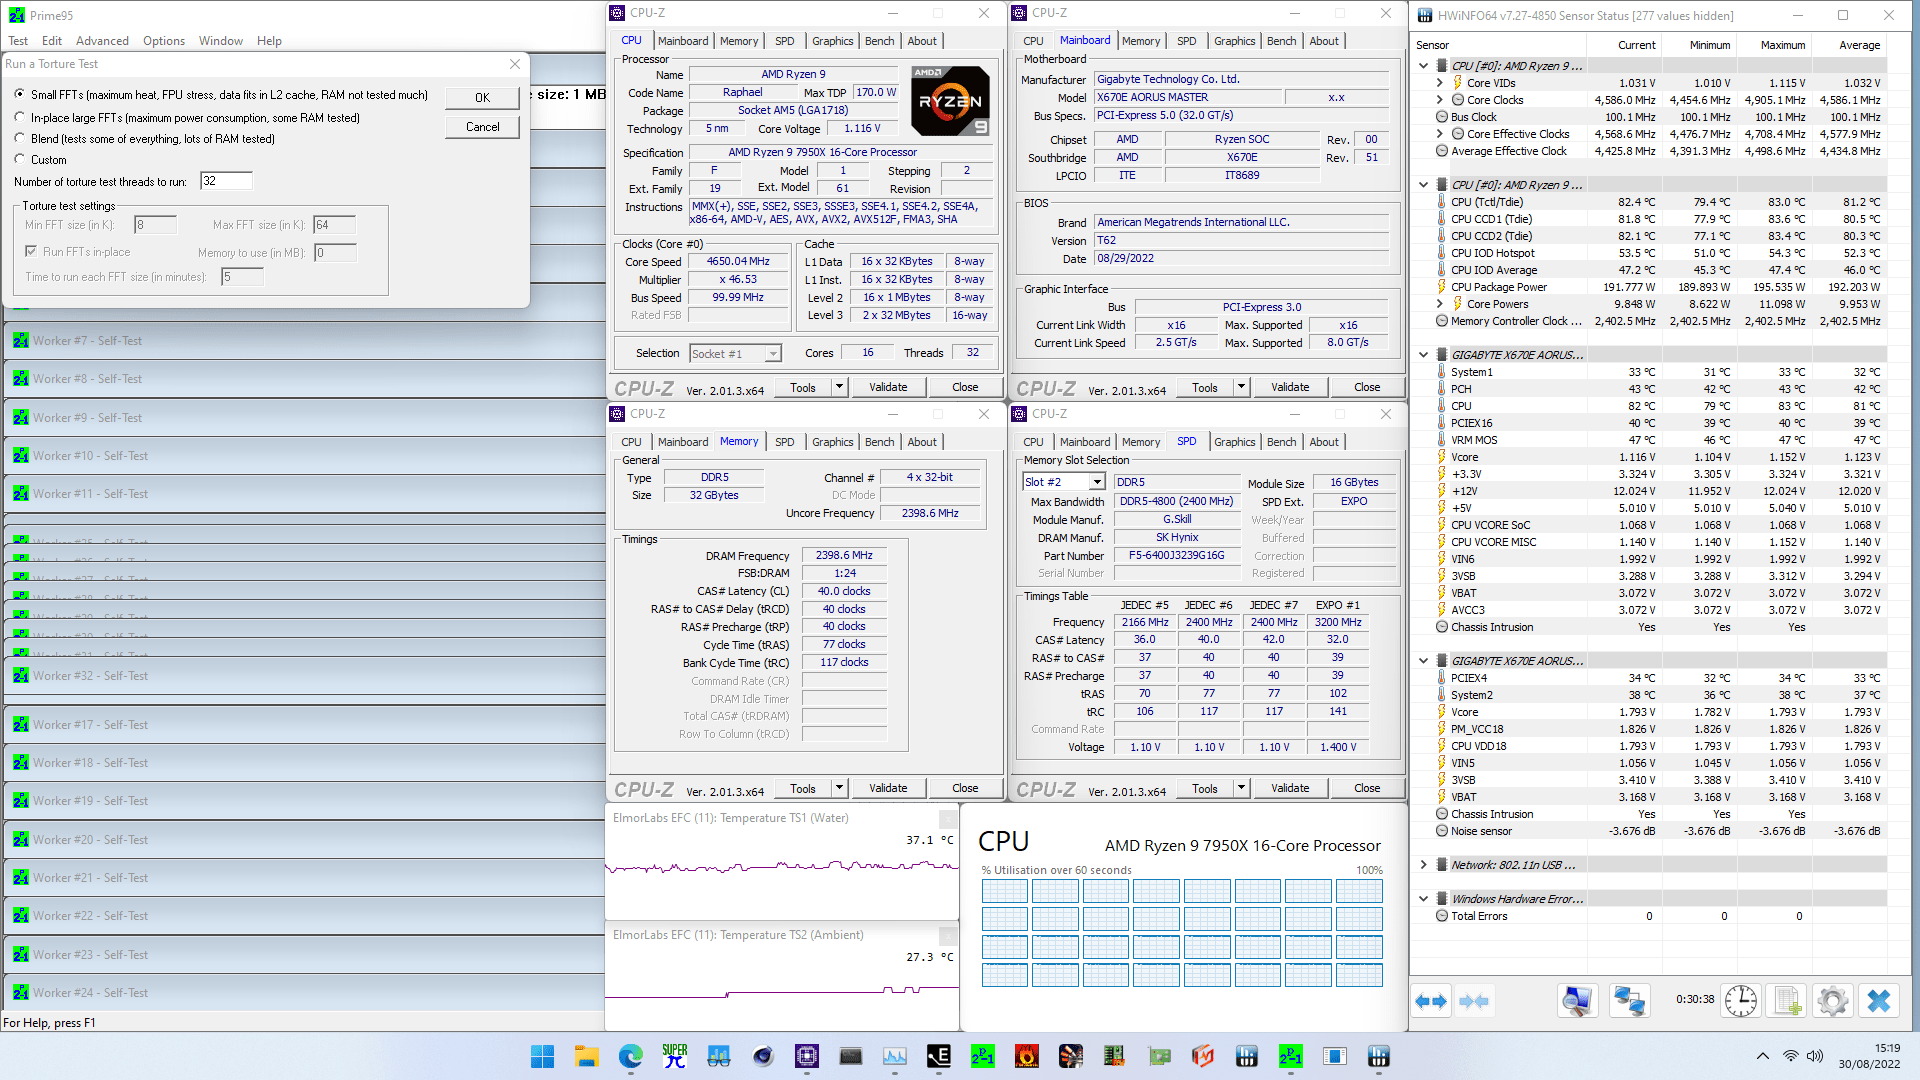
When running Prime 95 Small FFTs with AVX-512 enabled, the average CPU effective clock is 4578 MHz with 1.123 volts. The average CPU temperature is 81.2 degrees Celsius. The ambient and water temperature is 27.3 and 37.1 degrees Celsius. The average CPU package power is 192.2 watts.
When running Prime 95 Small FFTs with AVX disabled, the average CPU effective clock is 4814 MHz with 1.198 volts. The average CPU temperature is 86.1 degrees Celsius. The ambient and water temperature is 26.4 and 36.7 degrees Celsius. The average CPU package power is 204.5 watts.

Now, let us try our first overclocking strategy.
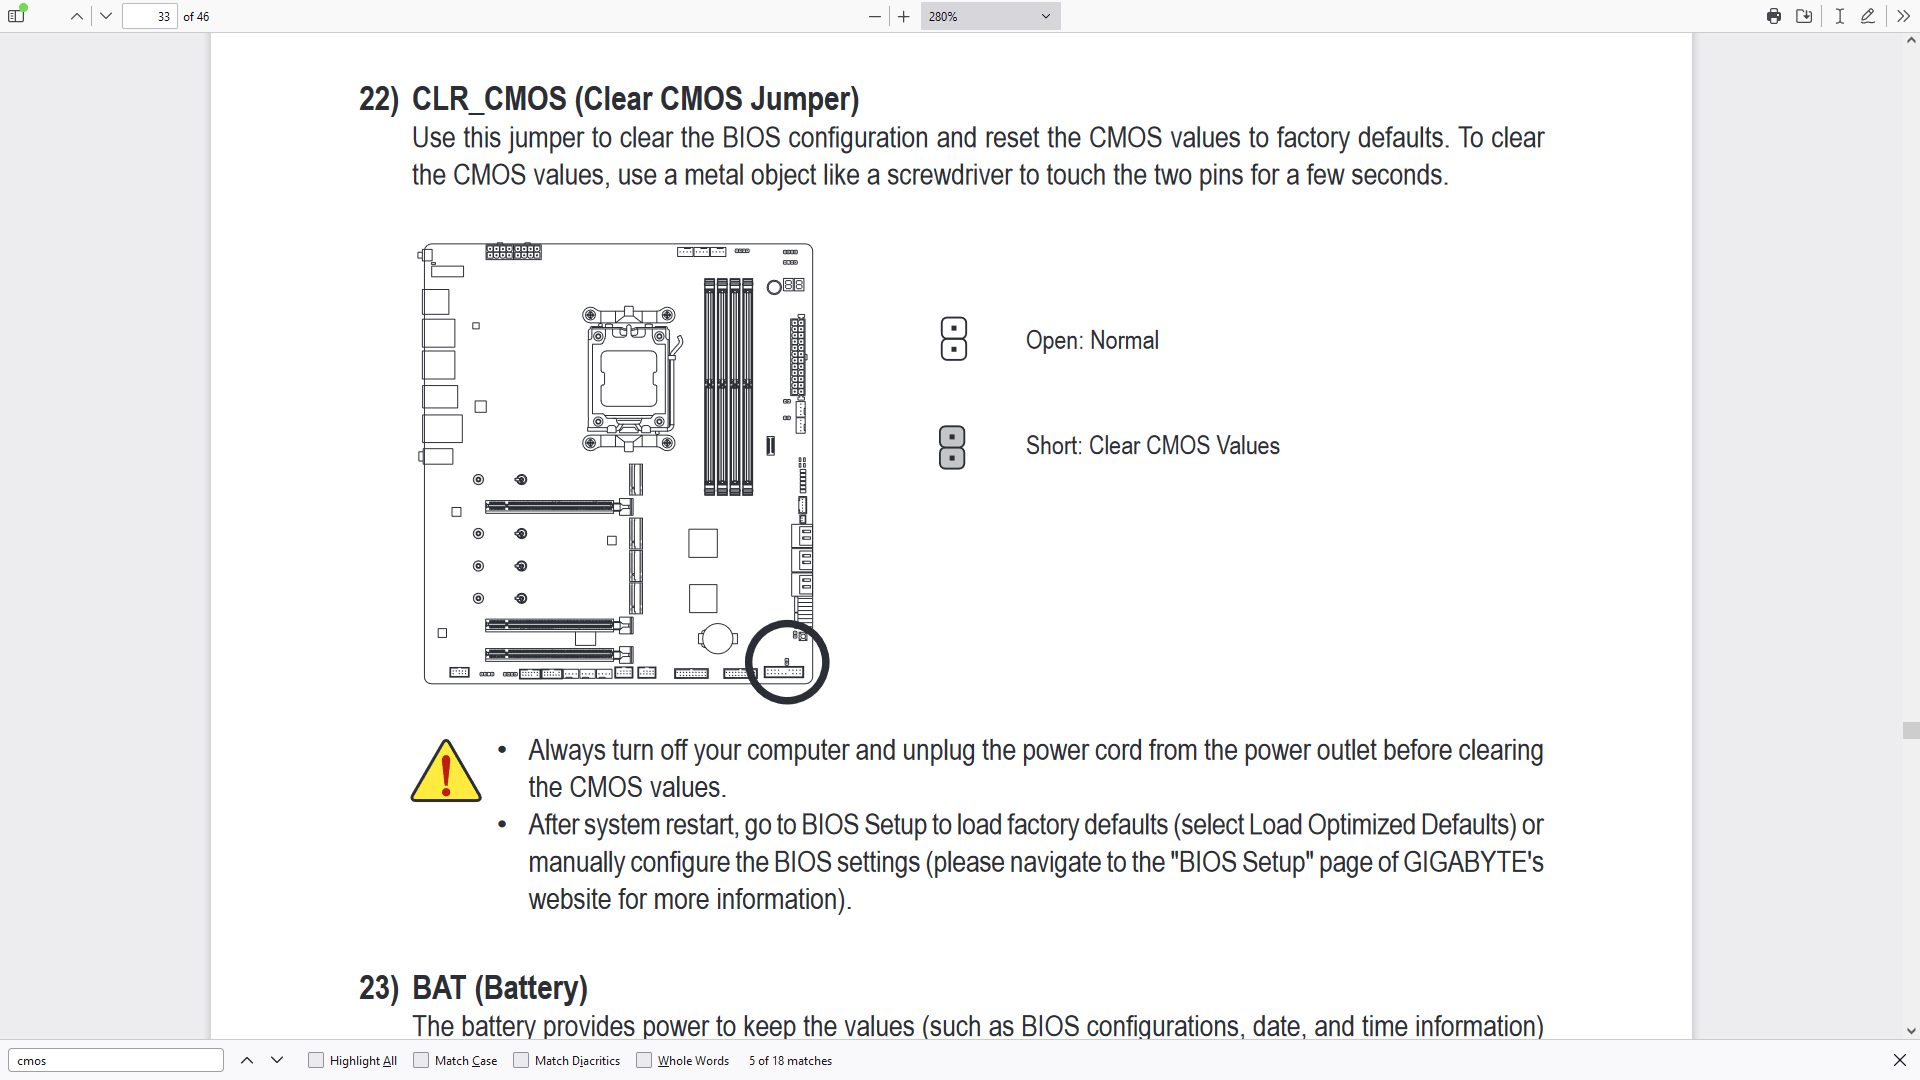
However, before we get going, make sure to locate the CMOS Clear pins
Shorting the Clear CMOS pins will reset all your BIOS settings to default which is helpful if you want to start your BIOS configuration from scratch. However, it does not delete any of the BIOS profiles previously saved. The Clear CMOS pins is located in the bottom right of the motherboard
OC Strategy #1: PBO 2 + EXPO
In our first overclocking strategy, we take advantage of AMD exclusive features Precision Boost Overdrive and Extended Profiles for Overclocking.
PBO 2 – Precision Boost Overdrive 2
With the launch of Zen 3, AMD introduced an improved version of the Precision Boost Overdrive toolkit, allowing for manual tuning of the parameters affecting the Precision Boost frequency boost algorithm.
Precision Boost Overdrive 2 builds on the PBO implementation of Zen 2. In addition to the platform overclocking knobs from Zen+ (PPT, TDC, EDC) and processor overclocking knobs from Zen 2 (Boost Override and Scalar), Precision Boost Overdrive 2 introduces Curve Optimizer.

There are essentially 3 levels of Precision Boost Overdrive
- AMD’s stock values, which can be set by disabling PBO
- The motherboard vendor values, which are programmed into the BIOS to match the motherboard VRM specification and can be set by enabling PBO
- Custom values, which can be programmed by the end-user
I explored the ins and outs of Precision Boost Overdrive 2 tuning in my AMD Raphael Overclocking launch video. If you want to learn more about the impact of each of these settings, I suggest you check out that video.
In this overclocking strategy, we’re just enabling Precision Boost Overdrive, whereas, in the following strategies, we’ll explore tuning the parameters.
We rely on the motherboard pre-programmed PBO parameters by enabling Precision Boost Overdrive. We find that the following values have changed:
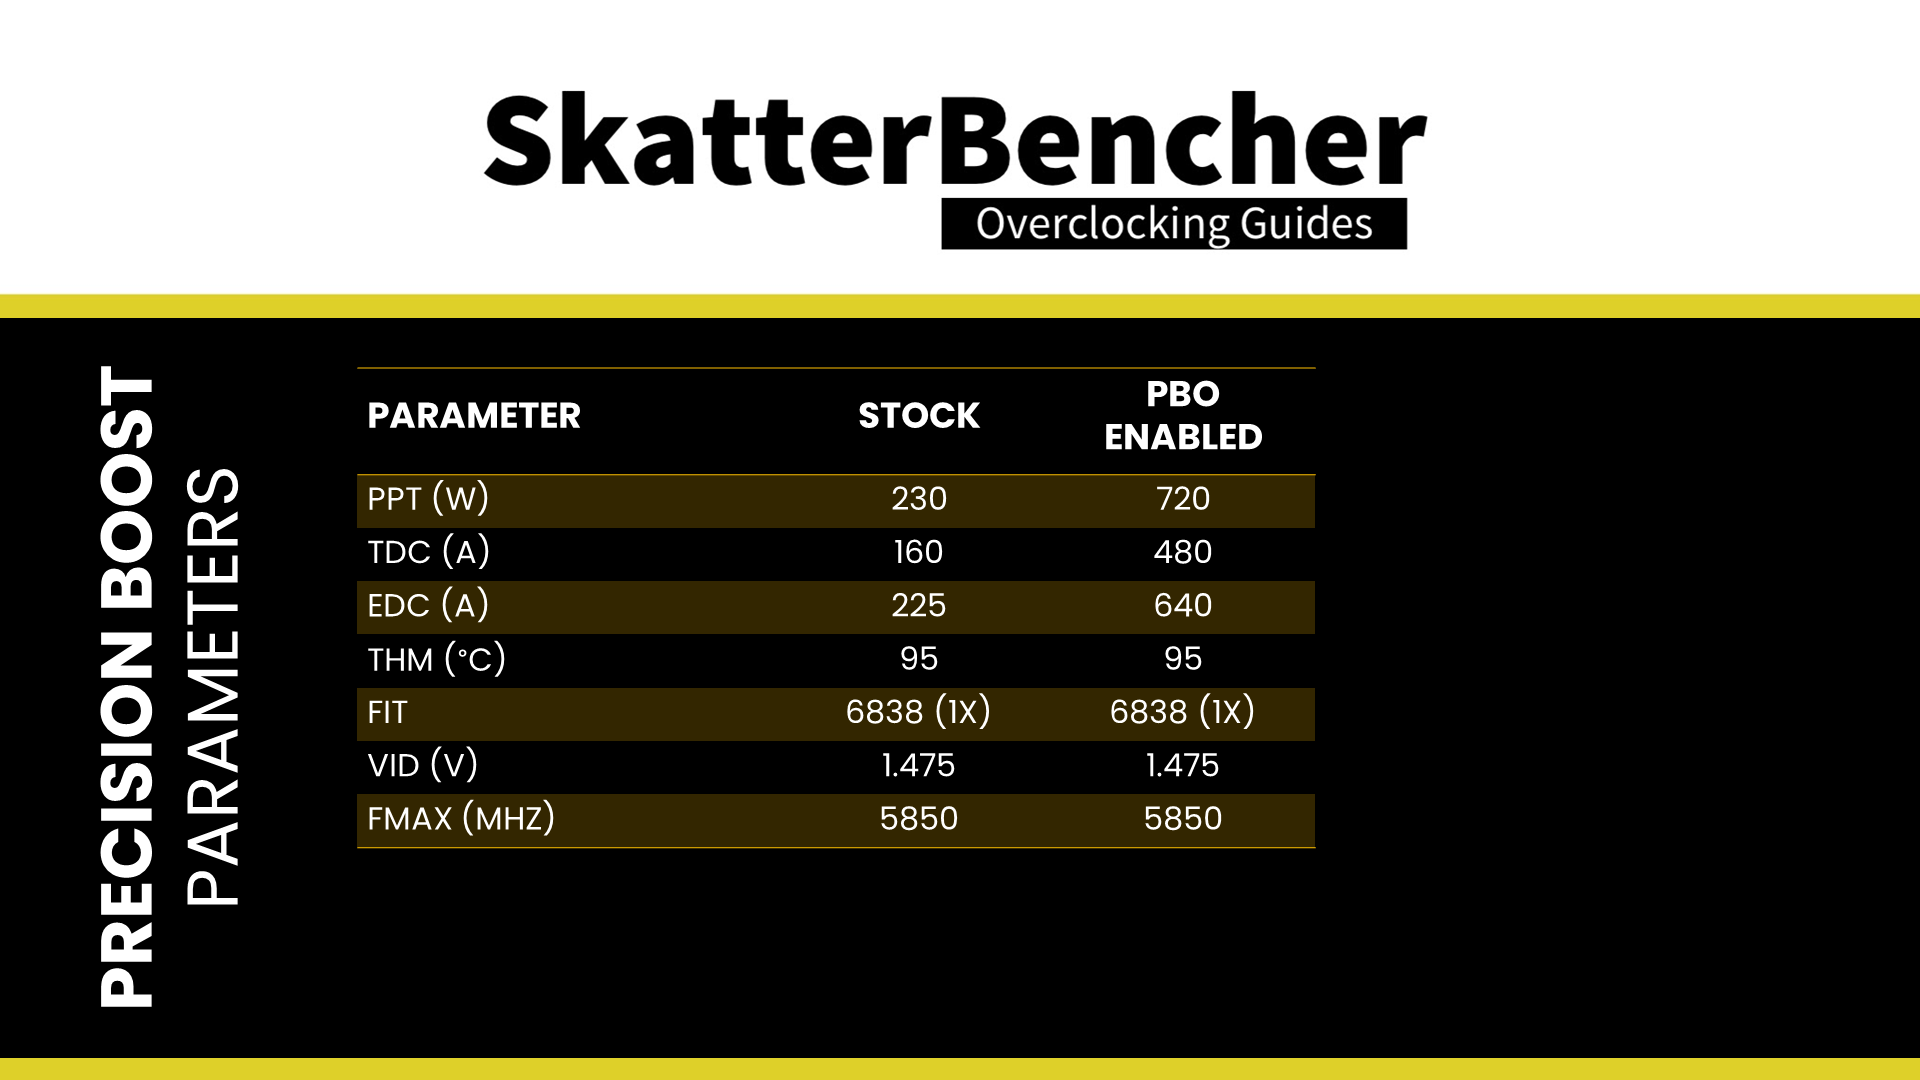
For previous Ryzen CPUs, increasing the platform boost parameters substantially impacted performance. Especially for the higher core-count CPUs. Based on the Prime95 stability test result, where the CPU is running well below its maximum temperature of 95 degrees Celsius, we expect some performance improvement from enabling PBO.
EXPO – Extended Profiles for Overclocking
EXPO stands for AMD Extended Profiles for Overclocking. It is an AMD technology that enables ubiquitous memory overclocking profiles for AMD platforms supporting DDR5 memory. EXPO allows memory vendors such as G.SKILL to program higher performance settings onto the memory sticks. If the motherboard supports EXPO, you can enable higher performance with a single BIOS setting. So, it saves you lots of manual configuration.

While our memory kit is rated at DDR5-6400, I had to run it at DDR5-6000 for stability reasons as my system wasn’t stable at higher frequencies. I’m using an early CPU, motherboard, and BIOS combination, so memory overclocking may improve soon.
BIOS Settings & Benchmark Results
Upon entering the BIOS
- Switch to Advanced Mode
- Enter the Advanced CPU Settings submenu
- Enter the Precision Boost Overdrive submenu
- Set Precision Boost Overdrive to Enabled
- Leave the Precision Boost Overdrive submenu
- Enter the Precision Boost Overdrive submenu
- Leave the Advanced CPU Settings submenu
- Set Extreme Memory Profile(XMP/EXPO) to EXPO 1
- Set System Memory Multiplier to 60.00
Then save and exit the BIOS.
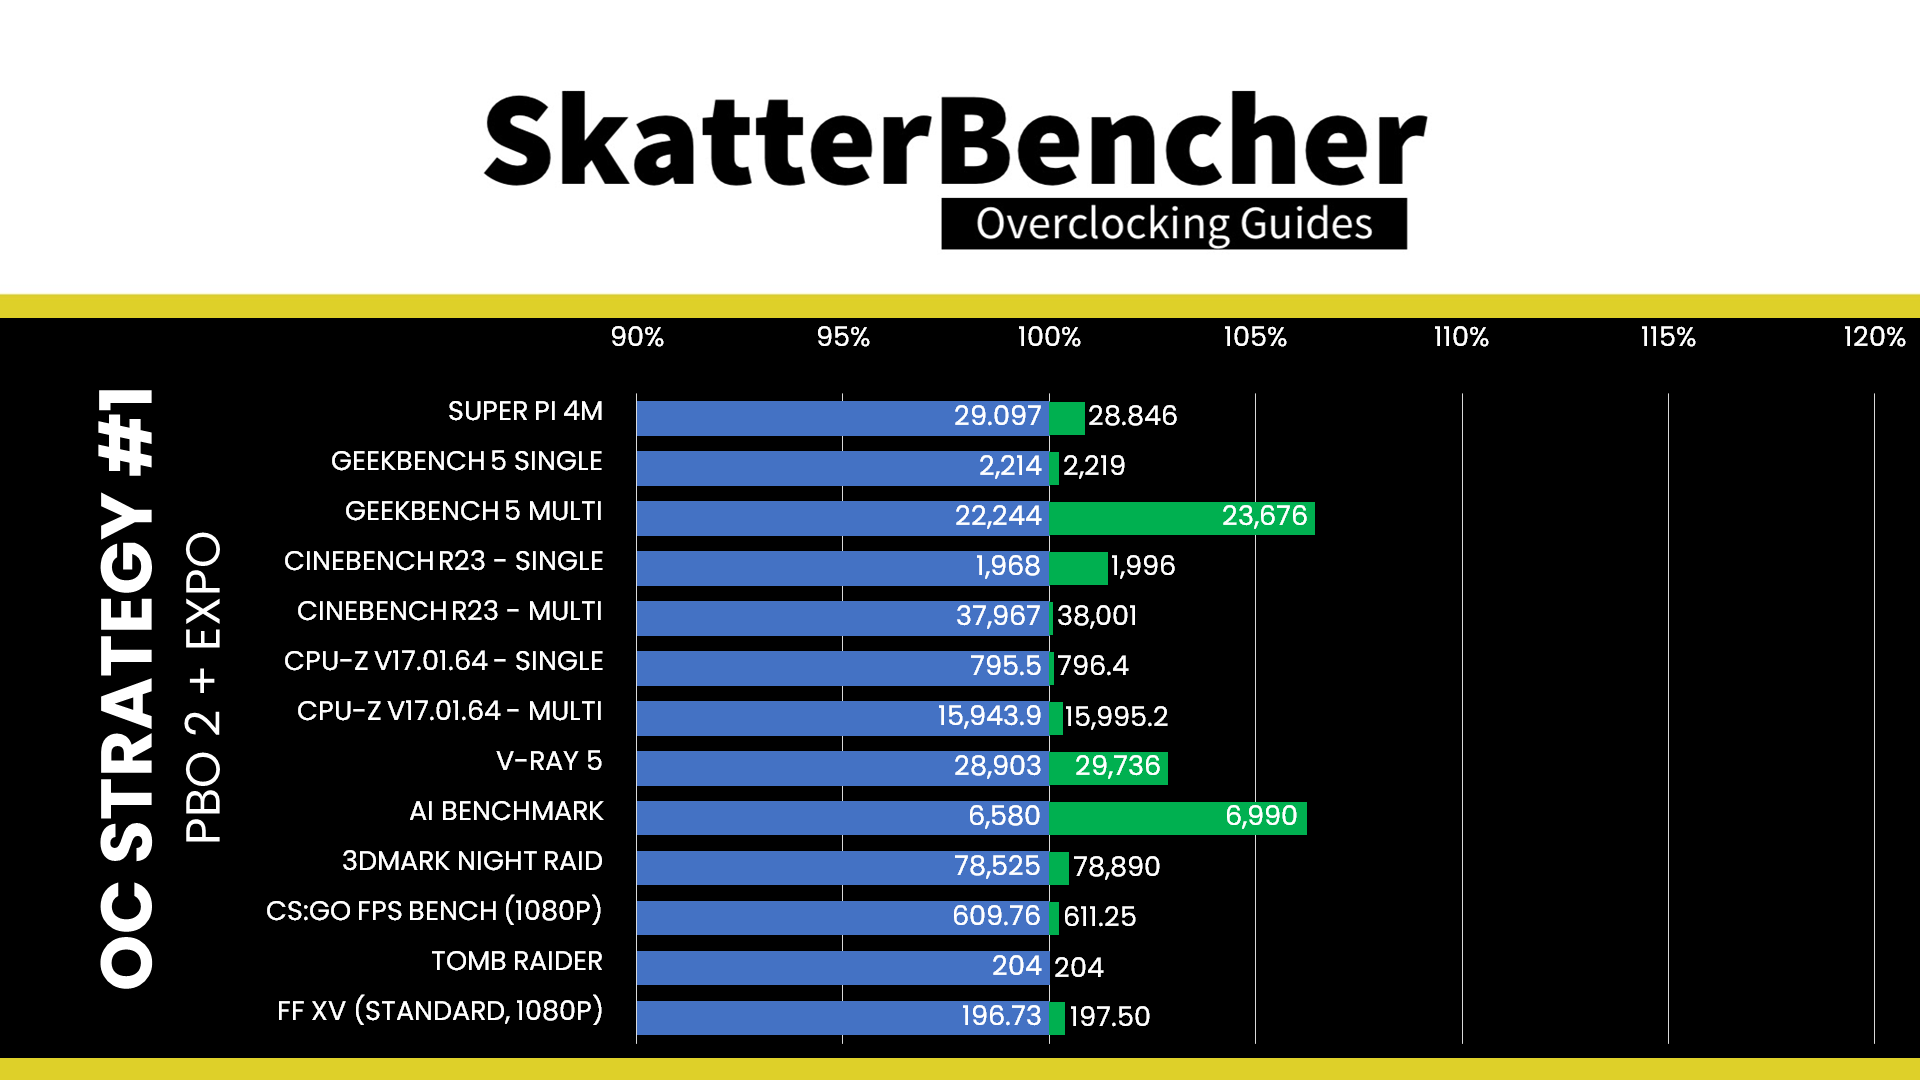
We re-ran the benchmarks and checked the performance increase compared to the default operation.
- SuperPI 4M: +0.87%
- Geekbench 5 (single): +0.23%
- Geekbench 5 (multi): +6.44%
- Cinebench R23 Single: +1.42%
- Cinebench R23 Multi: +0.09%
- CPU-Z V17.01.64 Single: +0.11%
- CPU-Z V17.01.64 Multi: +0.32%
- V-Ray 5: +2.88%
- AI Benchmark: +6.23%
- 3DMark Night Raid: +0.46%
- CS:GO FPS Bench: +0.24%
- Tomb Raider: +0.00%%
- Final Fantasy XV: +0.39%
Here are the 3DMark CPU Profile scores at stock
- CPU Profile 1 Thread: +0.72%
- CPU Profile 2 Threads: +0.27%
- CPU Profile 4 Threads: +0.02%
- CPU Profile 8 Threads: +0.04%
- CPU Profile 16 Threads: +0.36%
- CPU Profile Max Threads: +0.01%
As expected, enabling Precision Boost Overdrive helps improve the system performance in multi-threaded benchmarks. In additoin, thanks to enabling EXPO, however, we do see a performance improvement of 6.44% in Geekbench 5.
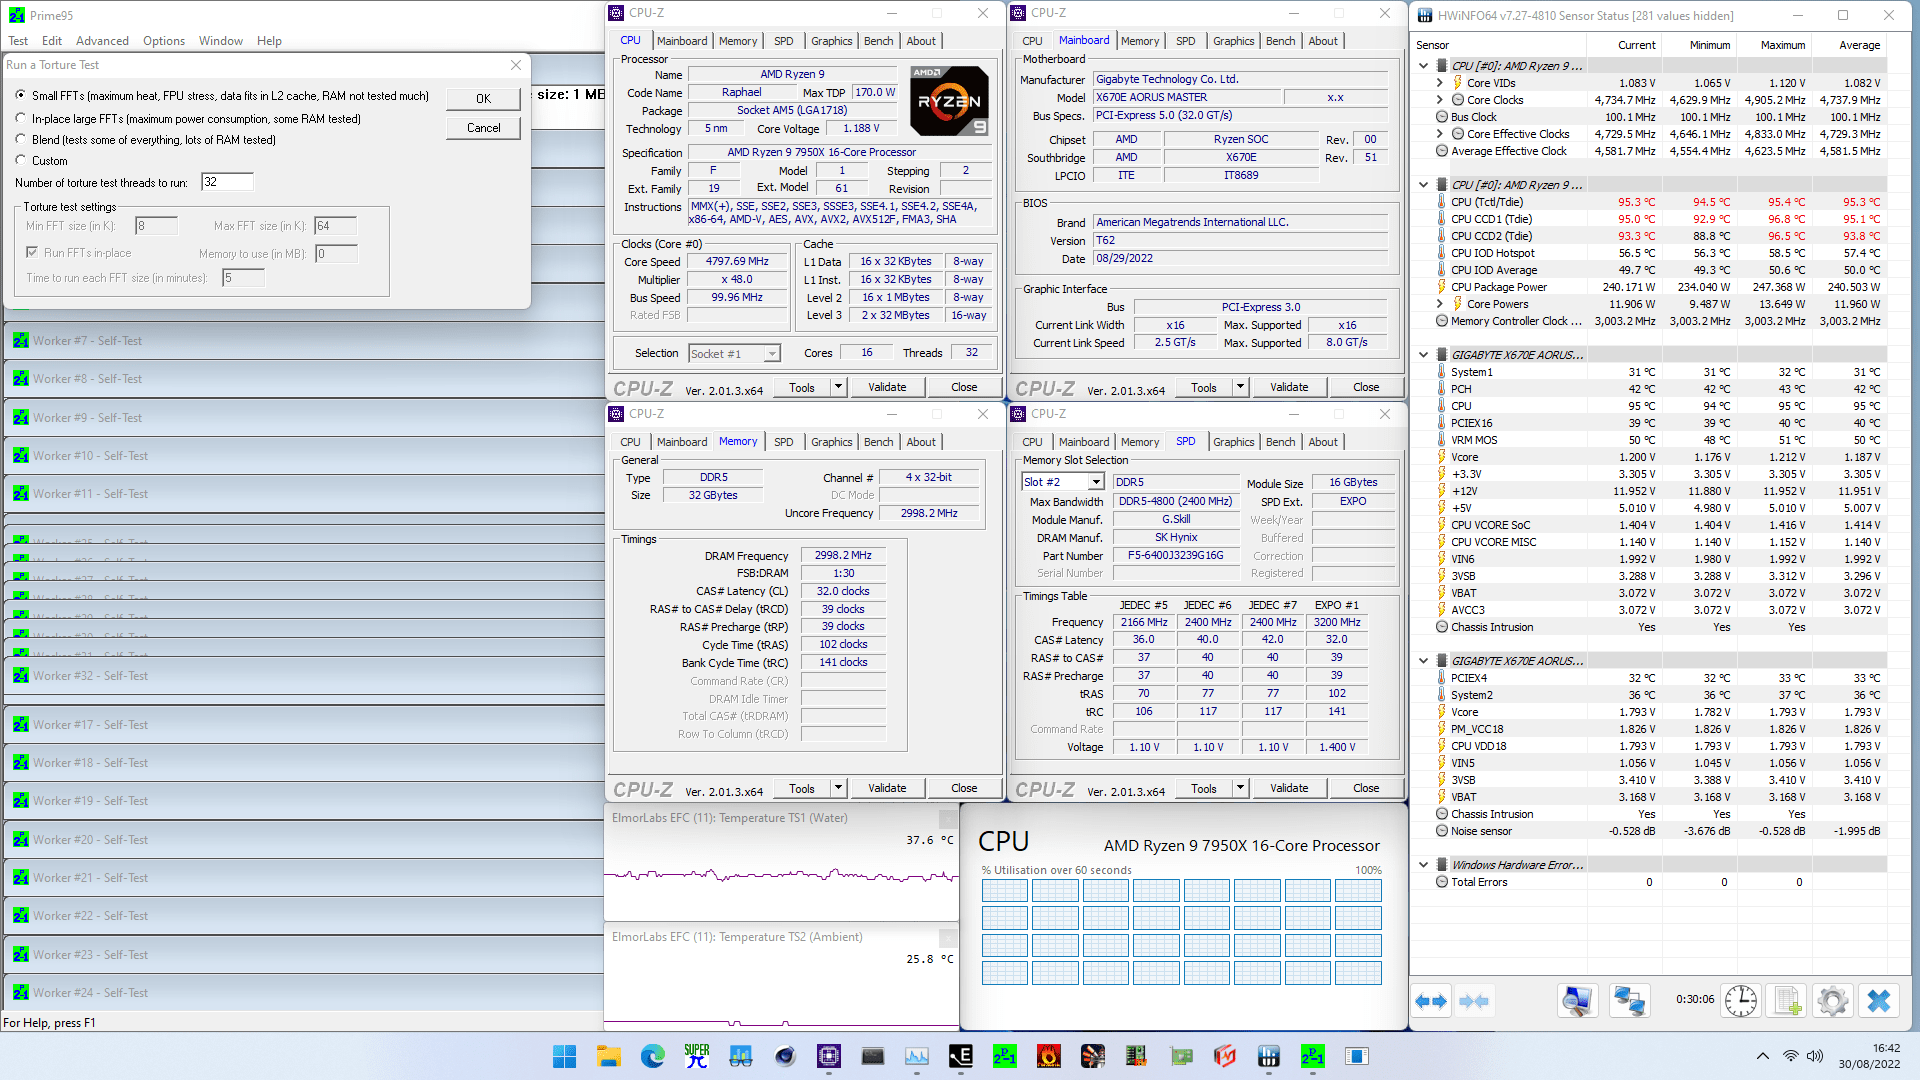
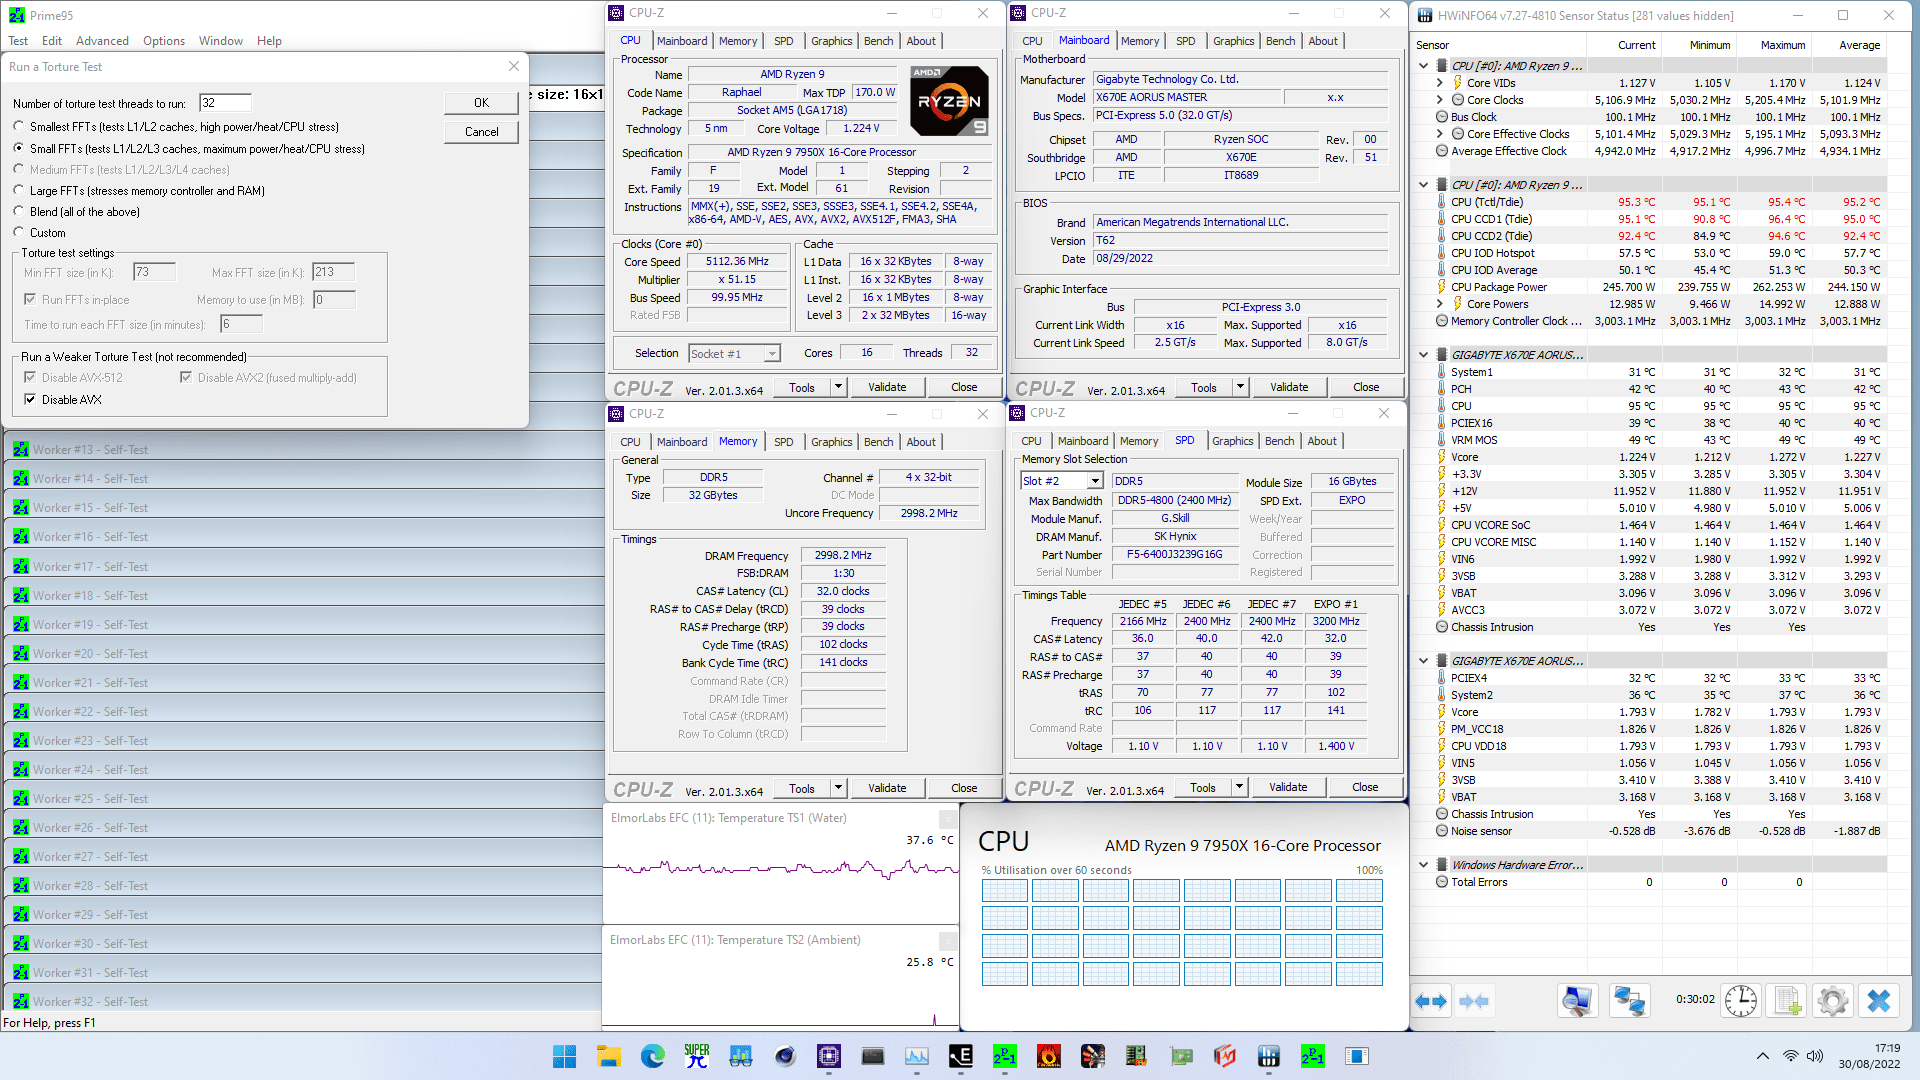
When running Prime 95 Small FFTs with AVX-512 enabled, the average CPU effective clock is 4729 MHz with 1.187 volts. The average CPU temperature is 95.3 degrees Celsius. The ambient and water temperature is 25.8 and 37.6 degrees Celsius. The average CPU package power is 240.5 watts.
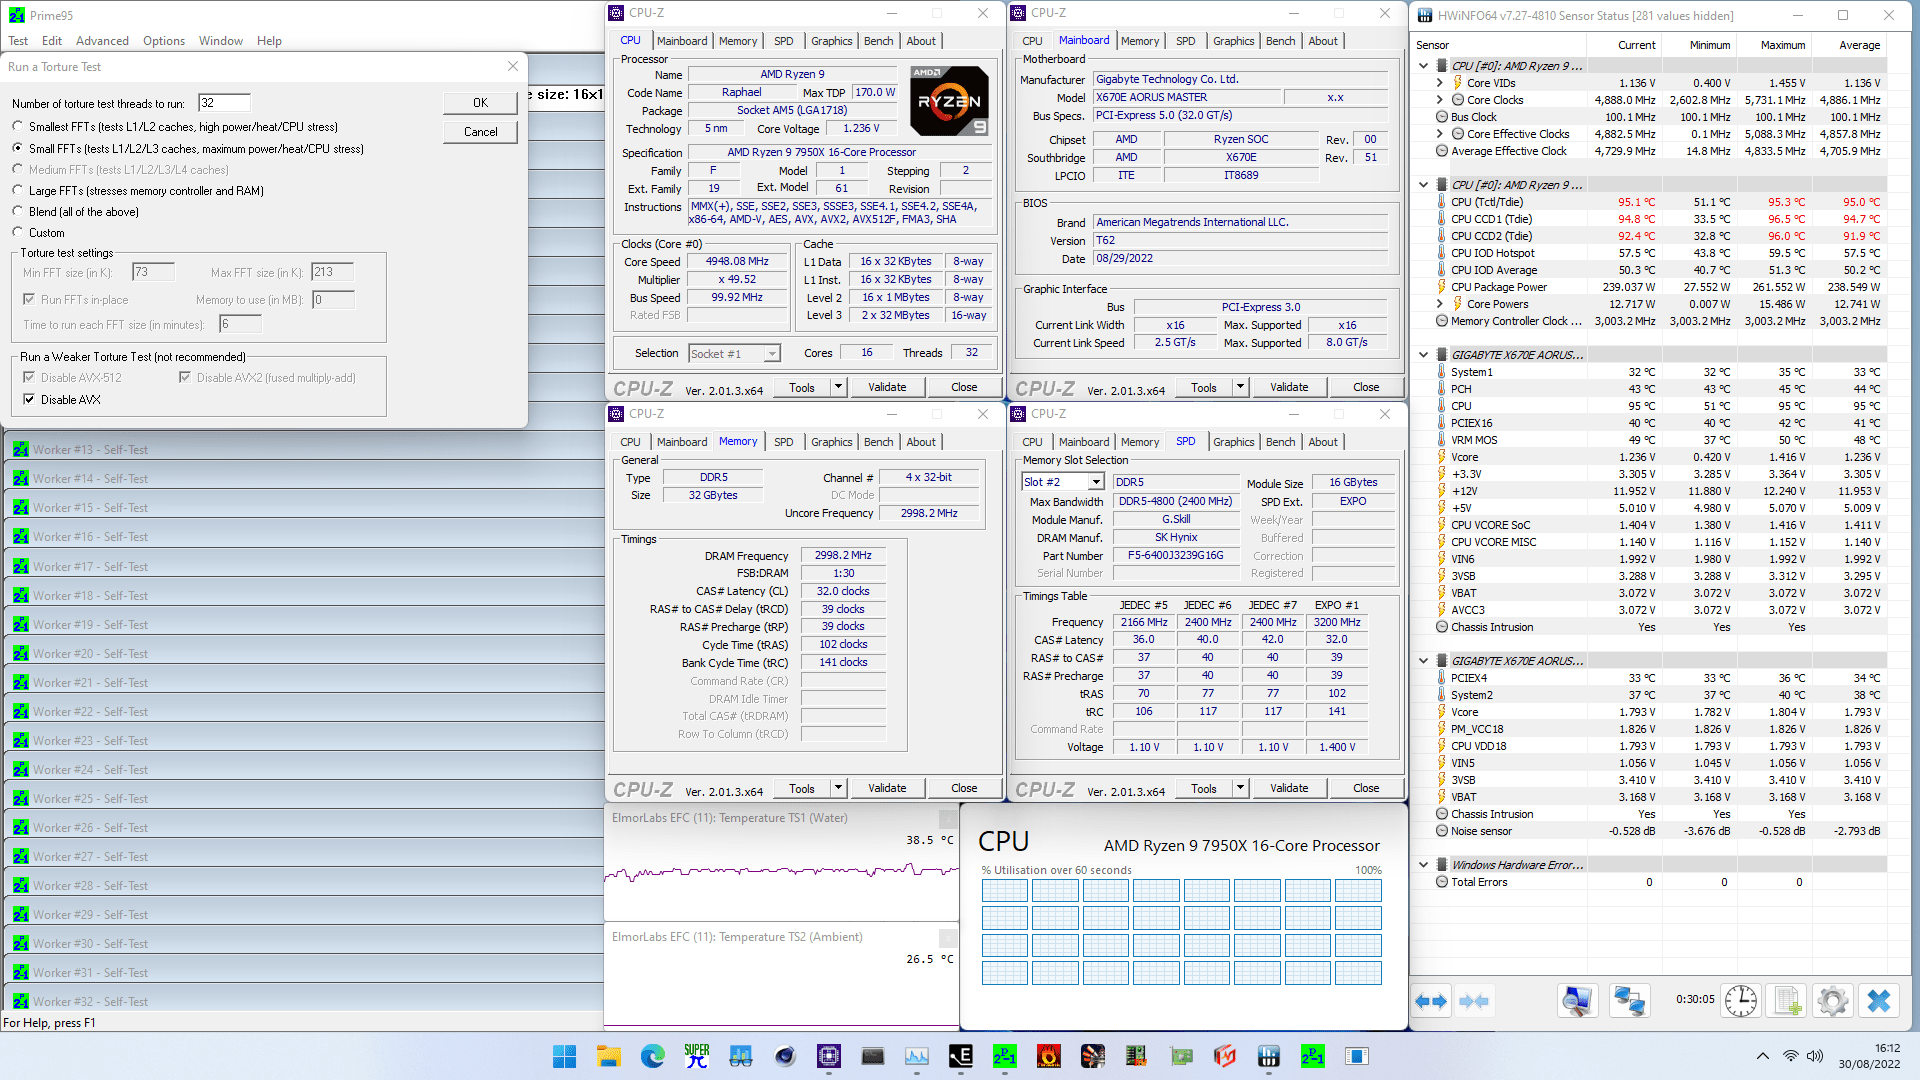
When running Prime 95 Small FFTs with AVX disabled, the average CPU effective clock is 4857 MHz with 1.236 volts. The average CPU temperature is 95.0 degrees Celsius. The ambient and water temperature is 26.5 and 38.5 degrees Celsius. The average CPU package power is 238.5 watts.
OC Strategy #2: PBO Tuned with Curve Optimizer
In our second overclocking strategy, we will use the Curve Optimizer tool included in the Precision Boost Overdrive overclocker’s toolkit.
PBO 2: Curve Optimizer
As I mentioned earlier in this article, Curve Optimizer is an important new feature of Precision Boost Overdrive 2.

Curve Optimizer allows end-users to adjust the factory-fused VFT curve, or voltage-frequency-temperature curve, for each CPU core separately. The VFT curve is a unique curve for each core inside your CPU that defines the required voltage for a given frequency at a given temperature. Higher frequencies or higher operating temperatures require higher voltage.
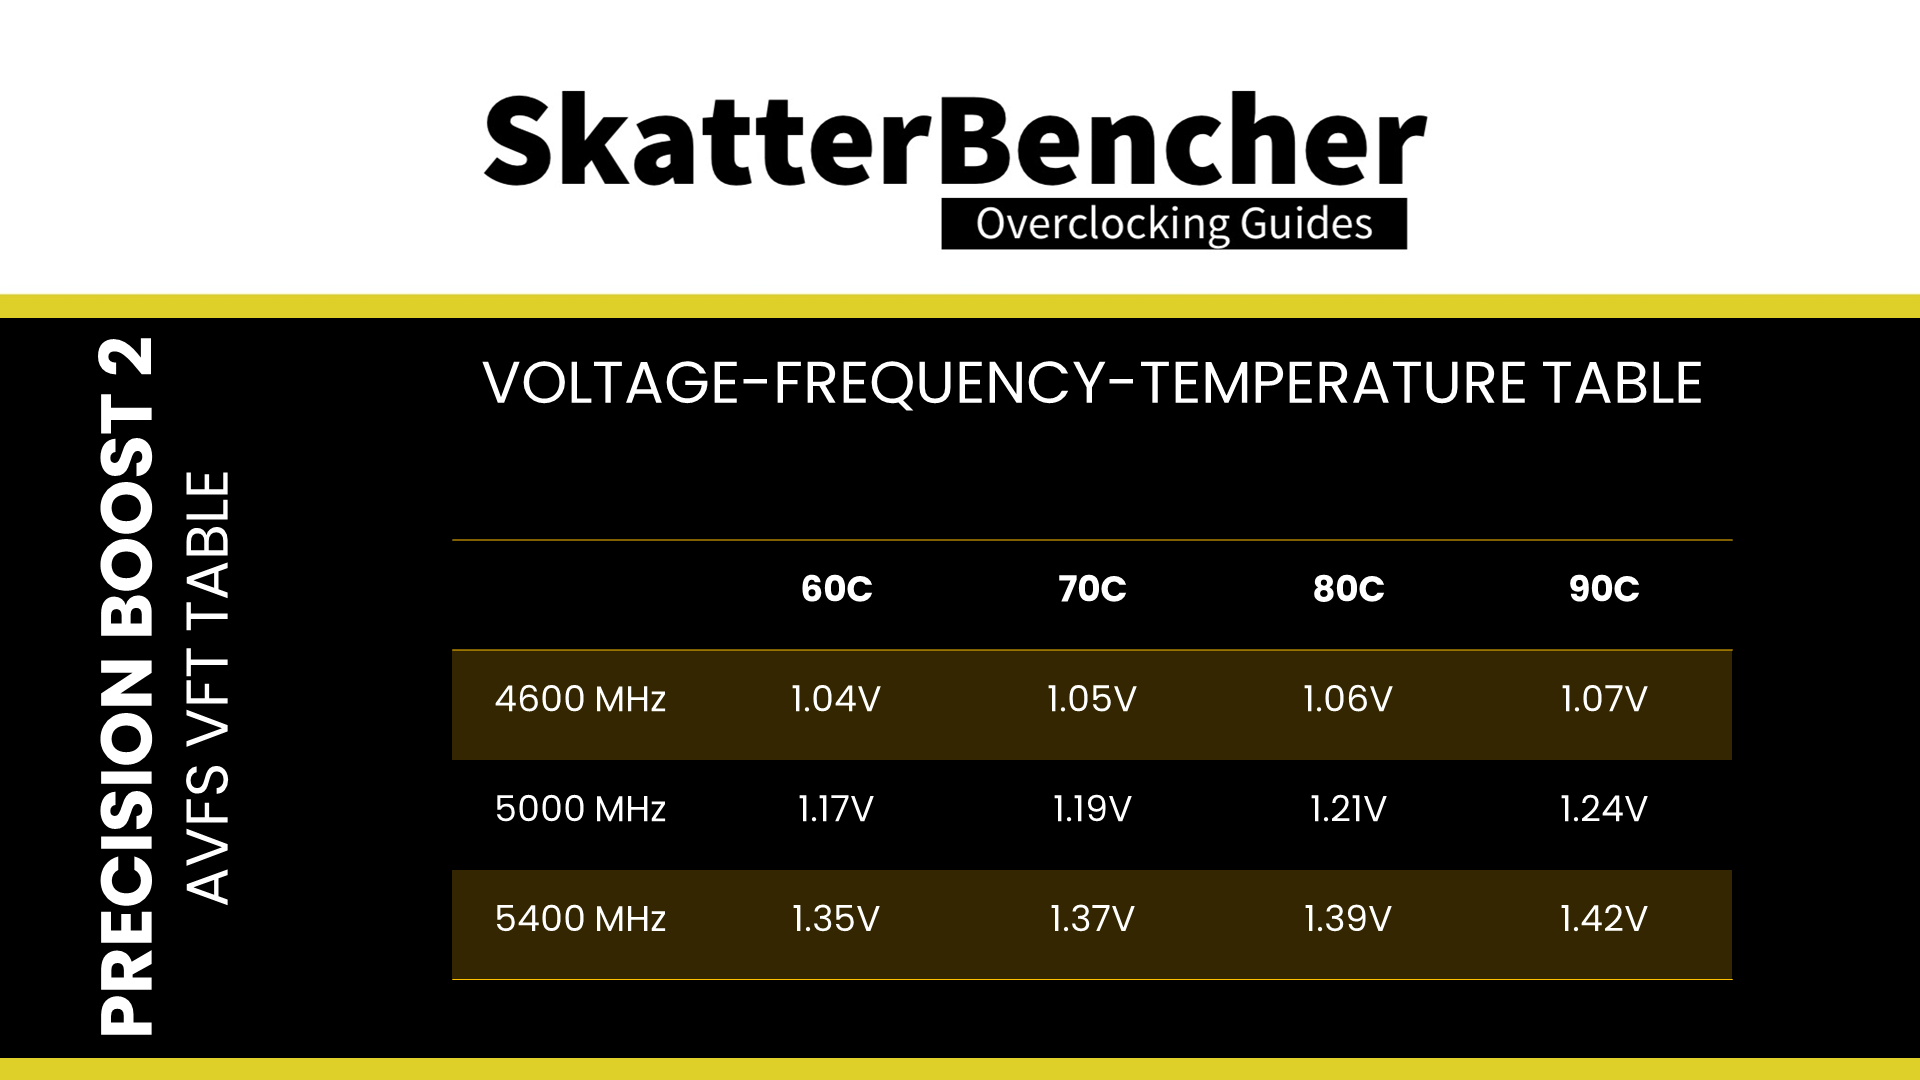
Curve Optimizer adjusts the VFT curve by offsetting the voltages of the factory-fused VFT curve. By setting a positive curve optimizer, you increase the voltage point. Conversely, you decrease the voltage point by setting a negative curve optimizer.


You can offset the entire curve by up to 30 steps in a positive direction and up to 300 steps in a negative direction. Each step represents approximately 5 to 7 mV.
The traditional overclocking approach for AMD Ryzen CPUs is to set a negative curve optimizer. Two things happen when you adjust the VFT curve with a negative point offset.
- You effectively tell the CPU that it needs less voltage for a given frequency. And, as a consequence, at a given voltage, it can apply a higher frequency. So, when the Precision Boost 2 algorithm determines sufficient power and temperature headroom to use 1.35V, with the negative point offset, it will target a higher frequency.
- The CPU temperature will be lower because you use less voltage at a given frequency. That extra thermal headroom will also encourage the Precision Boost algorithm to target higher voltages and frequencies.
In my AMD Raphael overclocking launch article, I explored the ins and outs of Curve Optimizing with Precision Boost Overdrive 2. If you want to learn more about the impact of Curve Optimizer, I suggest you check out that article.
As I mentioned already, Curve Optimizer is available on a per-core basis. Just like in the past, per-core tuning is a real benefit as it provides some cores with a lot more frequency headroom.
Curve Optimizer Tuning Process
The manual tuning process for Curve Optimizer can become quite convoluted since it affects the CPU core voltage in all scenarios ranging from very light single-threaded workloads to heavy all-core workloads.
My Curve Optimizer process for this Ryzen 9 7950X was as follows.
First, I use a broad tuning approach to get a big-picture understanding of the tuning opportunity. Then, I narrow down the per-core curve optimizer settings to achieve stability in a light workload. Then, I verify the stability in all-core multi-threaded workloads. Lastly, I run through all my benchmarks to validate stability in a wide range of test scenarios.
The broad tuning process includes:
- Using SuperPI 32M with affinity to a specific thread to check the maximum effective clock frequency
- Gradually increasing an all-core negative curve optimizer until the point of instability
- Gradually increasing Fmax Boost Override in case the boost frequency is hitting the frequency ceiling
The narrow tuning process includes:
- Using SuperPI 32M with affinity to a specific thread to check the maximum effective clock frequency
- Gradually increasing the per core negative curve optimizer until the point of instability for each core
- Gradually increasing Fmax Boost Override in case the boost frequency is hitting the frequency ceiling
The all-core stability process includes running Prime 95 Small FFTs with both AVX-512 enabled and disabled.
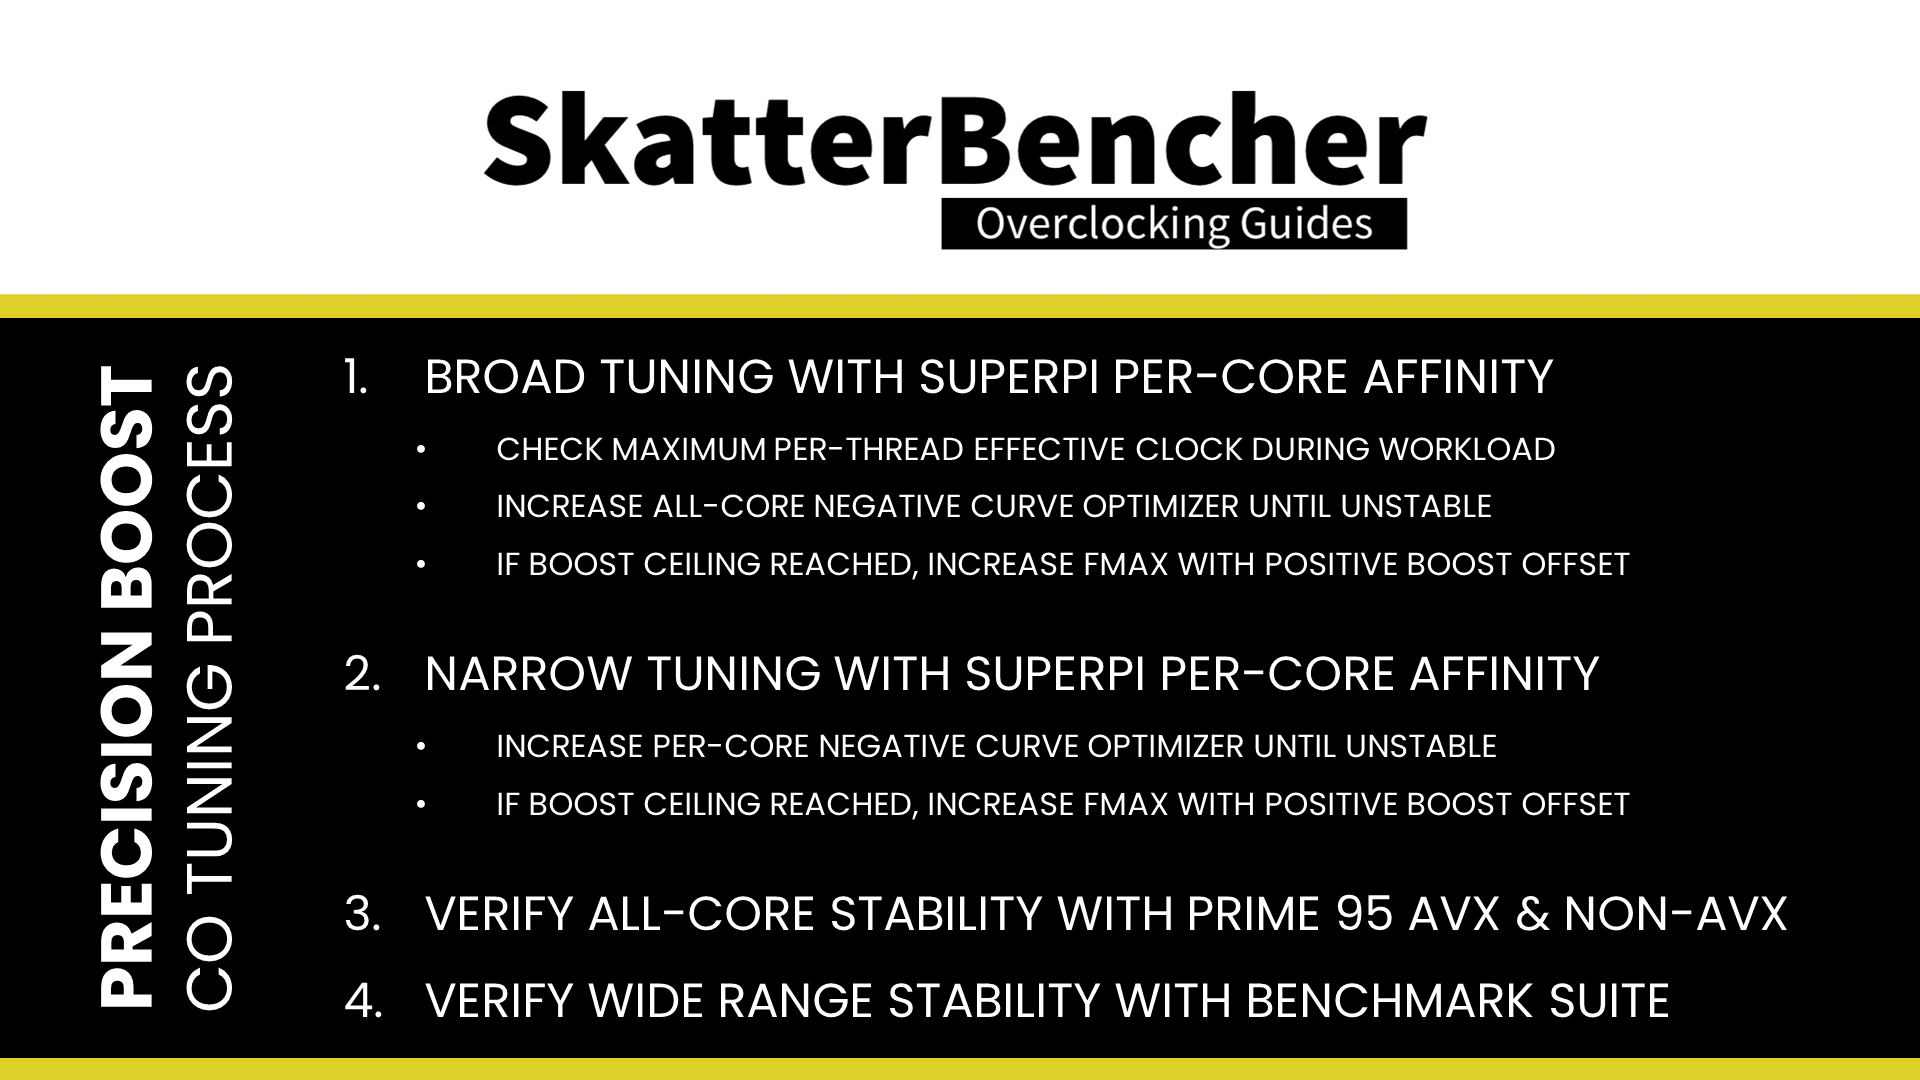
The benchmark validation process includes completing all the benchmarks I’ve included in this guide. If a benchmark is unstable, I increase every core’s per-core curve optimizer value by 2 until I reach stability.
In my case, I used an all-core Curve Optimizer of -25 and a Fmax boost override of +100 MHz.
I will show you the BIOS configuration in a minute. But first, please note that the curve optimizer settings are CPU-specific, and the optimal values of your CPU may differ substantially. I also want to emphasize that this particular CPU is a fantastic overclocker. I’ve seen CPUs that struggle to stably run even -5 curve optimizer.
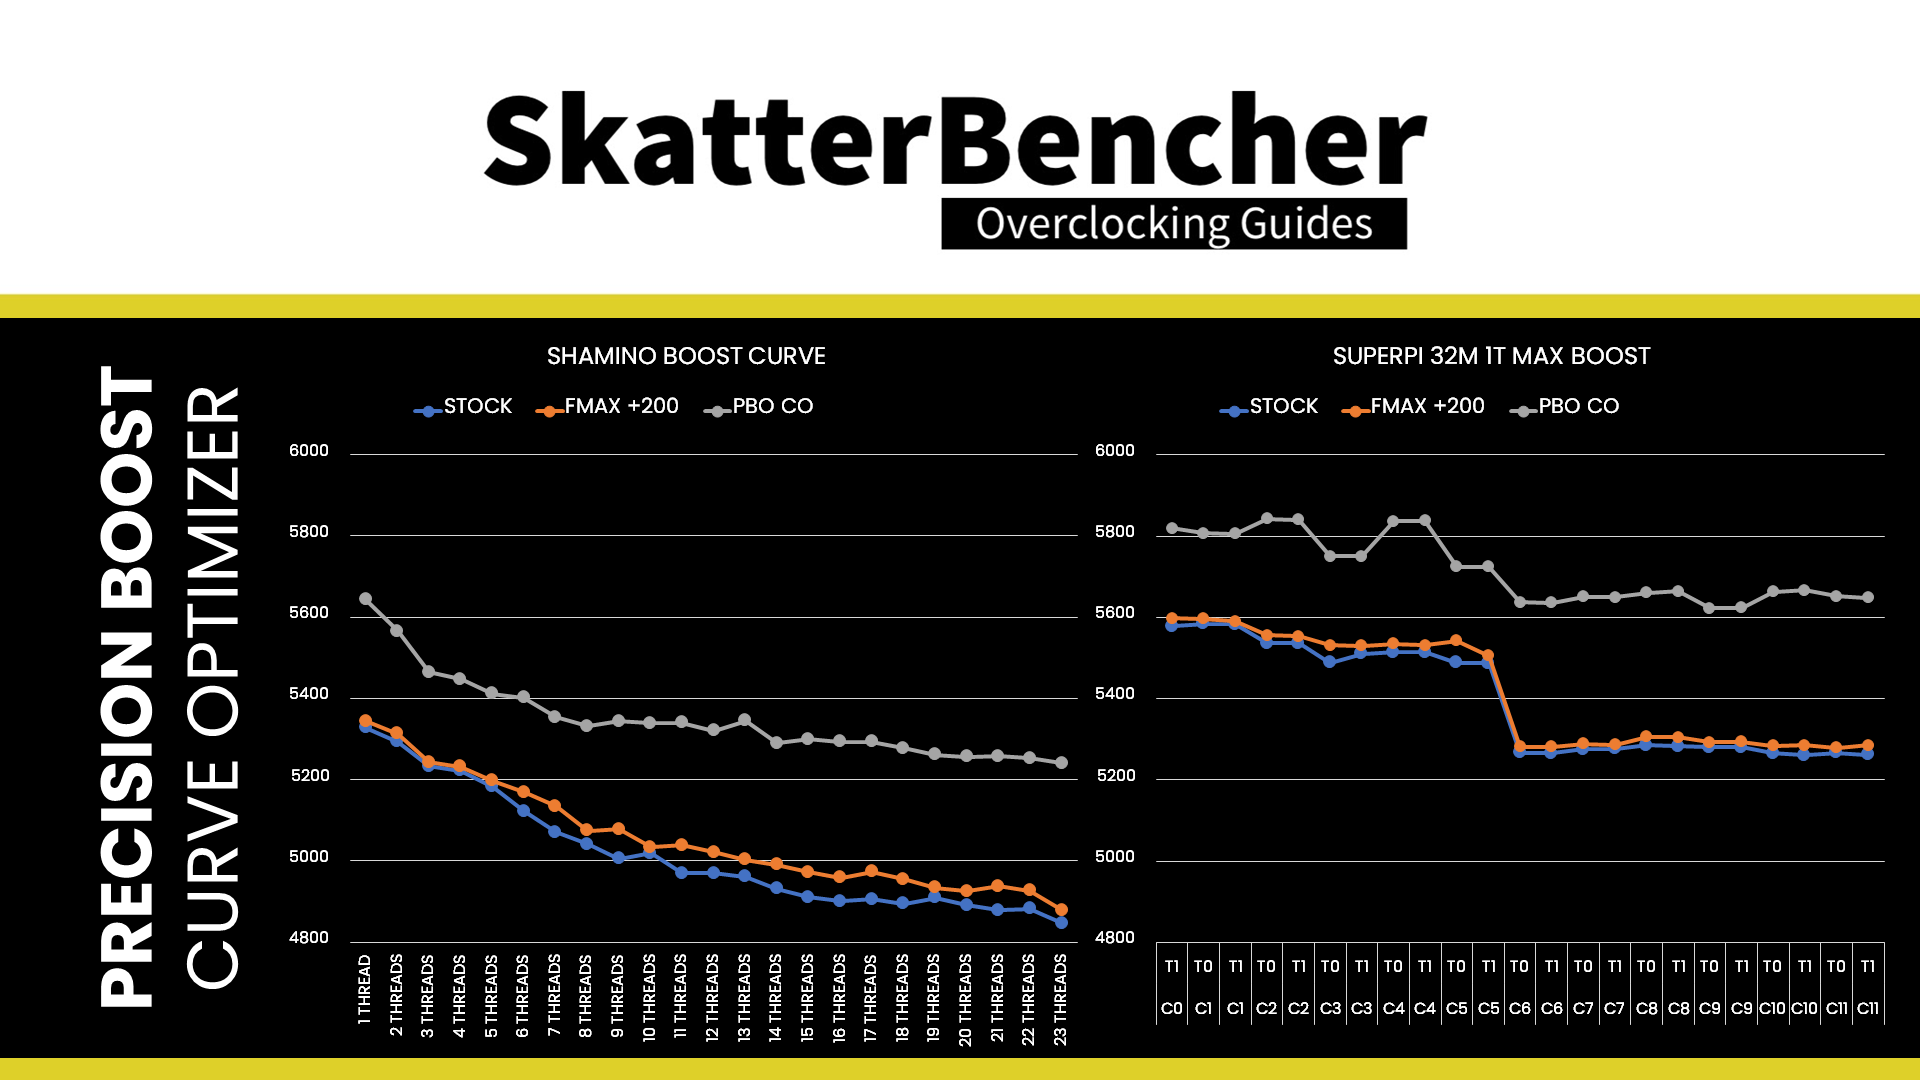
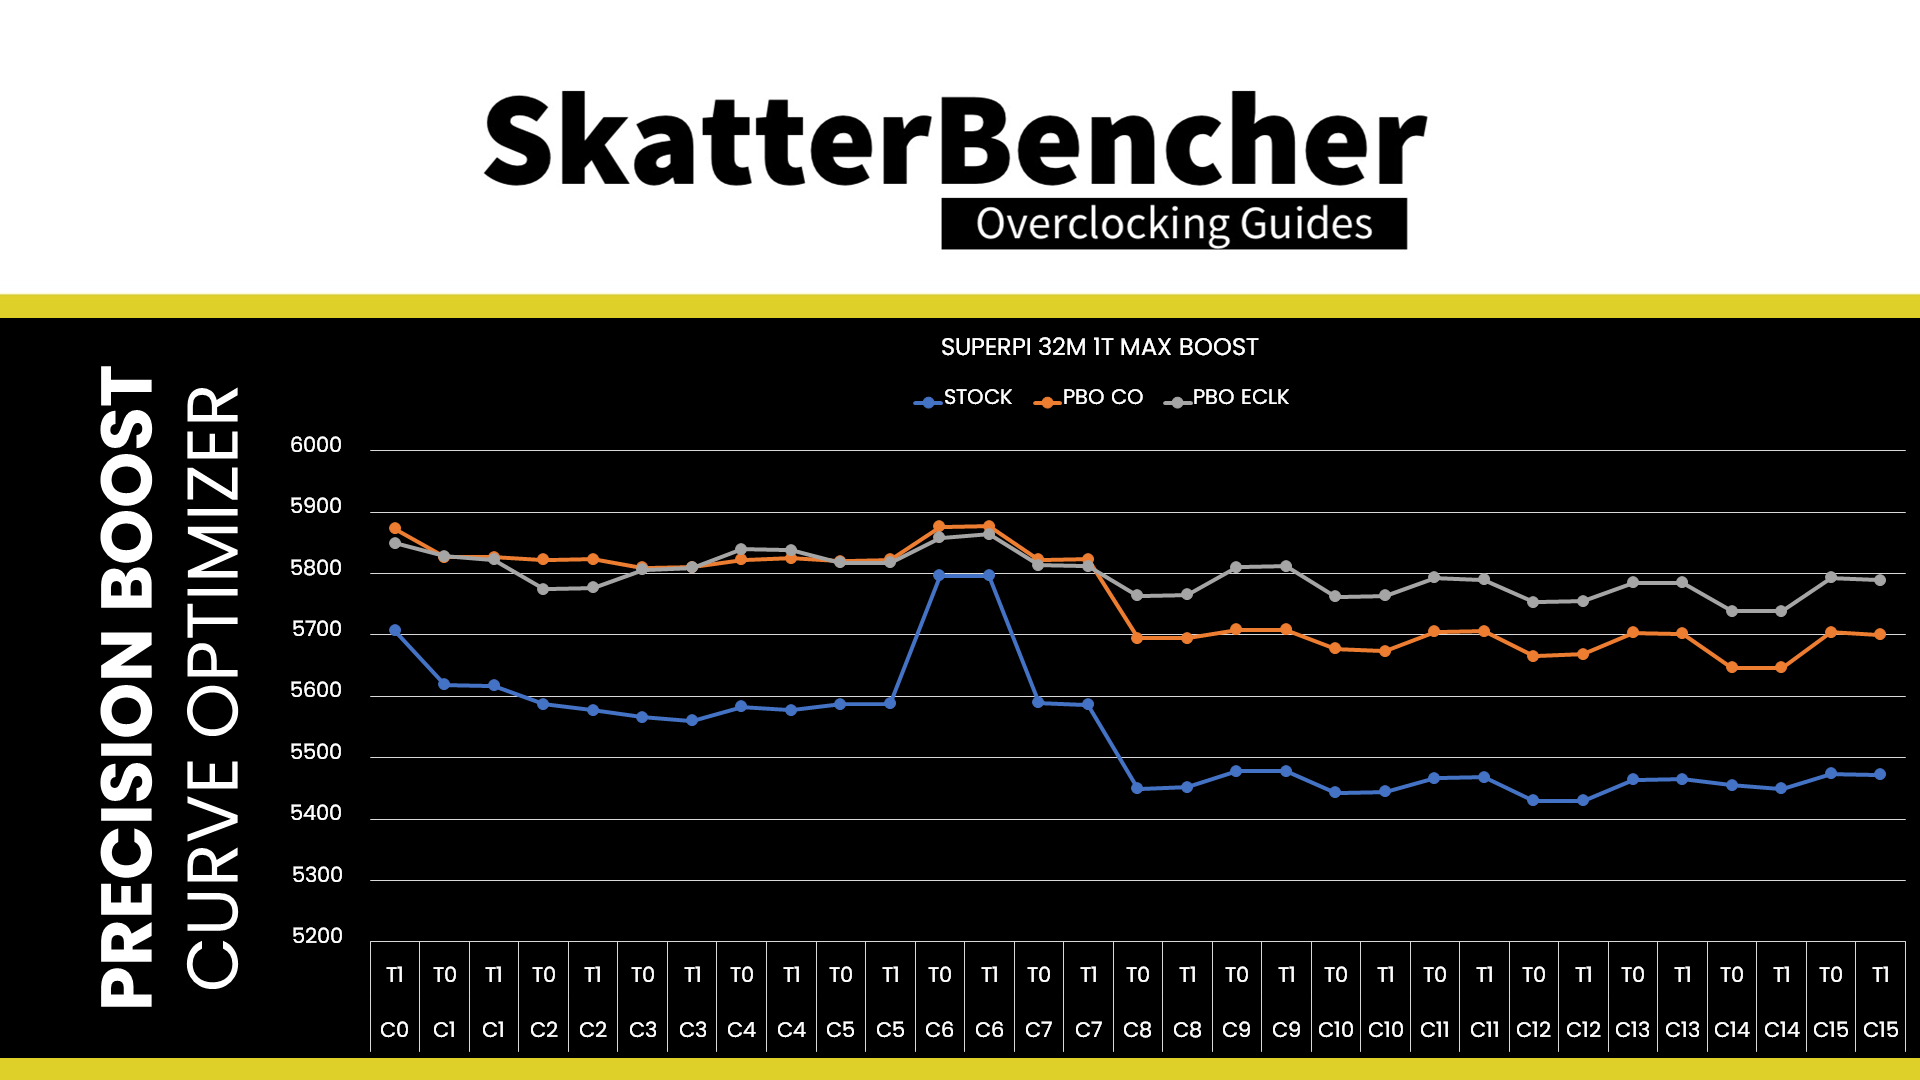
The following table shows the boost profile for this specific CPU.
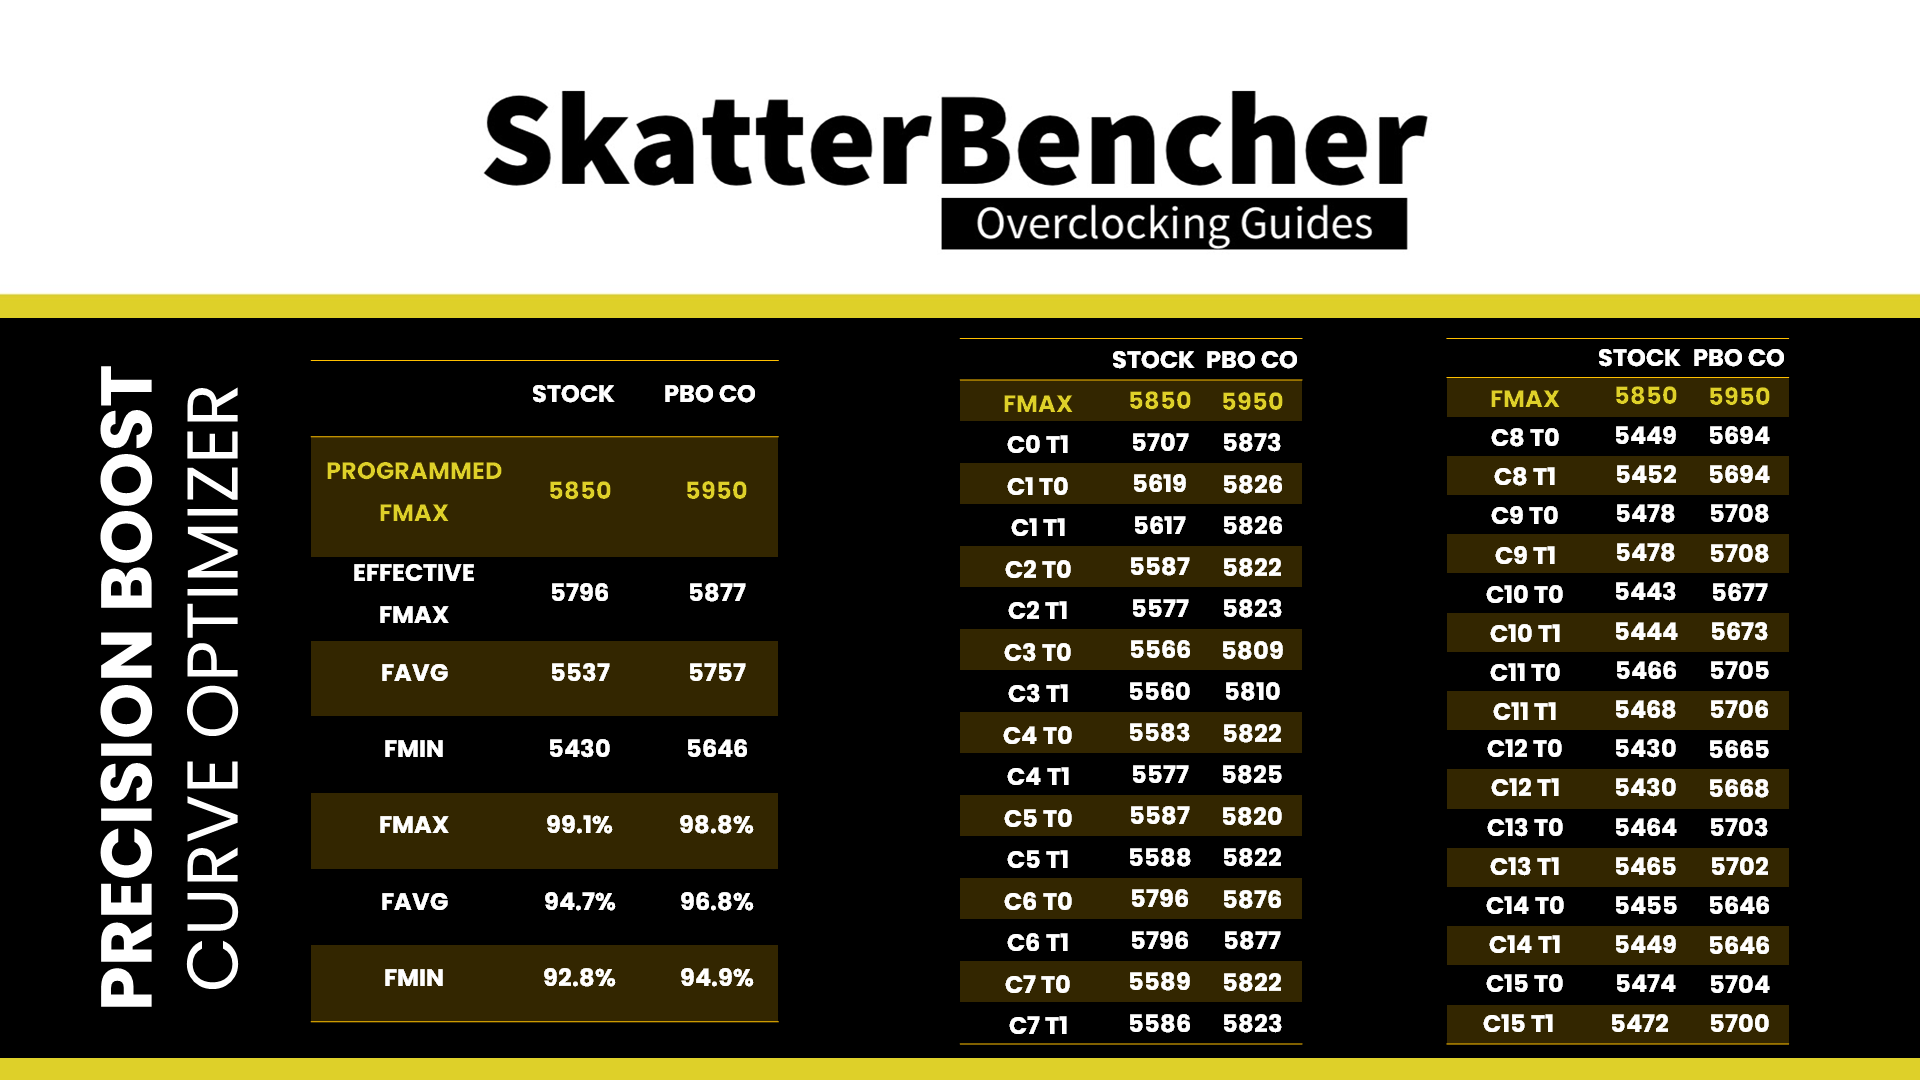
We can make a couple of interesting observations.
At stock, we see a story of two totally different CCDs. The cores in CCD0 boost a minimum of 100 MHz higher than the cores in CCD1. Furthermore, only cores 0 and 6 boost beyond the advertised boost limit of 5.7GHz, whereas the maximum boost frequency of the other cores ranges between 5430 and 5620 MHz.
Note that while AMD advertises a boost clock of 5.7 GHz, the actual programmed Fmax frequency ceiling is 5.85 GHz. So, on some CPUs, you may see the frequency boost beyond the advertised boost frequency. In our case, we see Core 6 boost to almost 5.8 GHz.
After Curve Optimizing, we can see a substantial frequency uplift across the board. While none of our cores are hitting the increased Fmax ceiling of 5.95, all cores in CCD0 boost beyond 5.8GHz. Also, all cores in CCD1 boost beyond 5.6GHz. On average, the maximum boost frequency increased from 5537 MHz to 5757 MHz.
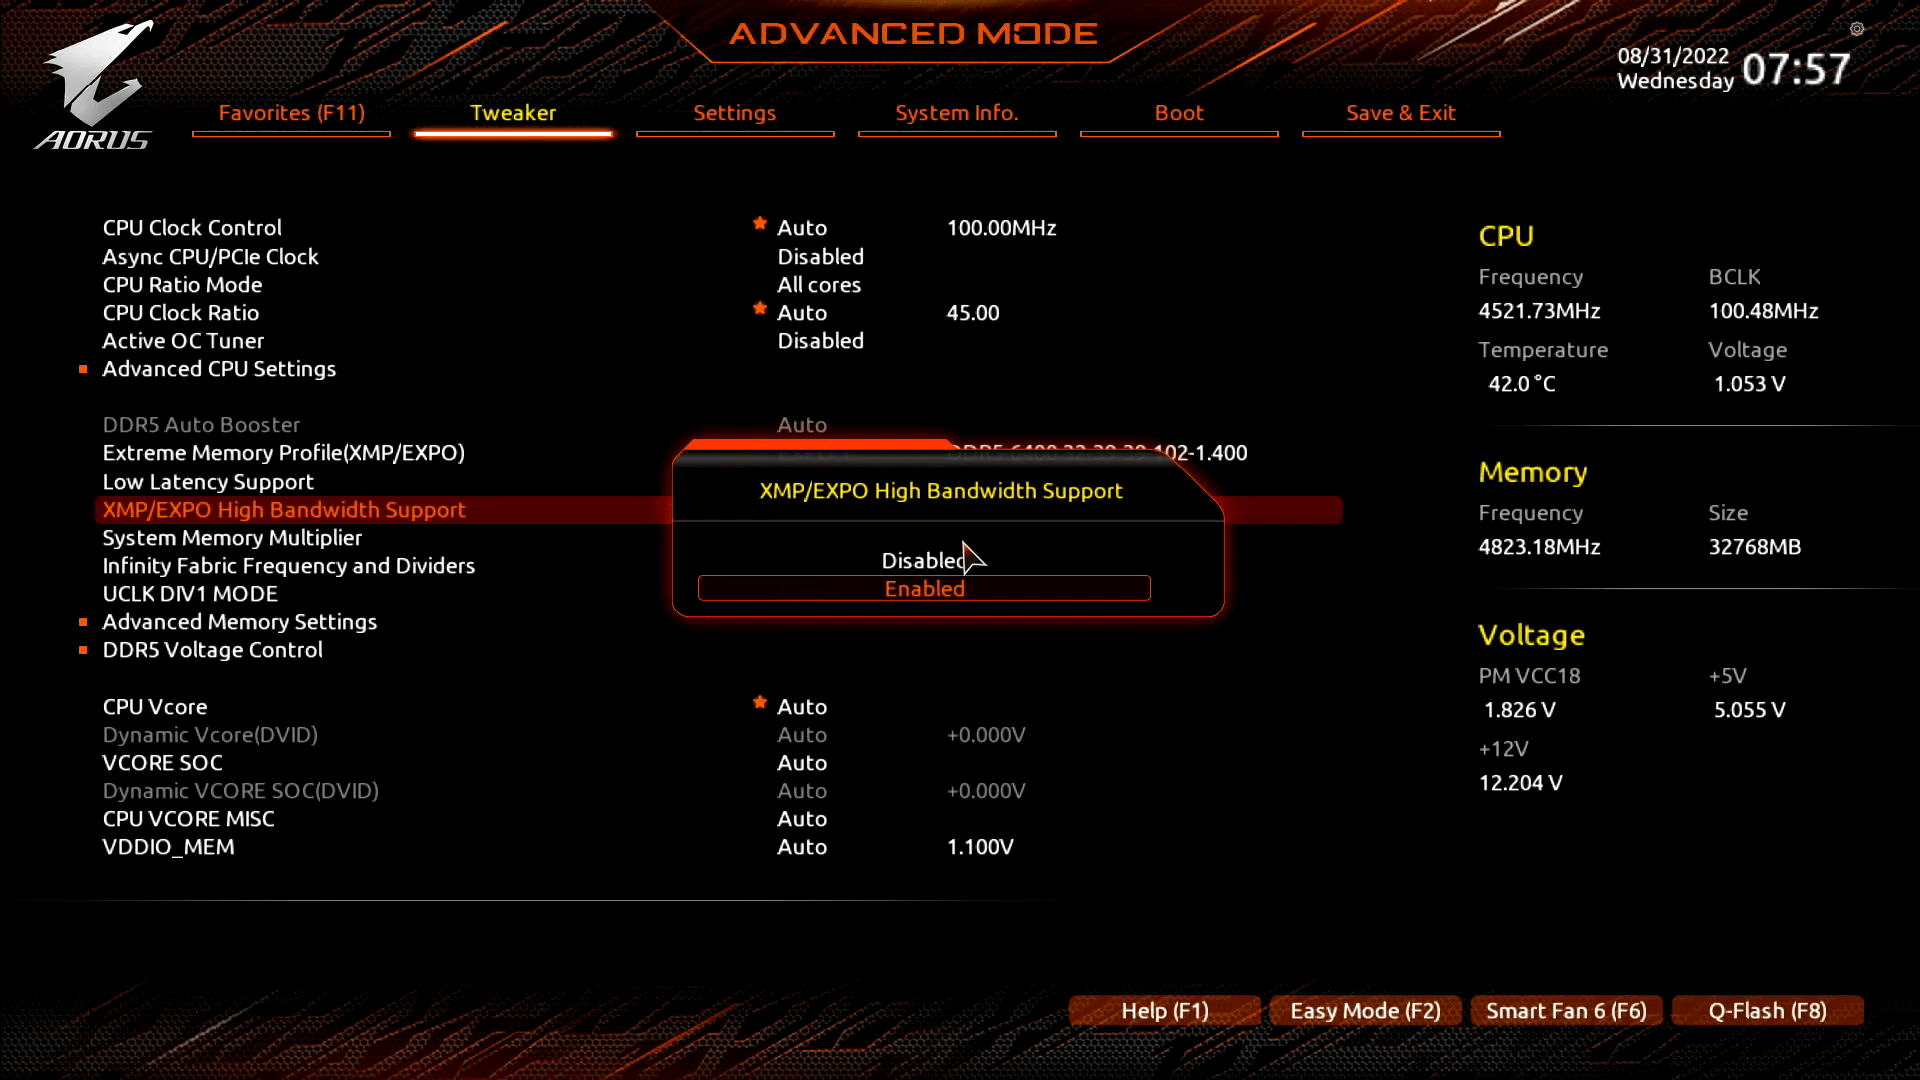
EXPO High Bandwidth Support
A quick word on two settings included in the GIGABYTE BIOS. The settings become visible when you enable EXPO. The settings are:
- Low Latency Support
- High Bandwidth Support
Unfortunately, I don’t know what the settings do, but they positively impact performance in memory-sensitive benchmarks. Enabling the settings may cause instability, but it’s up to you to see if your memory is stable when enabled.
In my case, I enable the High Bandwidth Support and see a positive performance impact in benchmarks like Geekbench 5 Multi and AI Benchmark.
BIOS Settings & Benchmark Results
Upon entering the BIOS
- Switch to Advanced Mode
- Enter the Advanced CPU Settings submenu
- Enter the Precision Boost Overdrive submenu
- Set Precision Boost Overdrive to Advanced
- Set PBO Limits to Motherboard
- Set CPU Boost Clock Override to Enabled (Positive)
- Set Max CPU Boost Clock Override(+) to 100
- Enter the Curve Optimizer submenu
- Set Curve Optimizer to All Cores
- Set All Core Curve Optimizer Sign to Negative
- Set All Core Curve Optimizer Magnitude to 25
- Leave the Curve Optimizer submenu
- Leave the Precision Boost Overdrive submenu
- Enter the Precision Boost Overdrive submenu
- Leave the Advanced CPU Settings submenu
- Set XMP/EXPO High Bandwidth Support to Enabled
- Set Extreme Memory Profile(XMP/EXPO) to EXPO 1
- Set System Memory Multiplier to 60.00
Then save and exit the BIOS.
We re-ran the benchmarks and checked the performance increase compared to the default operation.
- SuperPI 4M: +3.49%
- Geekbench 5 (single): +6.32%
- Geekbench 5 (multi): +13.19%
- Cinebench R23 Single: +6.35%
- Cinebench R23 Multi: +3.56%
- CPU-Z V17.01.64 Single: +3.71%
- CPU-Z V17.01.64 Multi: +2.35%
- V-Ray 5: +5.78%
- AI Benchmark: +11.90%
- 3DMark Night Raid: +3.47%
- CS:GO FPS Bench: +2.52%
- Tomb Raider: +0.49%
- Final Fantasy XV: +0.73%

Here are the 3DMark CPU Profile scores at stock
- CPU Profile 1 Thread: +4.95%
- CPU Profile 2 Threads: +5.28%
- CPU Profile 4 Threads: +3.69%
- CPU Profile 8 Threads: +3.30%
- CPU Profile 16 Threads: +5.51%
- CPU Profile Max Threads: +2.52%
The performance uplift after Curve Optimizing is not earth-shattering. However, it’s nice to see we have achieved better performance across the board, even in single-threaded benchmarks. We see the highest performance improvement of +13.19% in Geekbench 5.
When running Prime 95 Small FFTs with AVX-512 enabled, the average CPU effective clock is 4944 MHz with 1.170 volts. The average CPU temperature is 95.3 degrees Celsius. The ambient and water temperature is 27.3 and 39.0 degrees Celsius. The average CPU package power is 242.5 watts.

When running Prime 95 Small FFTs with AVX disabled, the average CPU effective clock is 5093 MHz with 1.227 volts. The average CPU temperature is 95.2 degrees Celsius. The ambient and water temperature is 25.8 and 37.6 degrees Celsius. The average CPU package power is 244.2 watts.
OC Strategy #3: PB Supercharged with ECLK
In our third overclocking strategy, we take advantage of the return of the ECLK mode. ECLK stands for external clock and is precisely what the term suggests: an external clock generator. It was previously available on Ryzen 2000 Pinnacle Ridge processors but was removed afterward.
Raphael Clocking Topology
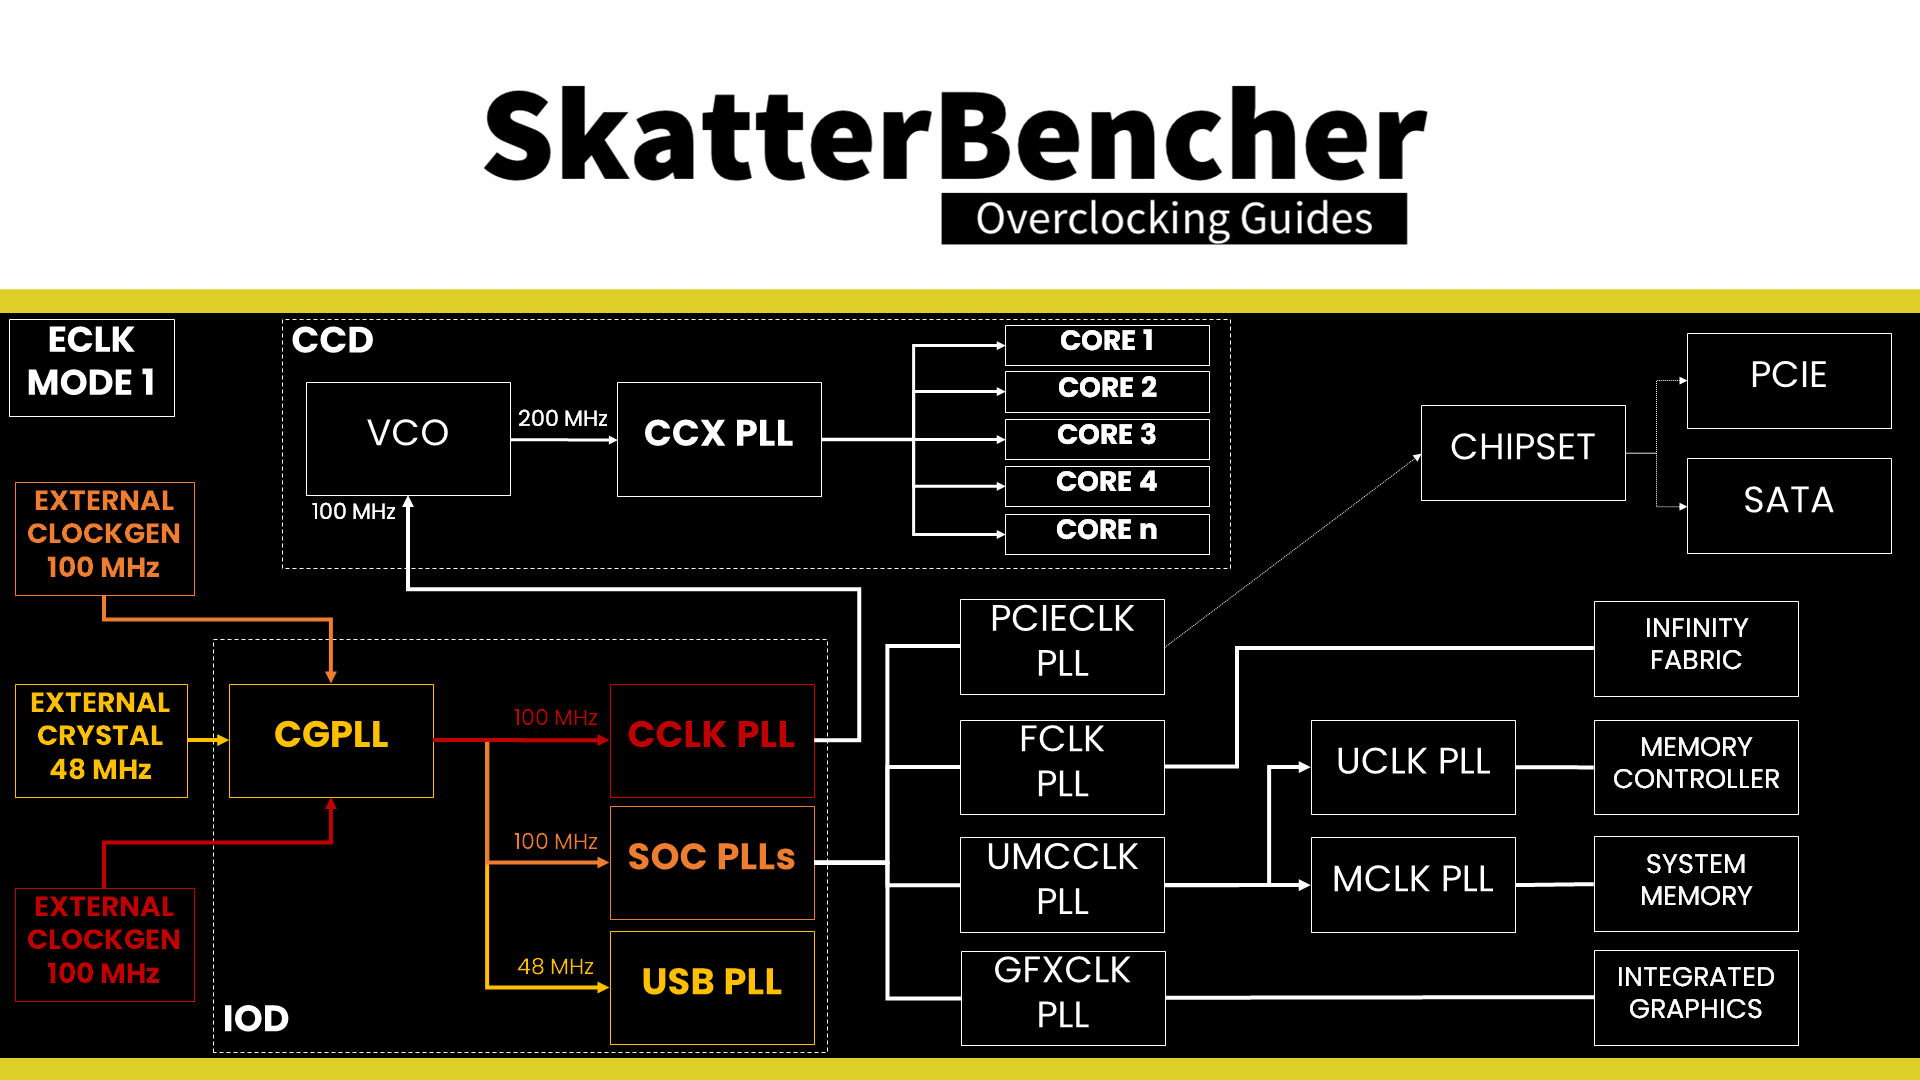
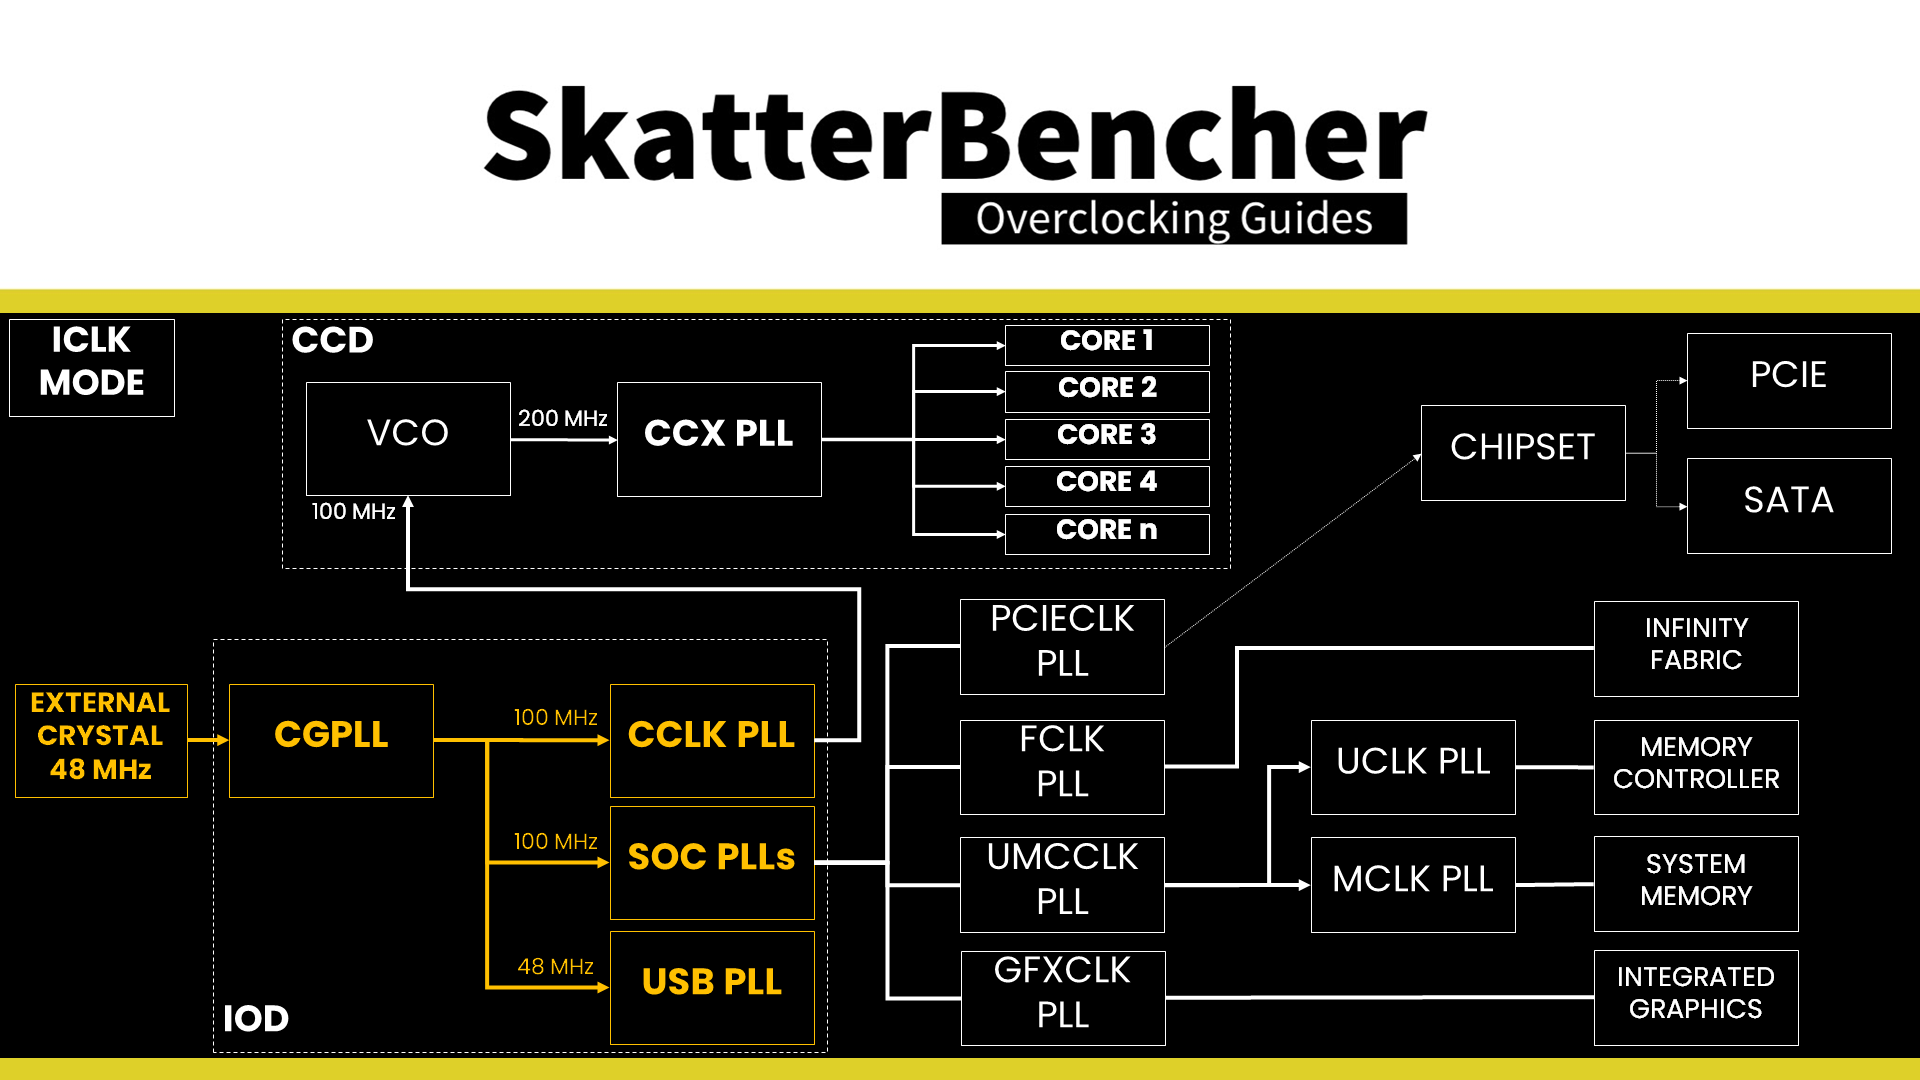
The standard Raphael platform has a 48 MHz crystal input to the integrated CGPLL clock generator. The CGPLL then generates a 48 MHz clock for the USB PLL and a 100 MHz reference clock for the FCH, which contains the CCLK PLL for the CPU cores and several SOC PLLs.

In addition to the standard internal CGPLL, Raphael supports up to two external clock modes. They’re called eCLK0 Mode and eCLK1 Mode.
In eCLK0 Mode, an external 100MHz reference clock is used for both the CPU and SOC PLLs. In other words, it’s a reference clock that affects the CPU core clocks and the PCIe and SATA clocks. The USB PLL is still driven by the 48 MHz crystal via the CGPLL.
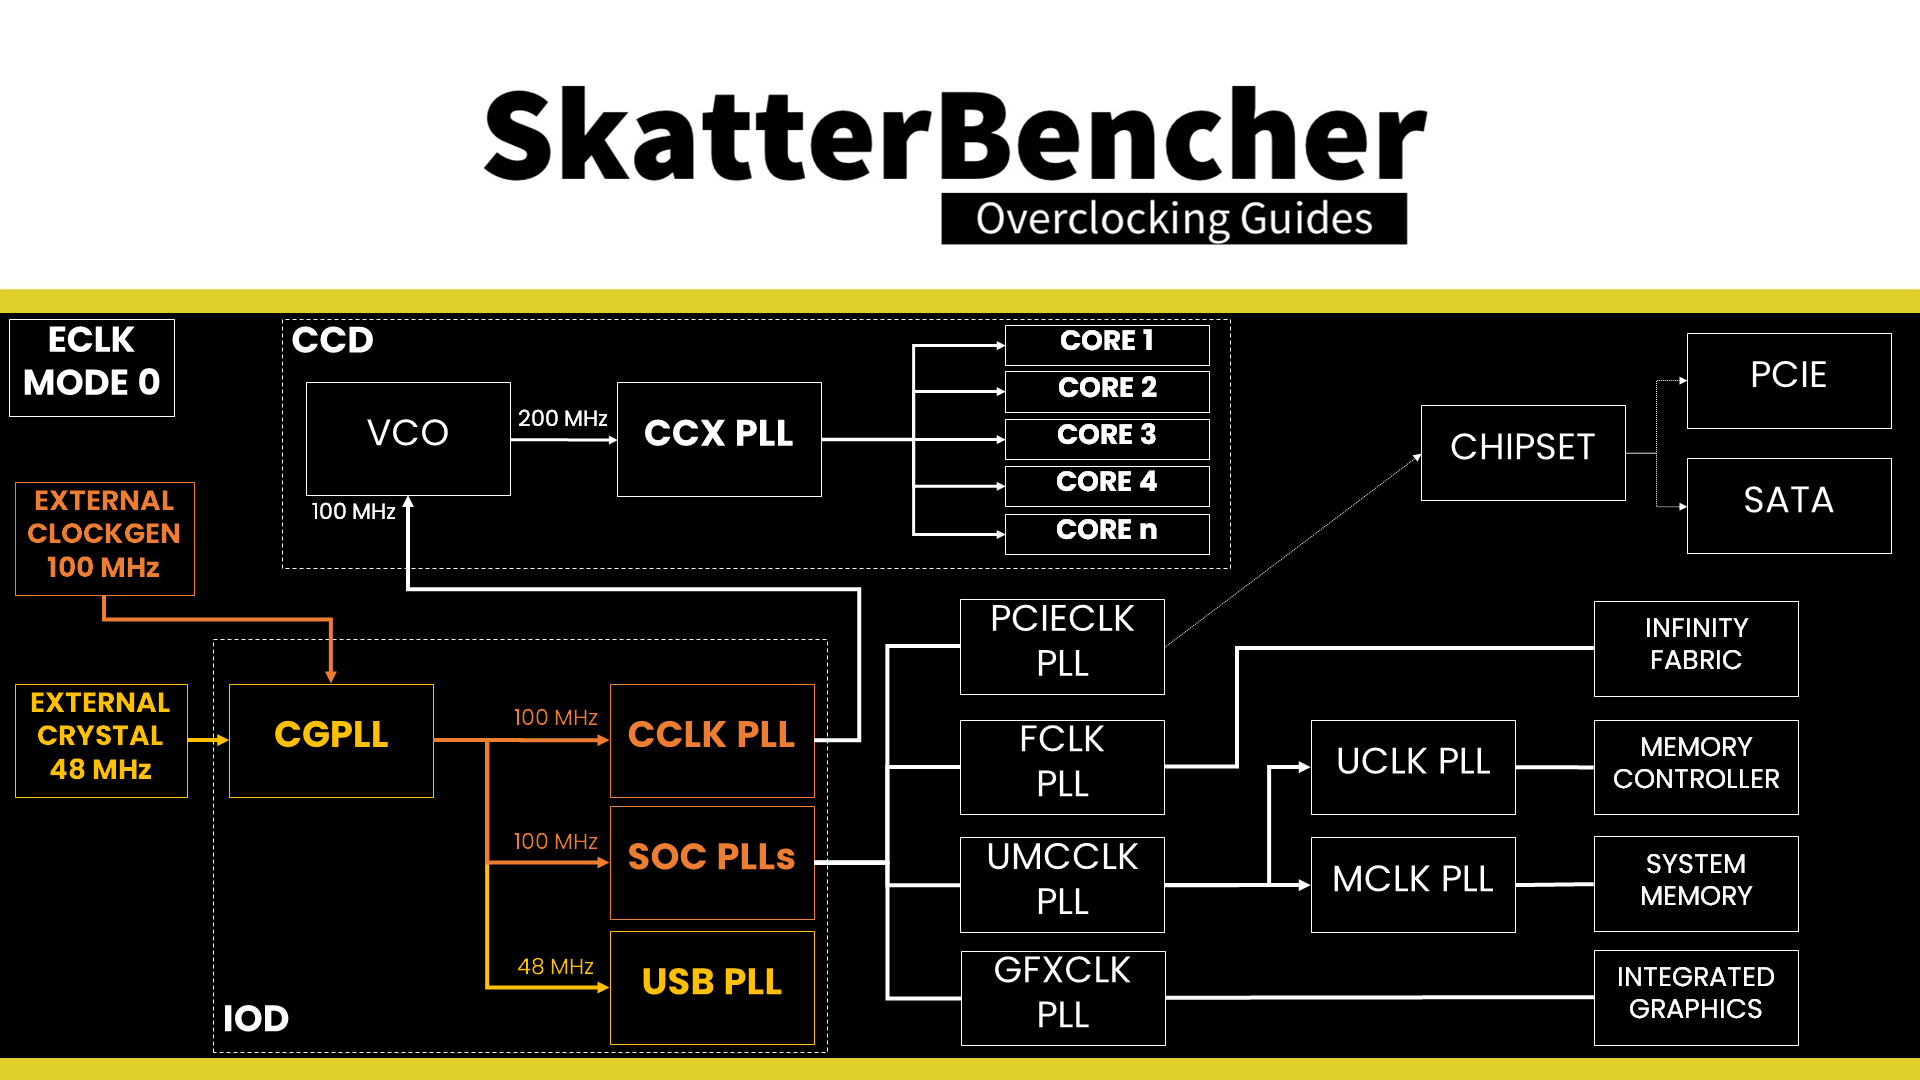
In eCLK1 Mode, there are two distinct external 100MHz reference clocks. One clock provides the 100MHz input for the CPU PLL, and another provides the 100MHz reference clock for the SOC PLLs. AMD suggests up to 140 MHz can be expected for the CPU core reference clock, but your mileage may vary. The USB PLL is still driven by the 48 MHz crystal via the CGPLL.
In previous SkatterBencher videos, I referred to the technique of overclocking the reference clock as “supercharging PBO.” Unlike previous Ryzen CPUs, overclocking the reference clock is very well supported and provides a viable path to overclocking.
The overclocking strategy with ECLK is the polar opposite of what we’re used to with Ryzen CPUs. Typically, as shown in OC Strategy #2, Ryzen overclocking consists of using curve optimizer to add a negative voltage offset to the CPU core VFT curve. By doing so, the CPU will boost to higher frequencies.
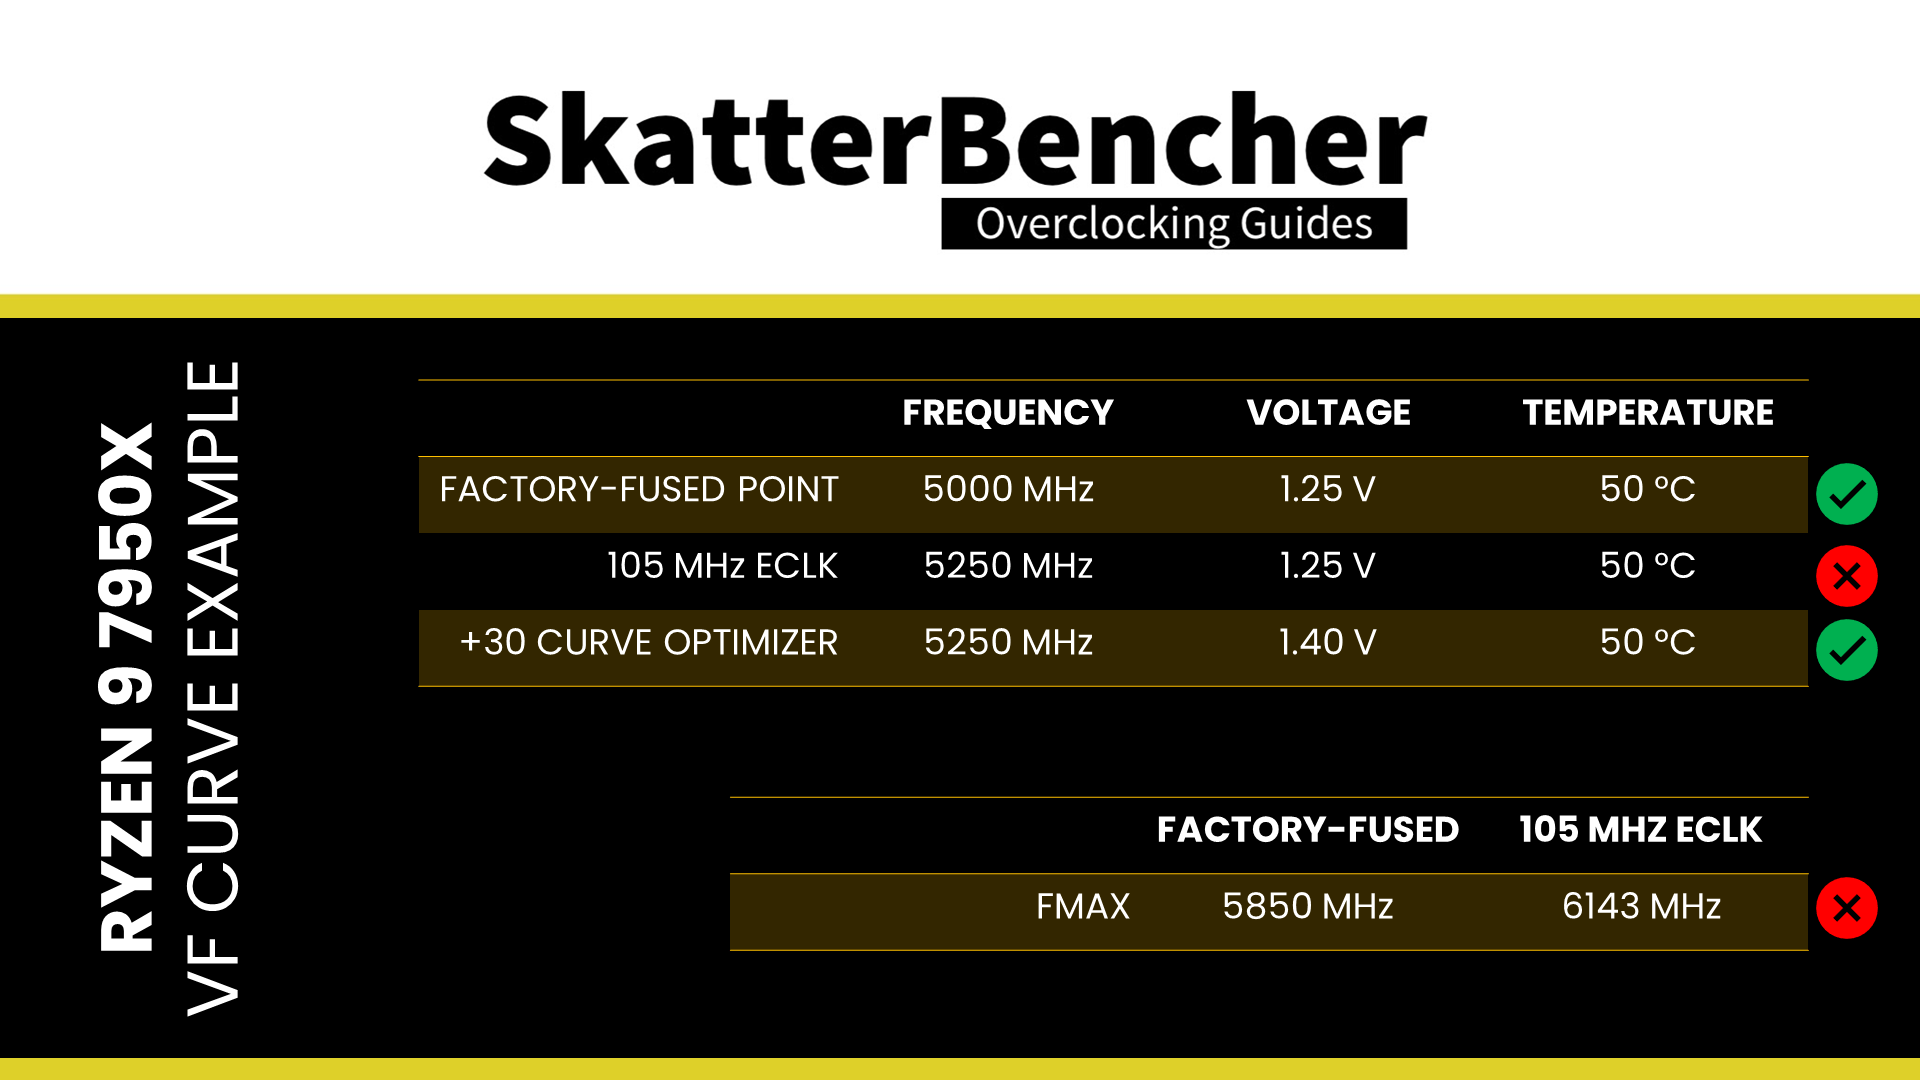
With ECLK, we still build on the factory-fused VFT curve but adjust the frequency by adjusting the reference clock. For example, if the Precision Boost has a VFT point for 5000 MHz at 1.25V at 50C, with an ECLK of 105 MHz, the actual point will be 5250 MHz at 1.25V at 50C.

Obviously, the default voltage for this VFT point won’t suffice for stable operation. So, counter-intuitively, we use a positive curve optimizer to increase the voltages of the VFT point. For example, a +30 curve optimizer may increase the voltage by 150mV. Thus, the resulting VFT point will be 5250 MHz at 1.40V at 50C.
Suppose Curve Optimizer doesn’t provide you with sufficient additional voltage. In that case, you can always add a voltage offset via the VRM controller configuration.
One more important point: ECLK also affects the maximum frequency ceiling. With an ECLK of 105 MHz, the new programmed Fmax for the 7950X is 5850 MHz x 1.05 = 6143 MHz. That’s way too high for this CPU. Luckily, we can use a negative Fmax boost override to fix this.
ECLK Tuning Process
The manual tuning process for eCLK tuning can become quite convoluted since it affects the CPU core stability in all scenarios ranging from very light single-threaded workloads to heavy all-core workloads.
My ECLK tuning process for this Ryzen 9 7950X was as follows.
First, I use a broad tuning approach to get a big-picture understanding of the tuning opportunity. Then, I narrow down the per-core curve optimizer settings to achieve stability in a light workload. Then, I verify the stability in all-core multi-threaded workloads. Lastly, I run through all my benchmarks to validate stability in a wide range of test scenarios.
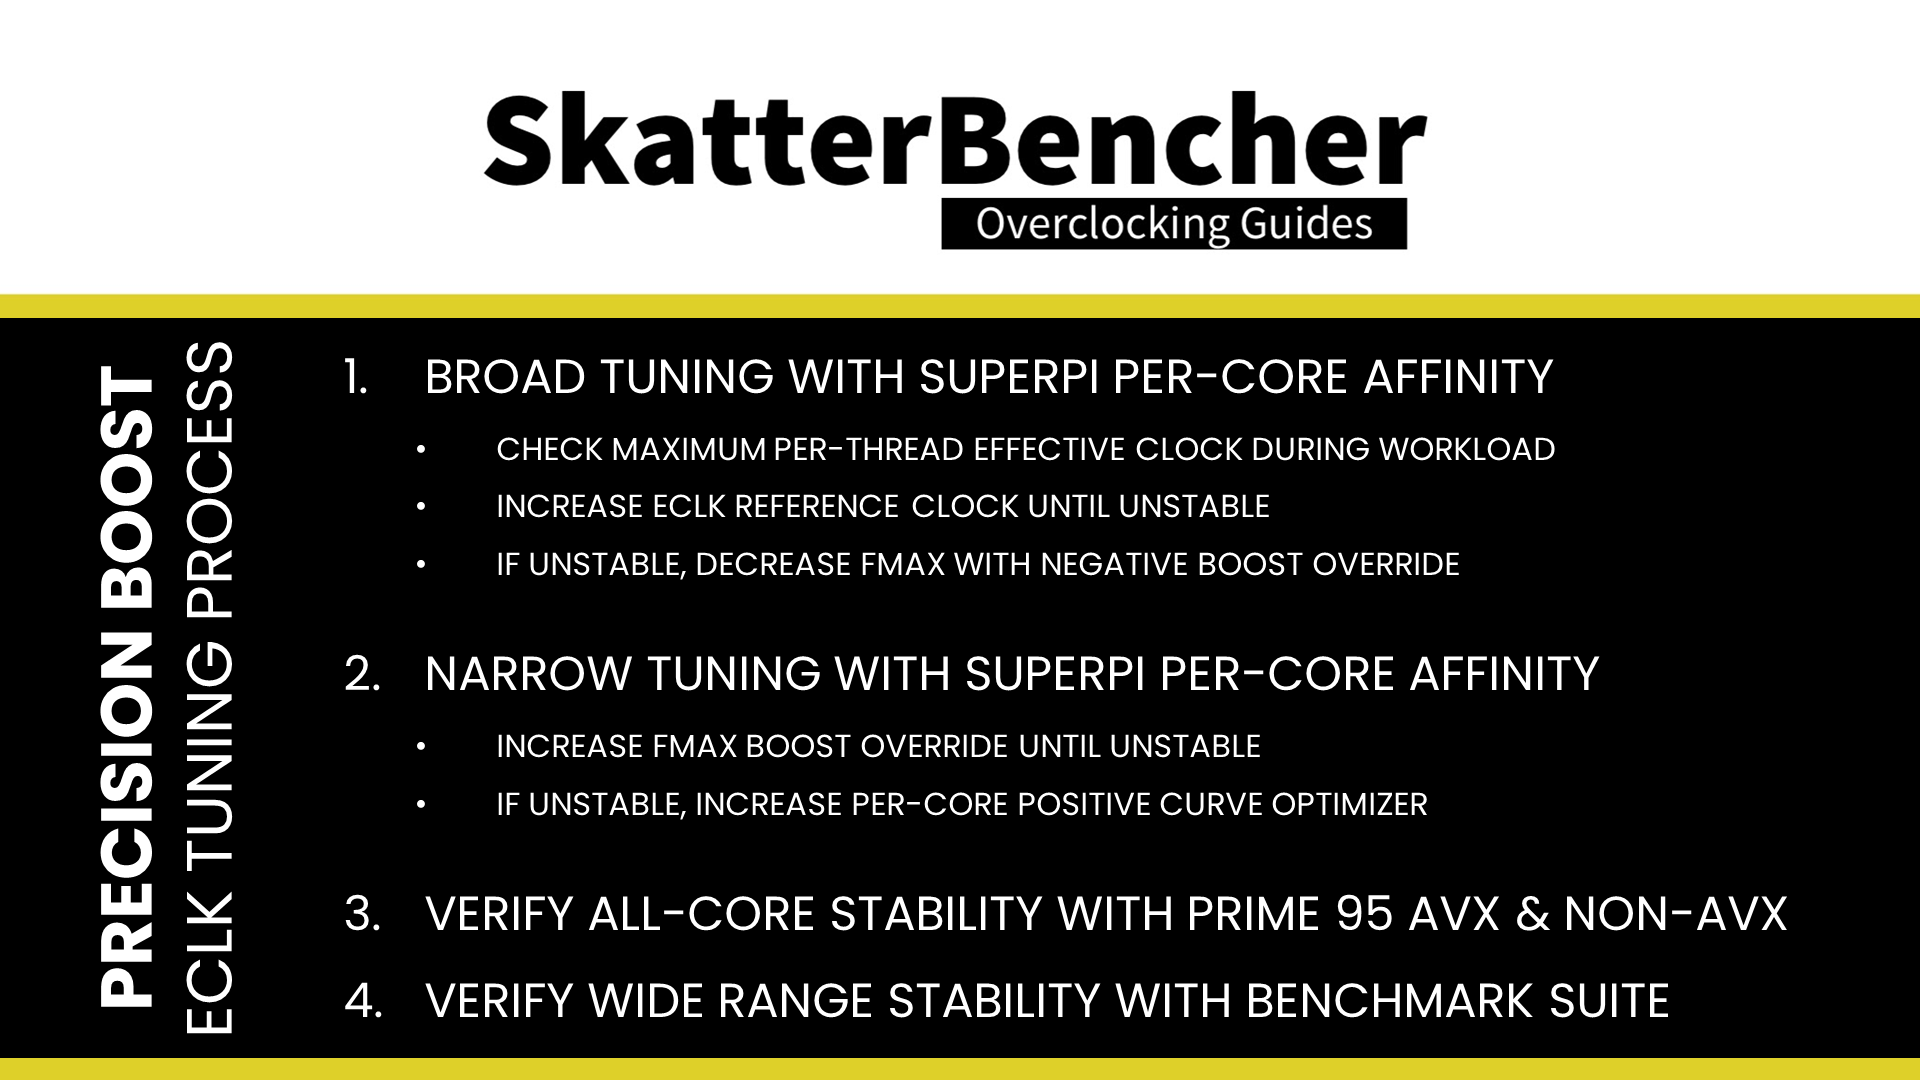
The broad tuning process includes:
- Using SuperPI 32M with affinity to a specific thread to check the maximum effective clock frequency
- Gradually increasing eclk reference clock until the point of instability
- If unstable, decrease Fmax with negative boost override
The narrow tuning process includes:
- Using SuperPI 32M with affinity to a specific thread to check the maximum effective clock frequency
- Gradually increasing Fmax Boost Override until the point of instability
- If unstable, increase per-core positive curve optimizer
The all-core stability process includes running Prime 95 Small FFTs with both AVX-512 enabled and disabled.
The benchmark validation process includes completing all the benchmarks I’ve included in this guide. If a benchmark is unstable, I increase every core’s per-core curve optimizer value by 2 until I reach stability.
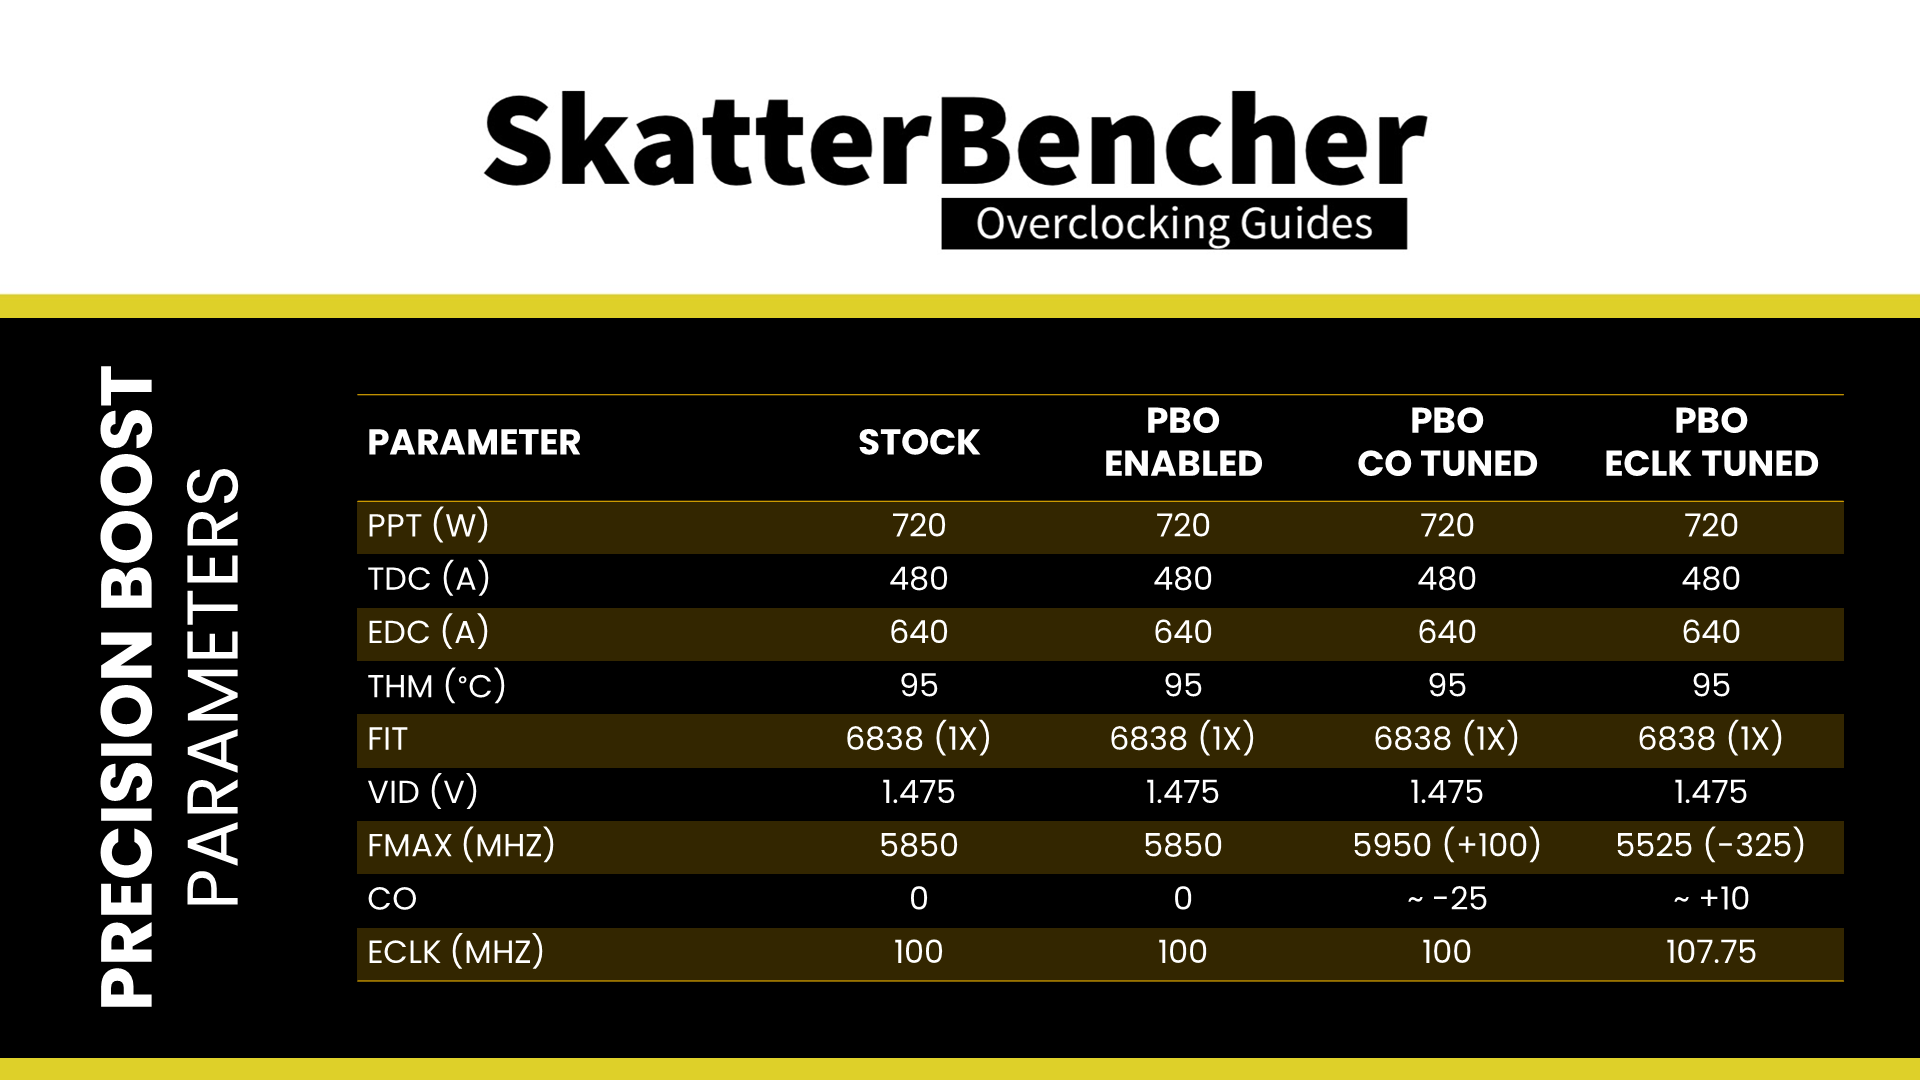
In my case, I used an ECLK of 107.75 MHz, a Fmax boost override of -325, and a per-core Curve Optimizer ranging from +10 on Cores 4, 6, 8, 9, 10, 11, 12, 13, and 15 to +20 on core 2. I will show you the BIOS configuration in a minute. First, please note that these settings, especially the curve optimizer, are CPU-specific, and the optimal values of your CPU may differ substantially.
The following table shows the boost profile for this specific CPU.
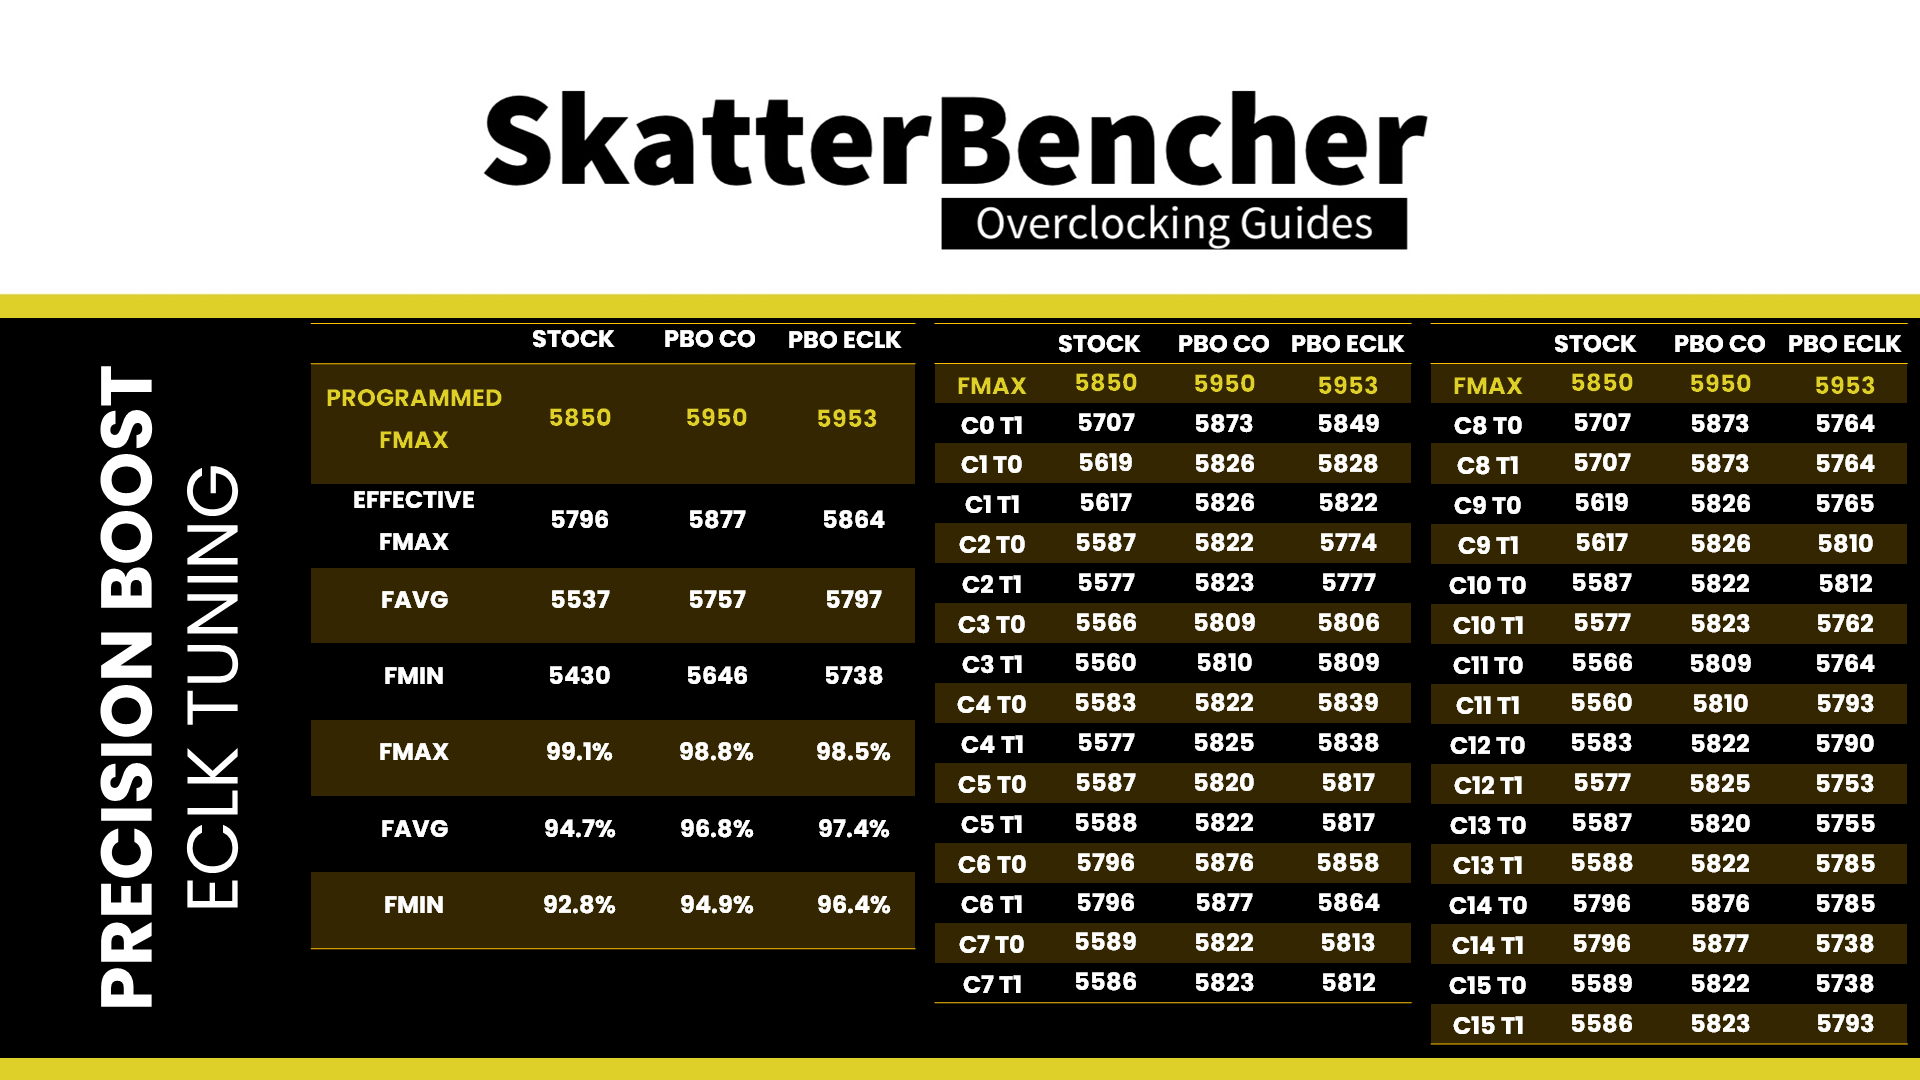
We can make a couple of interesting observations.
Tuning with eCLK provides slightly lower absolute maximum boost frequencies than when tuning with Curve Optimizer, as Core 6 boosts to only 5864 MHz. However, across all cores, the maximum boost frequency is about 40 MHz higher, and the lowest maximum boost frequency is almost 100 MHz higher.
Overall, the eCLK strategy typically provides an avenue to slightly higher frequencies at the cost of slightly higher voltages. While this offers better performance in light workloads, the higher voltages will push the CPU quicker to the thermal limit. Thus, in heavy workloads, strictly using the Curve Optimizer tool for undervolting yields slightly better results.
However, it’s important to remember that we cannot set a Fmax for individual cores. So, our Fmax limit applies to all cores. Suppose our overclock-specific Fmax, determined by the combination of eCLK and Fmax boost override, is too high for a any of the cores. In that case, it will result in instability regardless of the capability of the other cores.
BIOS Settings & Benchmark Results
Upon entering the BIOS
- Switch to Advanced Mode
- Enter the Advanced CPU Settings submenu
- Enter the Precision Boost Overdrive submenu
- Set Precision Boost Overdrive to Advanced
- Set PBO Limits to Motherboard
- Set CPU Boost Clock Override to Enabled (Negative)
- Set Max CPU Boost Clock Override(-) to 325
- Enter the Curve Optimizer submenu
- Set Curve Optimizer to Per Core
- For every core, set Curve Optimizer Sign to Positive
- For Cores 0, 1, 3, 5, 7, and 14, set Curve Optimizer Magnitude to 15
- For Core 2, set Curve Optimizer Magnitude to 20
- For Cores 4, 6, 8, 9, 10, 11, 12, 13, and 15, set Curve Optimizer Magnitude to 10
- Leave the Curve Optimizer submenu
- Leave the Precision Boost Overdrive submenu
- Enter the Precision Boost Overdrive submenu
- Leave the Advanced CPU Settings submenu
- Set XMP/EXPO High Bandwidth Support to Enabled
- Set Extreme Memory Profile(XMP/EXPO) to EXPO 1
- Set System Memory Multiplier to 60.00
Then save and exit the BIOS.
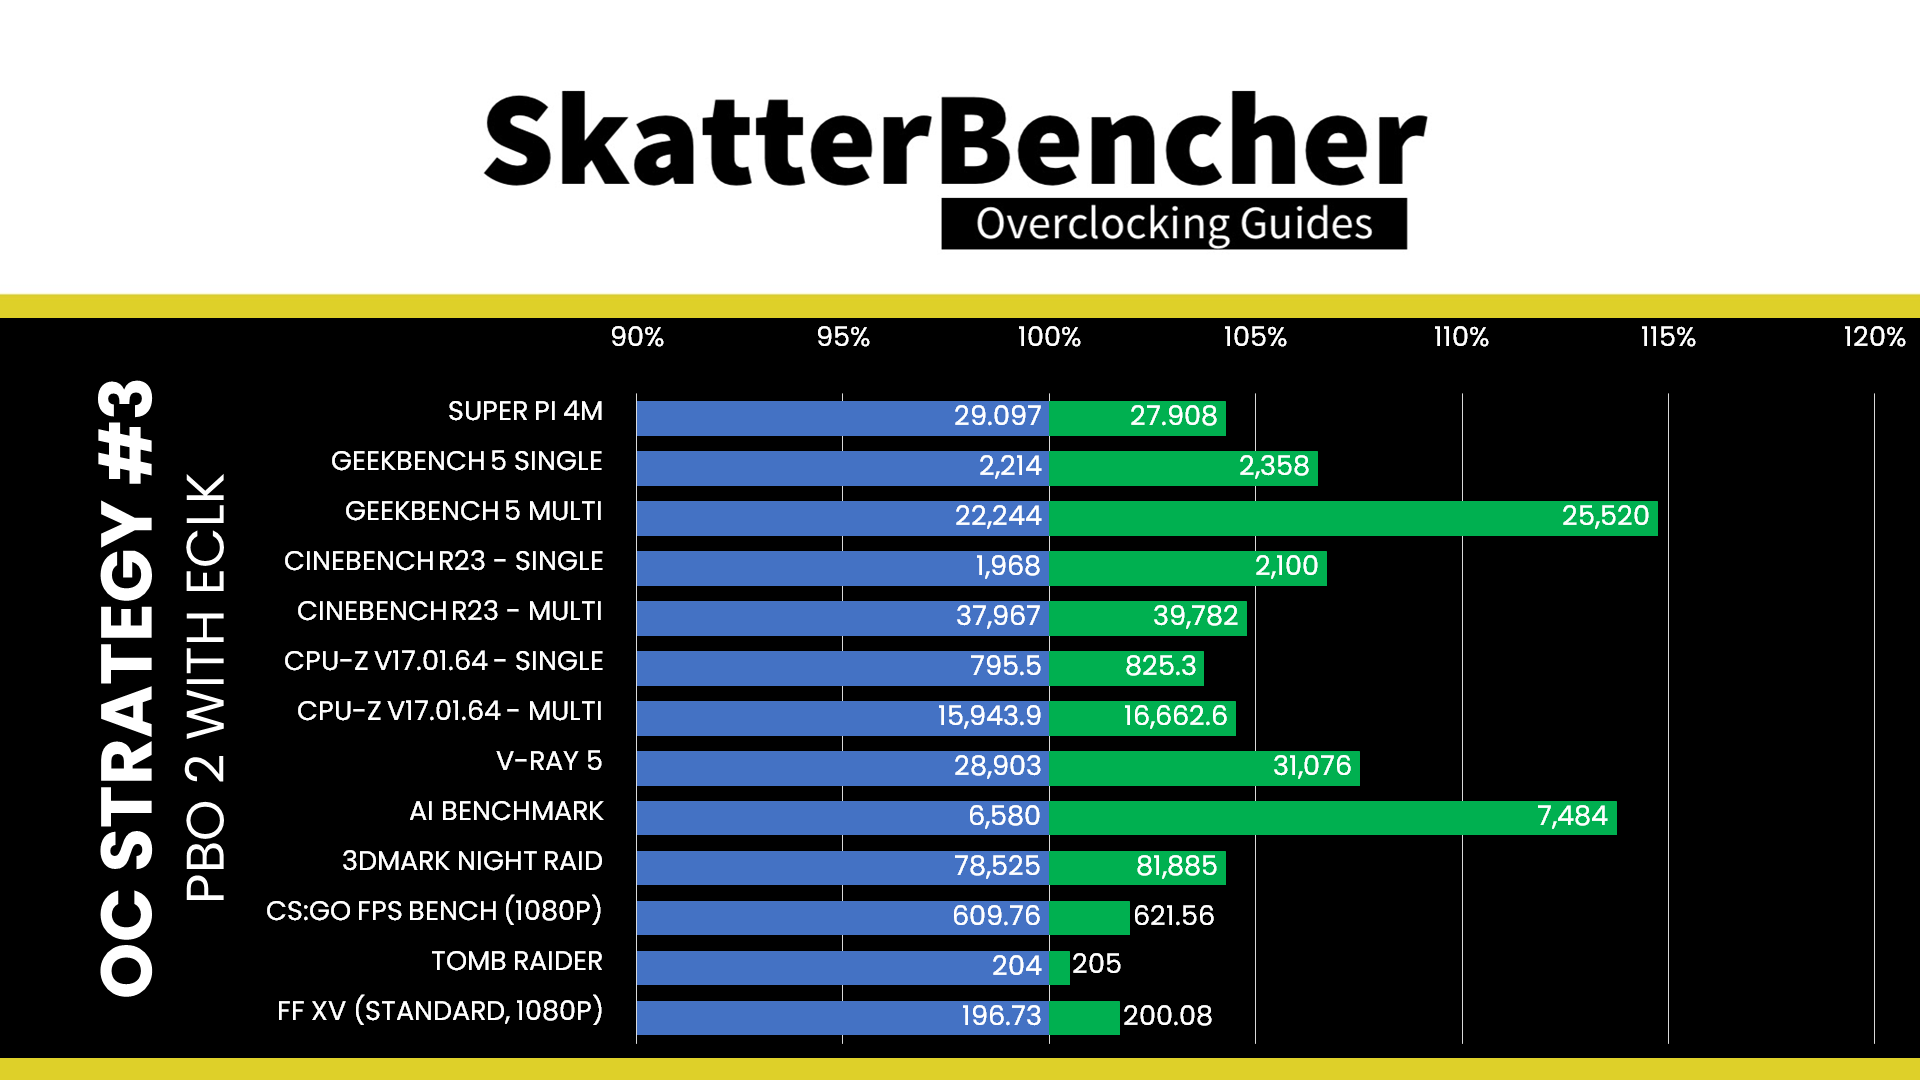
We re-ran the benchmarks and checked the performance increase compared to the default operation.
- SuperPI 4M: +4.26%
- Geekbench 5 (single): +6.50%
- Geekbench 5 (multi): +14.73%
- Cinebench R23 Single: +6.71%
- Cinebench R23 Multi: +4.78%
- CPU-Z V17.01.64 Single: +3.75%
- CPU-Z V17.01.64 Multi: +4.51%
- V-Ray 5: +7.52%
- AI Benchmark: +13.74%
- 3DMark Night Raid: +4.28%
- CS:GO FPS Bench: +1.94%
- Tomb Raider: +0.49%
- Final Fantasy XV: +1.70%
Here are the 3DMark CPU Profile scores at stock
- CPU Profile 1 Thread: +5.22%
- CPU Profile 2 Threads: +5.55%
- CPU Profile 4 Threads: +5.51%
- CPU Profile 8 Threads: +5.71%
- CPU Profile 16 Threads: +6.36%
- CPU Profile Max Threads: +5.29%
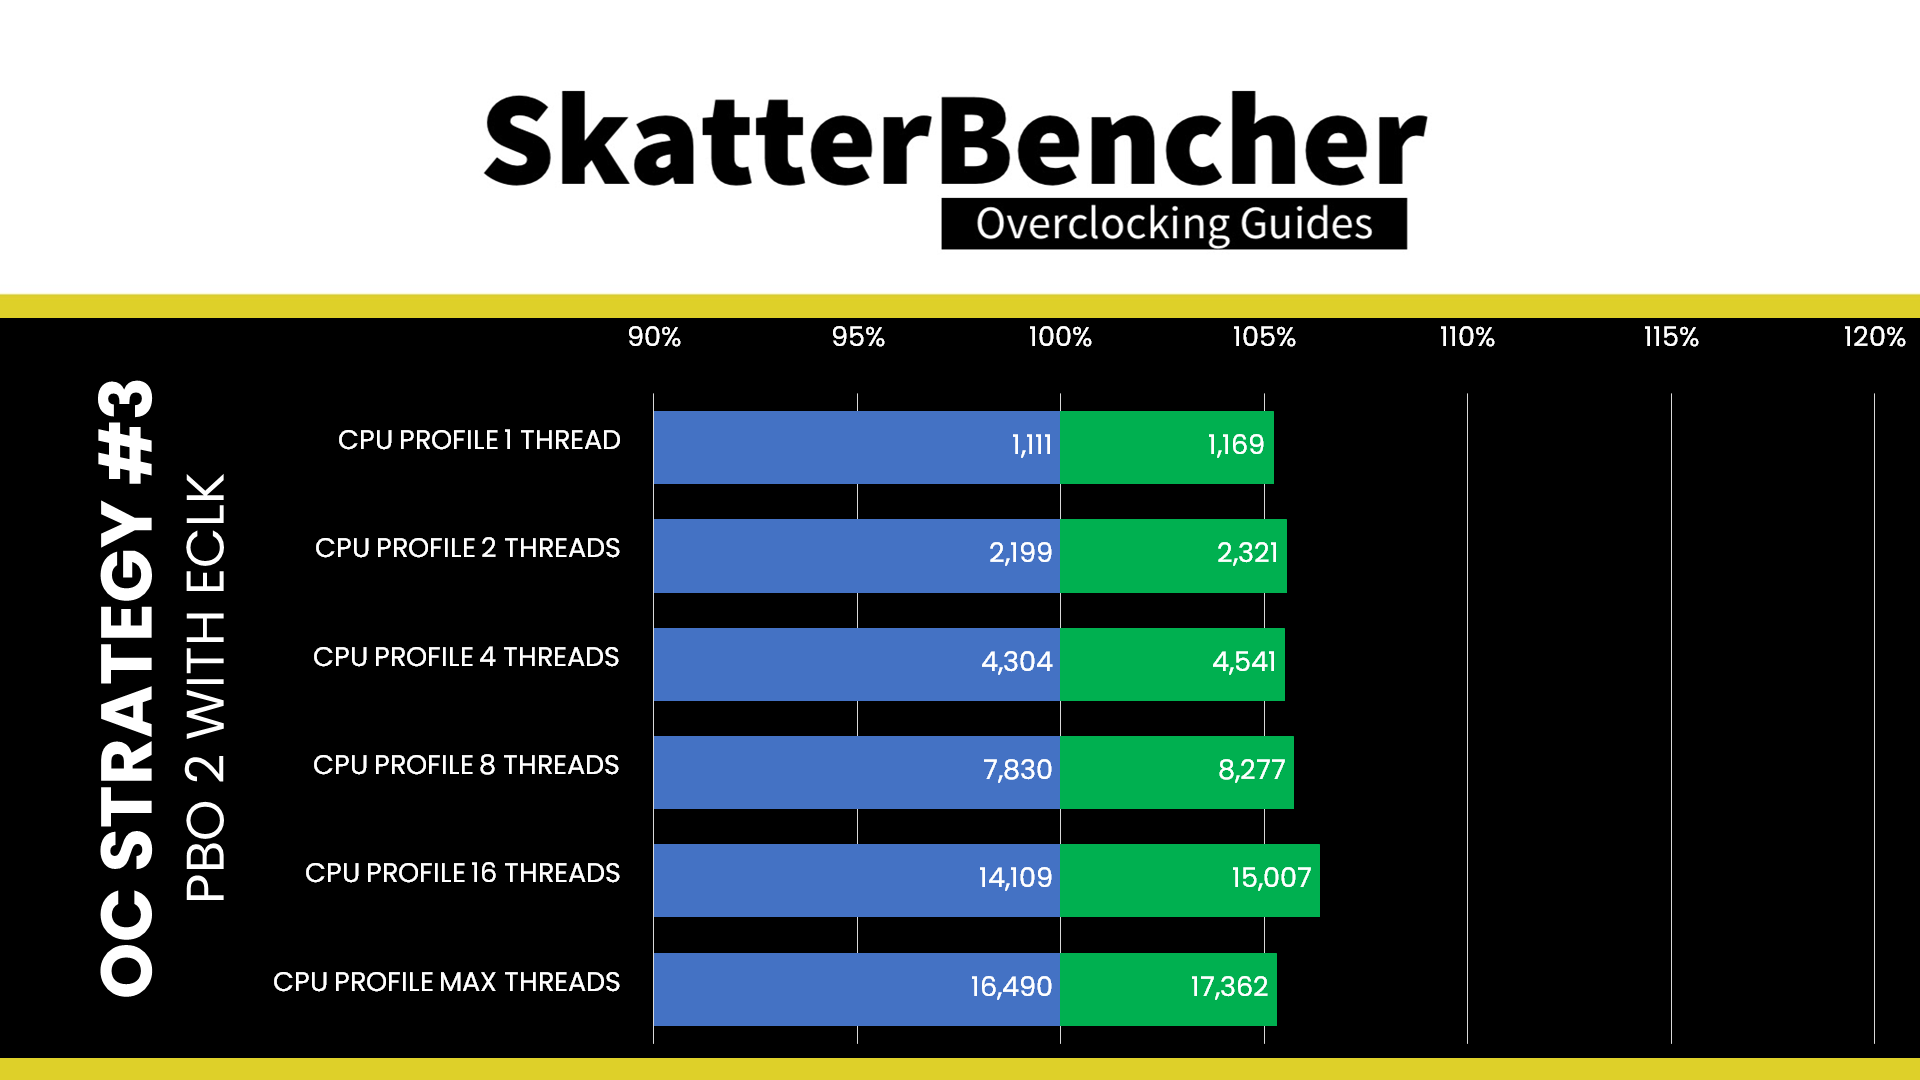
As the maximum boost frequencies have substantially increased from the stock values, we can see a performance uplift across the board. Even in single-threaded benchmarks, we see a nice performance improvement. The highest performance increase is +14.73% in Geekbench 5.
When running Prime 95 Small FFTs with AVX-512 enabled, the average CPU effective clock is 4843 MHz with 1.177 volts. The average CPU temperature is 95.3 degrees Celsius. The ambient and water temperature is 26.9 and 38.3 degrees Celsius. The average CPU package power is 242.6 watts.
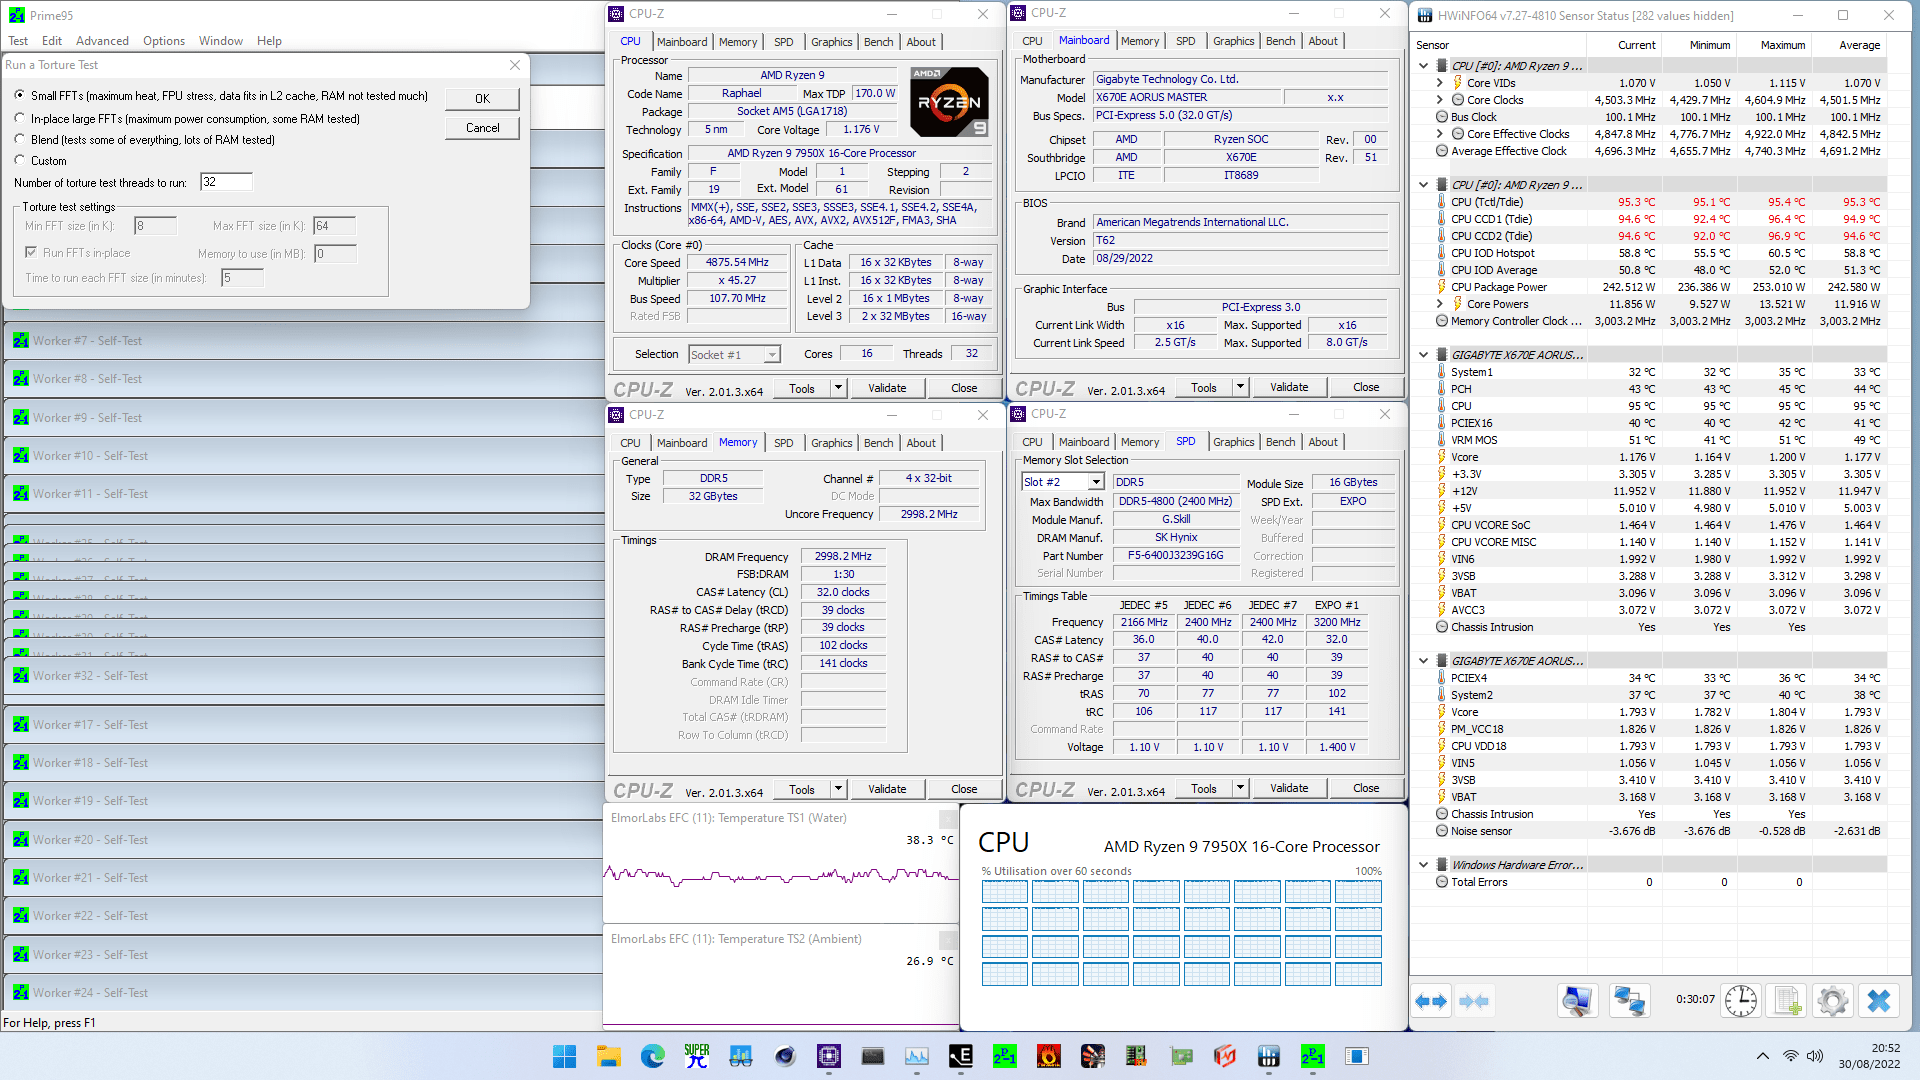
When running Prime 95 Small FFTs with AVX disabled, the average CPU effective clock is 5068 MHz with 1.228 volts. The average CPU temperature is 95.2 degrees Celsius. The ambient and water temperature is 26.2 and 37.4 degrees Celsius. The average CPU package power is 243.4 watts.

OC Strategy #4: Manual Overclock
In our fourth overclocking strategy, we will pursue a manual overclock.
One could question the use-case for manual overclocking an AMD Ryzen CPU. Just like with all past Ryzen processors, the major downside of manual overclocking is that you lose the benefits of Precision Boost technology in low-threaded benchmark applications. So, whereas this 7950X can boost up to 5850 MHz with Precision Boost, it will be limited to your set fixed frequency when manually overclocking.
However, manual overclocking is not all negative and even has some benefits.
First, automatic overclocking and frequency boosting technologies leave a little margin on the table. We can exploit this margin and fine-tune it for application stability when manually overclocking with our specific hardware configuration.
Second, in multi-threaded applications, Precision Boost Overdrive applies a single frequency to every core. However, on AMD Ryzen CPUs, you can set the frequency for each CCX separately. So, we can exploit the fact that some CCXs may overclock better than others.
Thirdly, by setting a fixed voltage, we avoid the CPU dynamically and rapidly updating its VID requests to the VRM controller. This alleviates stress on the VRM and typically yields lower temperatures.

To better understand the performance tuning opportunities embedded in the Ryzen 9 7950X processor, let’s look at its topology in more detail.
CPU Core Clocking Topology
The clocking of AMD Raphael is similar to the previous generation of Zen 3 Vermeer desktop CPUs.
The standard Raphael platform has a 48 MHz crystal input to the integrated CGPLL clock generator. The CGPLL then generates a 48 MHz clock for the USB PLL and a 100 MHz reference clock for the FCH, which contains the CCLK PLL for the CPU cores and several SOC PLLs.
The CCLK PLL 100MHz reference clock drives the 200 MHz VCO, which is then multiplied by an FID and divided by a DID. As a whole, this provides CPU clock frequency granularity of 25 MHz.
As with Vermeer, each CCX has its own PLL, with the cores within that CCX running at the same frequency. In a typical operation, all cores within a CCX will run at the same frequency. The effective clock will differ if the core is in a different P-state.
The SOC PLLs include a wide range of PLLs present on the IO die. The ones most relevant for overclocking are:
- FCLK for the data fabric
- UCLK for the memory controller
- MCLK for the system memory
- GFXCLK for the integrated graphics
The SOC PLLs are not particularly relevant for manual CPU Core overclocking.
As I mentioned in OC Strategy #3, in addition to the standard internal CGPLL, Raphael supports up to two external clock modes. We won’t be using Eclk in this overclocking strategy.
CPU Core Voltage Topology
From the voltage topology perspective, there are a few minor changes. Like Vermeer, the processor still relies on an internal and external power supply to generate the processor voltages.
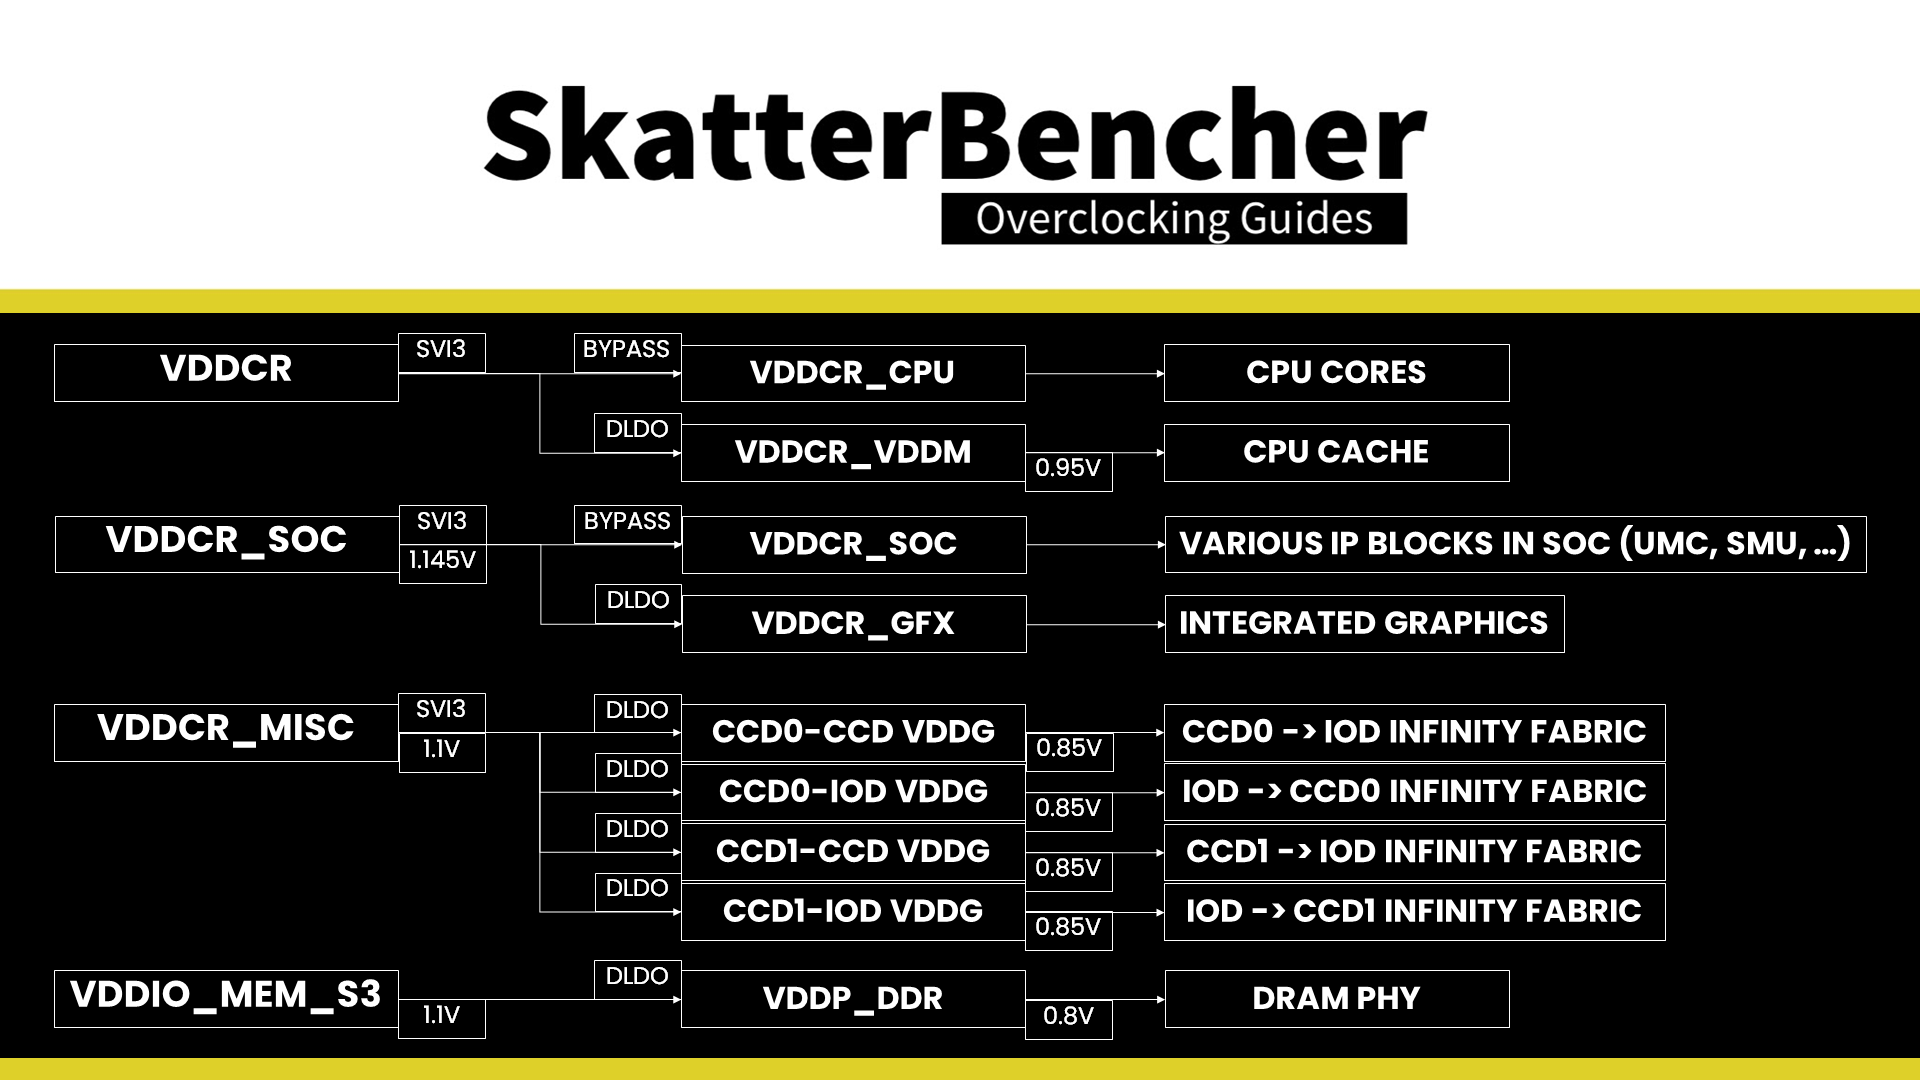
There are four primary power supplies from the motherboard VRM to the processor: VDDCR, VDDCR_SOC, VDDCR_MISC, and VDDIO_MEM_S3. I have covered the details extensively in my Raphael overclocking launch video.
The VDDCR voltage rail provides the external power for two internal voltage regulators: VDDCR_CPU and VDDCR_VDDM.
VDDCR_CPU provides the voltage for the CPU cores in CCX. On CPUs with multiple CCXs, each CCX has its own VDDCR_CPU voltage rail, but the voltage will be identical. The voltage rails can work in either regular or bypass mode, but on Raphael, it is always in bypass mode. That means the voltage is always equal to the VDDCR external voltage.
VDDCR_VDDM provides the voltage for the L2, L3, and, if present, 3D V-Cache on a CCX. On CPUs where there are multiple CCXs, each CCX has its own VDDCR_VDDM voltage rail. This rail cannot work in bypass mode; therefore, it is internally regulated from the VDDCR external voltage rail. The default VDDM voltage is 0.95V
The VDDCR voltage rail can be directly controlled via the SVI3 interface. VDDCR_VDDM cannot be controlled by the end-user.
Choosing the proper manual voltage is always a matter of finding a suitable trade-off between increased overclocking potential, the thermal challenges that come with increased voltage, and of course, consideration of CPU lifespan.
CCX Frequency Tuning Process
With that last thought, we kick off our manual overclocking process.
Our limiting factor will ultimately be the cooling solution as power consumption increases exponentially with operating voltage and temperature scales (somewhat) linearly with power consumption.
The maximum voltage will be determined by the application we’re tuning for. So, the first step in our tuning process would be deciding on the stress test representing our worst-case scenario. In this case, I pick the 30 min Cinebench R23 stress test.
The next step is to set a fixed CPU ratio and check the maximum temperature when running our workload. If there’s thermal headroom left, increase the operating voltage.
Once we know the maximum voltage, we can tune the CCX ratio. Simply increase the CPU ratio until the application shows instability, then back off. This approach will give you the maximum stable per-CCX frequency for a given voltage.

In our case, we end up with a CPU ratio of 54.25X for CCD0, 53.75X for CCD1, and a Core VID of 1.25V. During our stress test, this yields a CPU voltage of 1.285 and a CPU temperature of 97.0 degrees Celsius.
BIOS Settings & Benchmark Results
Upon entering the BIOS
- Switch to Advanced Mode
- Set CPU Ratio Mode to Per CCX
- Set CCD0 CCX0 Ratio to 54.25
- Set CCD1 CCX0 Ratio to 53.25
- Set Extreme Memory Profile(XMP/EXPO) to EXPO 1
- Set XMP/EXPO High Bandwidth Support to Enabled
- Set System Memory Multiplier to 60.00
- Set CPU Vcore to 1.25
Then save and exit the BIOS.
We re-ran the benchmarks and checked the performance increase compared to the default operation.
- SuperPI 4M: -2.87%
- Geekbench 5 (single): +0.05%
- Geekbench 5 (multi): +13.28%
- Cinebench R23 Single: -0.46%
- Cinebench R23 Multi: +7.04%
- CPU-Z V17.01.64 Single: -3.28%
- CPU-Z V17.01.64 Multi: +3.10%
- V-Ray 5: +9.60%
- AI Benchmark: +13.09%
- 3DMark Night Raid: +2.53%
- CS:GO FPS Bench: -0.20%
- Tomb Raider: +0.00%
- Final Fantasy XV: +0.54%

Here are the 3DMark CPU Profile scores at stock
- CPU Profile 1 Thread: -1.35%
- CPU Profile 2 Threads: -0.41%
- CPU Profile 4 Threads: +0.23%
- CPU Profile 8 Threads: +2.48%
- CPU Profile 16 Threads: +3.24%
- CPU Profile Max Threads: +3.47%

As expected, we see a performance deficit against stock performance in single-threaded applications as manual overclocking doesn’t benefit from the Precision Boost 1T frequency. In multi-threaded applications, however, we see a nice performance uplift up to +13.28% in Geekbench.
When running Prime 95, unfortunately, the CPU is not stable. This is a deliberate choice on our side as we decided to forego stability in extreme scenarios in favor of Cinebench R23 as a stability requirement.
OC Strategy #5: Active OC Tuner
In our final overclocking strategy, we will rely on Active OC Tuner to bring together the best of PBO and manual overclocking.
GIGABYTE Active OC Tuner
Active OC Tuner, or AOCT for short, is GIGABYTE’s way to address a core challenge when overclocking AMD Ryzen processors. It was first introduced with the GIGABYTE X570S Aorus Master motherboard (SkatterBencher #27) and has since been included in several other GIGABYTE motherboards.
As we know from the Raphael CPU Overclocking overview, there are two approaches to AMD Ryzen CPU core overclocking: Precision Boost Overdrive and OC mode.
- Precision Boost Overdrive has the benefit of retaining all the automatic boost algorithms, including the peak single thread frequency and associated performance.
- OC Mode has the benefit of enabling precise per-CCX fine-tuning of the maximum stable all-core frequency.
So, you typically have to choose to compromise either the best single-threaded performance or the best multi-threaded performance.

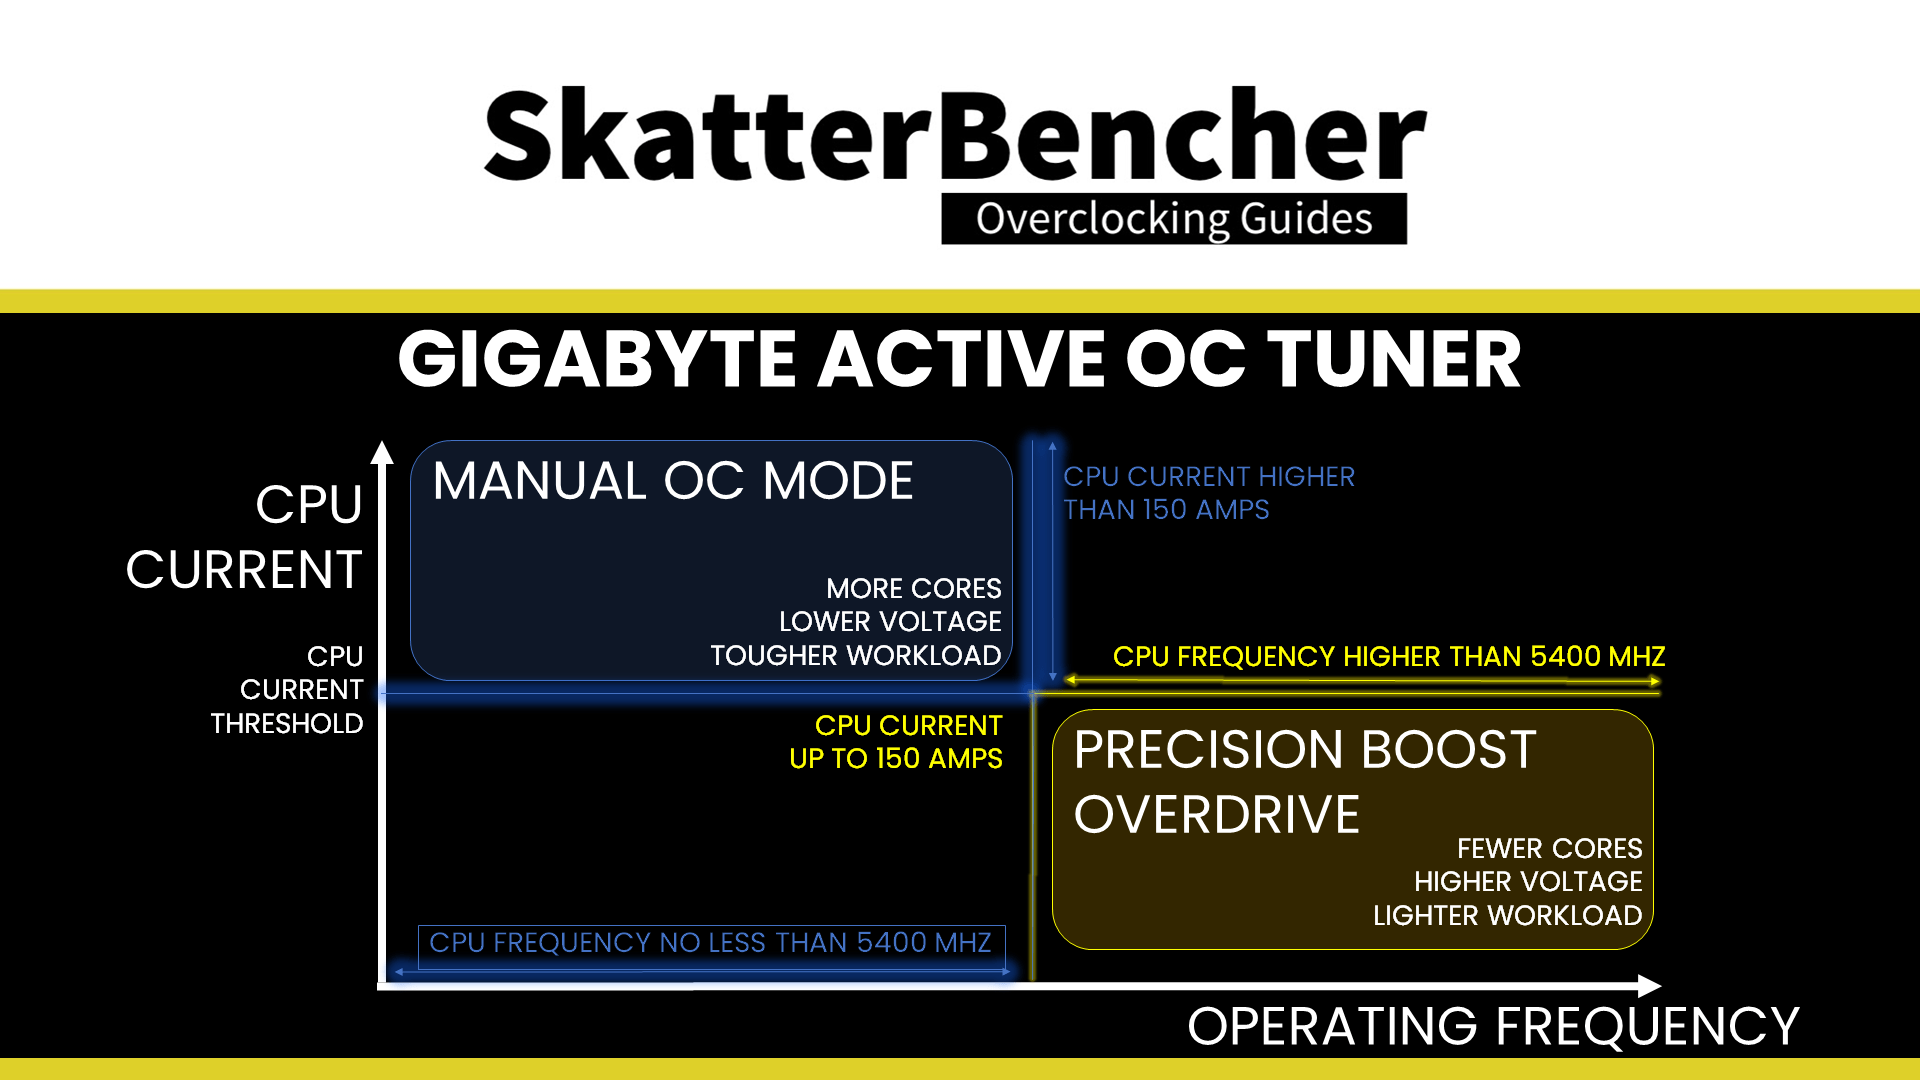
GIGABYTE Active OC Tuner gives us the best of both worlds, allowing the system to actively switch between Precision Boost Overdrive and manual OC Mode. It’s most easy to conceptualize AOCT as retaining all automatic Precision Boost benefits but with a manually configured frequency floor for all-core workloads.
AOCT requires little additional configuration work. We need to know two things:
- What is the lowest frequency we will allow
- At which point do we want AOCT to switch between PBO and OC Mode
Sadly, we cannot simply configure a minimum frequency and have the system switch based on that. Instead, we need to use a proxy metric: a specific current or temperature threshold. There is no perfect method of determining the ideal threshold, so I’ll show you one example using Cinebench R23.
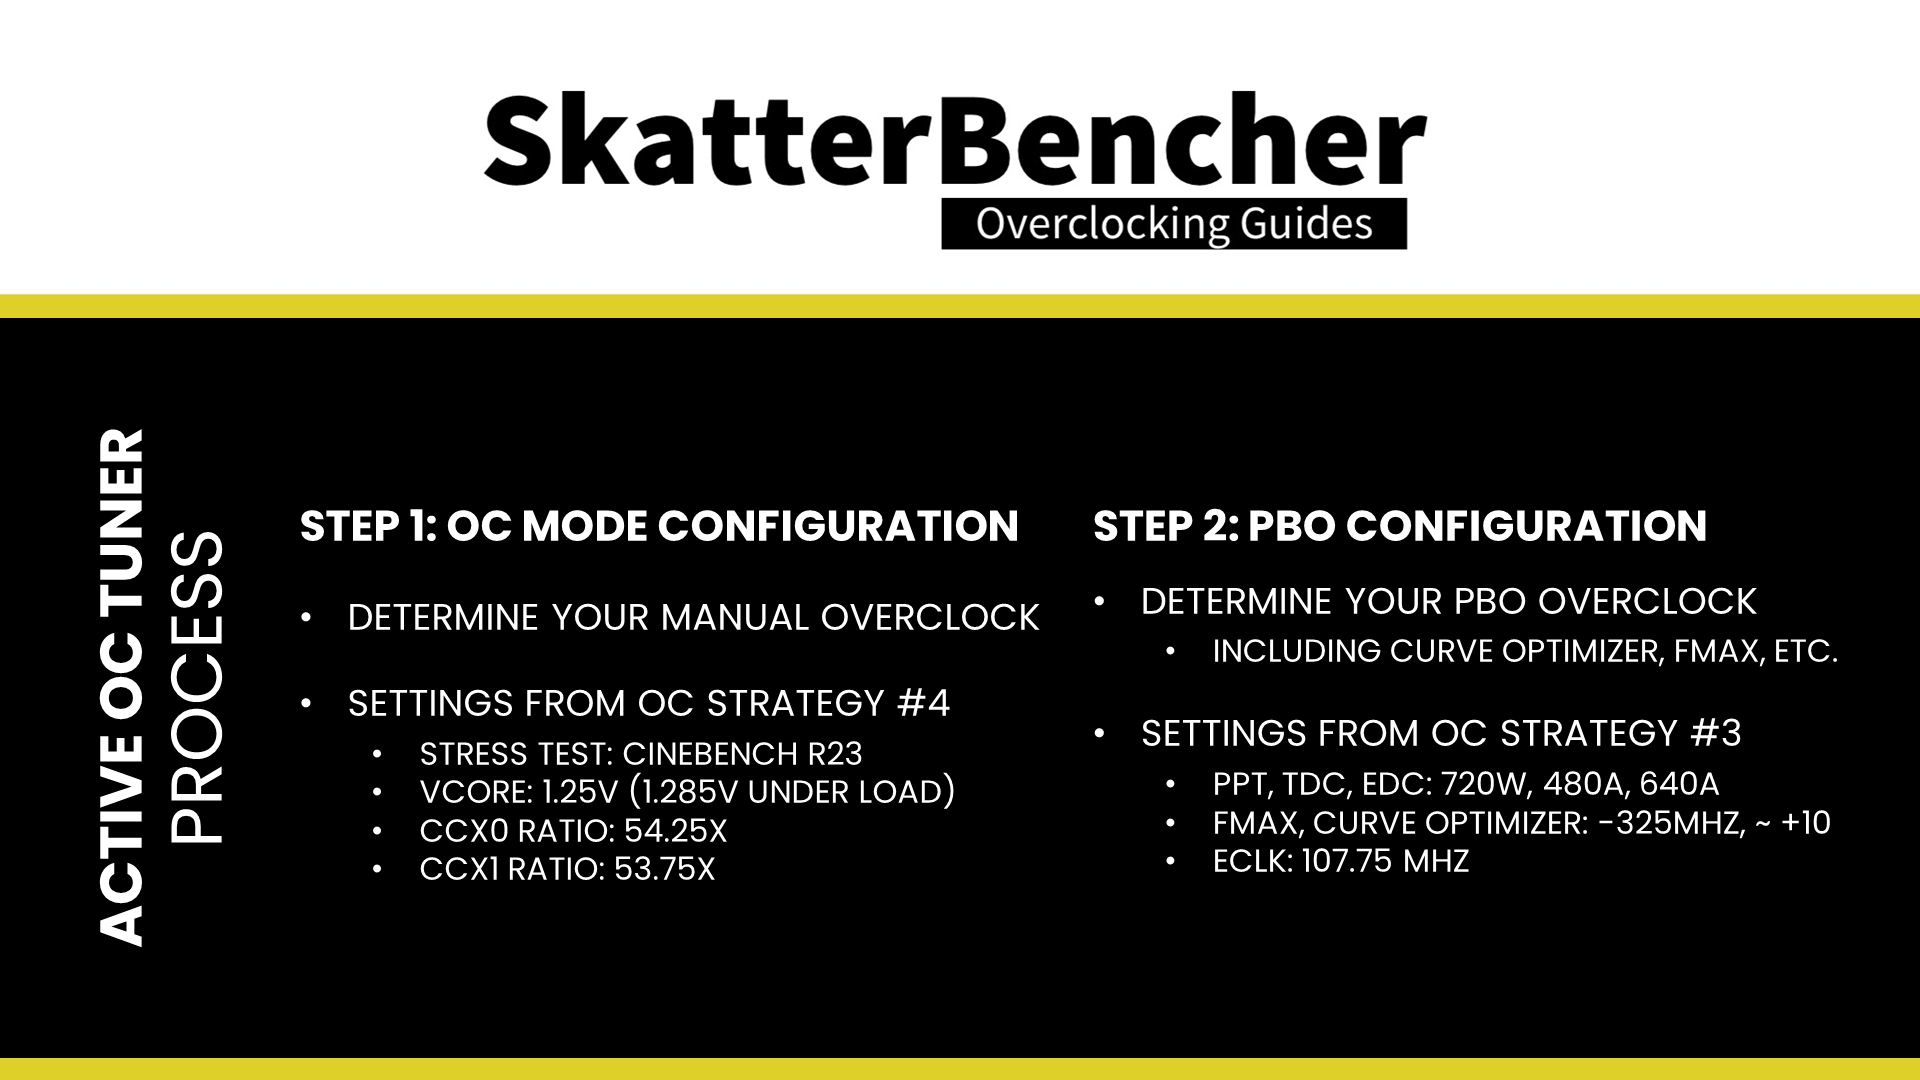
The first step is to determine your desired manual overclock. The fastest way to get to this point is by selecting your stress test tool of choice and finding the maximum CPU voltage within your thermal budget. Afterward, you can find the maximum stable frequency for that voltage and temperature. In our case, we can rely on our overclocking settings from OC Strategy #4.
- Stress Test: Cinebench R23 30min stress test
- Vcore: 1.25V (1.285V under load)
- CCX0 Ratio: 54.25
- CCD1 Ratio: 53.75
We can write the settings down and switch back to tuning with Precision Boost Overdrive.
The next step is to apply all your Precision Boost Overdrive tuning settings, including any custom Curve Optimizer or Fmax Override settings. In our case, we can rely on the settings from OC Strategy #3.
Then, go into the operating system and open your stress test tool and HWiNFO. We aim to find where the Precision Boost frequency drops below our target manual overclock of 5400 MHz and check the current use. In HWiNFO, usually, we would monitor the VRM current. Unfortunately, it’s not available on this version of the software. So, instead, we monitor the CPU Package power and Vcore. Our current value will be the power divided by voltage.
Then we start the Cinebench R23 stress test and change the affinity to 1 thread in Task Manager. Now monitor the core clock frequency. It will be higher than our target of 5400 MHz.
Now you can gradually increase the active thread count. When you reach 5400 MHz or below, check the CPU Package power and Vcore. The combination of these values will be our input for the AOCT Current Threshold setting.
In my case, we reach the frequency of 5400 MHz at about 20 active threads. The CPU package power reads 200W at a voltage of 1.3V. So the Current Threshold value for Active OC Tuner will be around 150A.
So, to reiterate what’s happening: Active OC Tuner will actively switch between OC mode and Precision boost when the CPU current hits 150A. Anything above 150A engages manual OC mode; anything below 150A will engage Precision Boost.
Oh, one last thing.
Our Precision Boost Overdrive ECLK OC strategy includes an adjusted ECLK frequency of 107.75 MHz. When Active OC Tuner switches between PBO and OC mode, it does not change these settings. So, we must adjust our manual overclock settings accordingly:
- CCD0 CCX0 Ratio from 54.25 to 50.25
- CCD1 CCX0 Ratio from 53.75 to 49.75

BIOS Settings & Benchmark Results
Upon entering the BIOS
- Switch to Advanced Mode
- Set CPU Clock Control to 107.75MHz
- Set Async CPU/PCIe Clock to Enabled
- Set CPU Ratio Mode to Per CCX
- Set CCD0 CCX0 Ratio to 50.25
- Set CCD1 CCX0 Ratio to 49.75
- Set Active OC Tuner to Manual
- Set CPU Current Limit to 150
- Enter the Advanced CPU Settings submenu
- Enter the Precision Boost Overdrive submenu
- Set Precision Boost Overdrive to Advanced
- Set PBO Limits to Motherboard
- Set CPU Boost Clock Override to Enabled (Negative)
- Set Max CPU Boost Clock Override(-) to 325
- Enter the Curve Optimizer submenu
- Set Curve Optimizer to Per Core
- For every core, set Curve Optimizer Sign to Positive
- For Cores 0, 1, 3, 5, 7, and 14, set Curve Optimizer Magnitude to 15
- For Core 2, set Curve Optimizer Magnitude to 20
- For Cores 4, 6, 8, 9, 10, 11, 12, 13, and 15, set Curve Optimizer Magnitude to 10
- Leave the Curve Optimizer submenu
- Leave the Precision Boost Overdrive submenu
- Enter the Precision Boost Overdrive submenu
- Leave the Advanced CPU Settings submenu
- Set Extreme Memory Profile(XMP/EXPO) to EXPO 1
- Set XMP/EXPO High Bandwidth Support to Enabled
- Set System Memory Multiplier to 60.00
- Set CPU Vcore to 1.25
Then save and exit the BIOS.
We re-ran the benchmarks and checked the performance increase compared to the default operation.
- SuperPI 4M: +3.57%
- Geekbench 5 (single): +6.37%
- Geekbench 5 (multi): +13.93%
- Cinebench R23 Single: +6.30%
- Cinebench R23 Multi: +7.52%
- CPU-Z V17.01.64 Single: +3.53%
- CPU-Z V17.01.64 Multi: +3.85%
- V-Ray 5: +8.29%
- AI Benchmark: +13.94%
- 3DMark Night Raid: +4.07%
- CS:GO FPS Bench: +1.04%
- Tomb Raider: +0.00%
- Final Fantasy XV: +1.17%

Here are the 3DMark CPU Profile scores at stock
- CPU Profile 1 Thread: +4.95%
- CPU Profile 2 Threads: +5.09%
- CPU Profile 4 Threads: +5.00%
- CPU Profile 8 Threads: +5.71%
- CPU Profile 16 Threads: +2.22%
- CPU Profile Max Threads: +5.28%
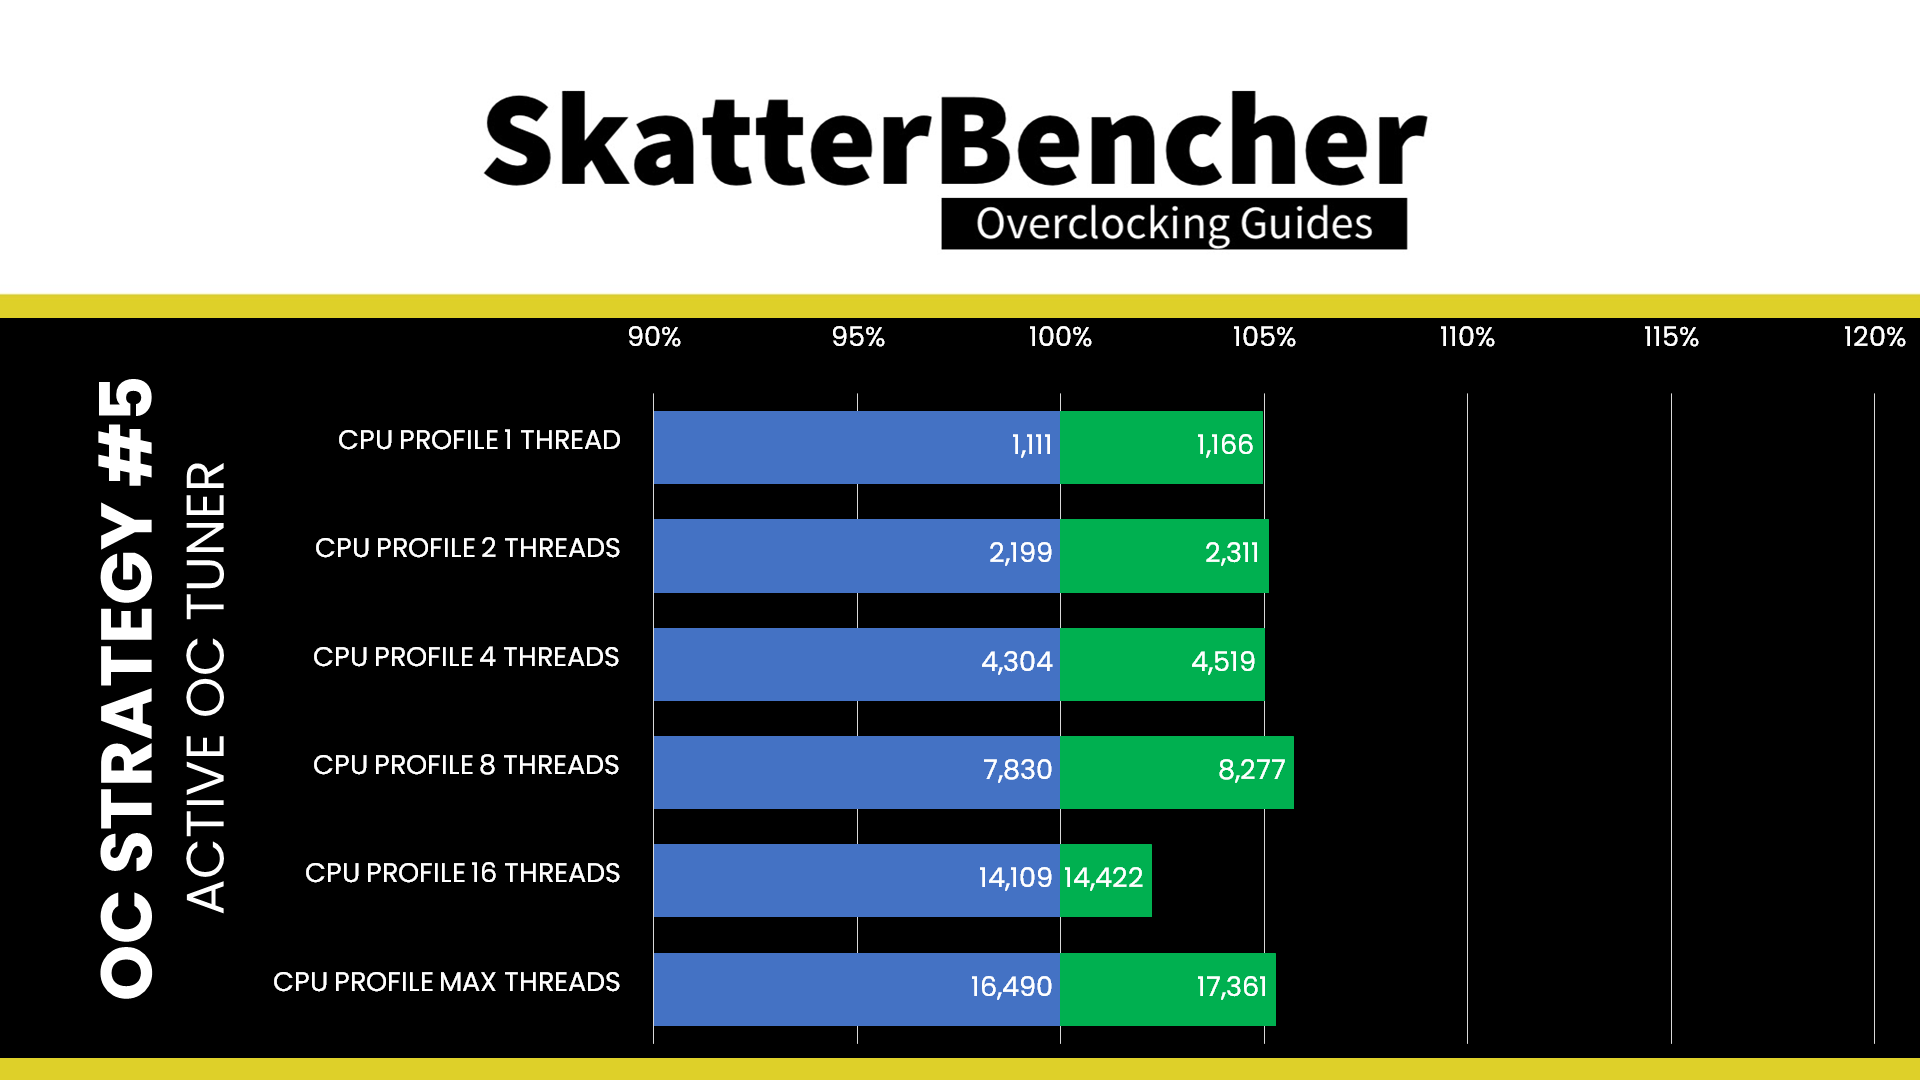
As expected, by relying on Active OC Tuner, we get a performance mix similar to the best results from OC Strategy #3 and #4. Interestingly, we don’t get the outright best performance across the board. In some scenarios, a tuned Precision Boost outperforms our manual overclock in an all-core workload. Also, there may be a performance hit when the load is right on the Active OC Tuner switching point. We see the best performance improvement of +13.94% in AI Benchmark
When running Prime 95, unfortunately, the CPU is not stable. This is a deliberate choice on our side as we decided to forego stability in extreme scenarios in favor of Cinebench R23 as a stability requirement.
AMD Ryzen 9 7950X: Conclusion
Alright, let us wrap this up.
The Ryzen 9 7950X is the flagship Zen 4 desktop processor. Within the Ryzen 7000 product stack, it’s definitely the fastest in terms of advertised and overclocked frequencies. Seeing an AMD CPU running at 5.8GHz and beyond is very satisfying.
I think there will be mixed reactions from customers and media in terms of overclocking. There appears to be a significant gap between the maximum frequency of the worst core and best core in a Ryzen 9 7950X. At stock, there’s a 350 MHz gap between this chip’s best core and worst core. This gap comes down to 230 MHz after Curve Optimizing and 130 MHz after eCLK tuning, but the gap remains.
Furthermore, this particular chip is excellent. While I could even get the chip to boost to beyond 6 GHz during my testing, I’ve seen other 7950X CPUs where a curve optimizer of minus 5 was unstable. The silicon lottery will definitely be a factor early in the product lifecycle. But if you’ve got a good one, chasing the 6 GHz dream will be a delightful experience.
Anyway, that’s all for today!
I want to thank my Patreon supporters for supporting my work.
As per usual, if you have any questions or comments, feel free to drop them in the comment section below.
‘Till the next time!
Italo ruiz
Tried all the initial settings for memory and everything else my pc does not boot up no post
Overclock EK Water-cooled Ryzen 7950X PC to 6GHz! - SkatterBencher
[…] SkatterBencher collaborates with EK showing the world’s first water-cooled Ryzen 7000 PC and helps overclock it to 6 GHz. You can check the video below. The overclocking information relayed in this video is based on the overclocking techniques used in SkatterBencher #45. […]