SkatterBencher #46: AMD Ryzen 9 7900X Overclocked to 5900 MHz

We overclock the AMD Ryzen 9 7900X up to 5900 MHz with the ASUS ROG Crosshair X670E Extreme motherboard and EK custom loop water cooling.
I will go over a variety of overclocking strategies and will even be able to show 6GHz at the very end of the article.
Alright, we have lots to cover, so let’s jump straight in.
AMD Ryzen 9 7900X: Introduction
The AMD Ryzen 9 7900X processor is part of the Ryzen 7000 Zen 4 AM5 desktop product line-up.
The Zen 4 desktop CPUs codenamed Raphael launched on August 29, 2022, during an AMD Livestream. At launch, there were 4 SKUs available. The Ryzen 9 7900X we are overclocking today is one of the two Ryzen 9 high-end tier processors available.
Zen 4 Raphael is very similar to Zen 3 Vermeer, but there are some noteworthy differences. Most importantly, Raphael requires the new AM5 socket and supports DDR5 memory. The CCDs, featuring the Zen 4 CPU cores, is AMD’s first chip using TSMC N5 manufacturing technology. Raphael also introduces AVX-512 support and operates at significantly higher clock frequencies.
The Ryzen 9 7900X has twelve cores with 24 threads, a base frequency of 4.7 GHz, and a maximum listed boost frequency of 5.6GHz. The TDP is 170W, and PPT is 230W.

In this video, we will cover five overclocking strategies:
- First, we simply rely on AMD PBO and EXPO performance boost technologies
- Second, we rely on ASUS AI Overclocking performance boost technology
- Third, we tune Precision Boost Overdrive with Curve Optimizer
- Fourth, we tune Precision Boost Overdrive with asynchronous eCLK
- Lastly, we try to do a manual overclock

However, before we jump into overclocking, let us quickly review the hardware and benchmarks used in this video.
AMD Ryzen 9 7900X: Platform Overview
Along with the AMD Ryzen 9 7900X processor and ASUS ROG Crosshair X670E Extreme motherboard, in this guide, we will be using a pair of G.SKILL Trident Z5 Neo DDR5-6400 memory sticks, an ASUS ROG STRIX RTX 2080TI graphics card, an 512GB M.2 NVMe SSD, a Seasonic Prime 850W Platinum power supply, the ElmorLabs Easy Fan Controller, the ElmorLabs EVC2SX, the EK-Quantum Magnitude water block, and EK-Quantum water cooling. All this is mounted on top of our favorite Open Benchtable V2.


ElmorLabs EFC & EVC2
I explained how I use ElmorLabs products in SkatterBencher #34. By connecting the EFC and PMD to the EVC2 device, I monitor the ambient temperature (EFC), water temperature (EFC), fan duty cycle (EFC), and CPU input power (PMD). I include the measurements in my Prime95 stability test results.
I also use the ElmorLabs EFC to map the radiator fan curve to the water temperature. Without going into too many details: I have attached an external temperature sensor from the water in the loop to the EFC. Then, I use the low/high setting to map the fan curve from 25 to 40 degrees water temperature. I use this configuration for all overclocking strategies.
AMD Ryzen 9 7900X: Benchmark Software
We use Windows 11 and the following benchmark applications to measure performance and ensure system stability.
- SuperPI 4M https://www.techpowerup.com/download/super-pi/
- Geekbench 5 https://www.geekbench.com/
- Cinebench R23 https://www.maxon.net/en/cinebench/
- CPU-Z https://www.cpuid.com/softwares/cpu-z.html
- V-Ray 5 https://www.chaosgroup.com/vray/benchmark
- AI-Benchmark https://ai-benchmark.com/
- 3DMark CPU Profile https://www.3dmark.com/
- 3DMark Night Raid https://www.3dmark.com/
- CS:GO FPS Bench https://steamcommunity.com/sharedfiles/filedetails/?id=500334237
- Shadow of the Tomb Raider https://store.steampowered.com/app/750920/Shadow_of_the_Tomb_Raider_Definitive_Edition/
- Final Fantasy XV http://benchmark.finalfantasyxv.com/na/
- Prime 95 https://www.mersenne.org/download/

AMD Ryzen 9 7900X: Stock Performance
Before starting overclocking, we must check the system performance at default settings. Note that on this motherboard, Precision Boost Overdrive is enabled by default.
So, to check the performance at default settings, you must enter the BIOS and
- Go to the Extreme Tweaker menu
- Enter the Precision Boost Overdrive submenu
- Set Precision Boost Overdrive to Disabled
Then save and exit the BIOS.
Note that the Precision Boost 2 boosting algorithm is still active even though we disabled Precision Boost Overdrive. The standard parameters of the Precision Boost algorithm for the Ryzen 9 7900X are as follows:

Here is the benchmark performance at stock:
- SuperPI 4M: 29.012 seconds
- Geekbench 5 (single): 2,244 points
- Geekbench 5 (multi): 18,896 points
- Cinebench R23 Single: 2,034 points
- Cinebench R23 Multi: 28,306 points
- CPU-Z V17.01.64 Single: 791.0 points
- CPU-Z V17.01.64 Multi: 12,010.6 points
- V-Ray 5: 21,719 vsamples
- AI Benchmark: 5,951 points
- 3DMark Night Raid: 77,467 points
- CS:GO FPS Bench: 595.13 fps
- Tom Raider: 200 fps
- Final Fantasy XV: 186.98 fps

Here are the 3DMark CPU Profile scores at stock
- CPU Profile 1 Thread: 1,129
- CPU Profile 2 Threads: 2,205
- CPU Profile 4 Threads: 4,348
- CPU Profile 8 Threads: 7,975
- CPU Profile 16 Threads: 11,916
- CPU Profile Max Threads: 12,866

When running Prime 95 Small FFTs with AVX-512 enabled, the average CPU effective clock is 4883 MHz with 1.148 volts. The average CPU temperature is 95.3 degrees Celsius. The ambient and water temperature is 25.3 and 35.0 degrees Celsius. The average CPU package power is 194.2 watts.

When running Prime 95 Small FFTs with AVX disabled, the average CPU effective clock is 5022 MHz with 1.208 volts. The average CPU temperature is 95.3 degrees Celsius. The ambient and water temperature is 25.1 and 34.6 degrees Celsius. The average CPU package power is 192.5 watts.

Now, let us try our first overclocking strategy.
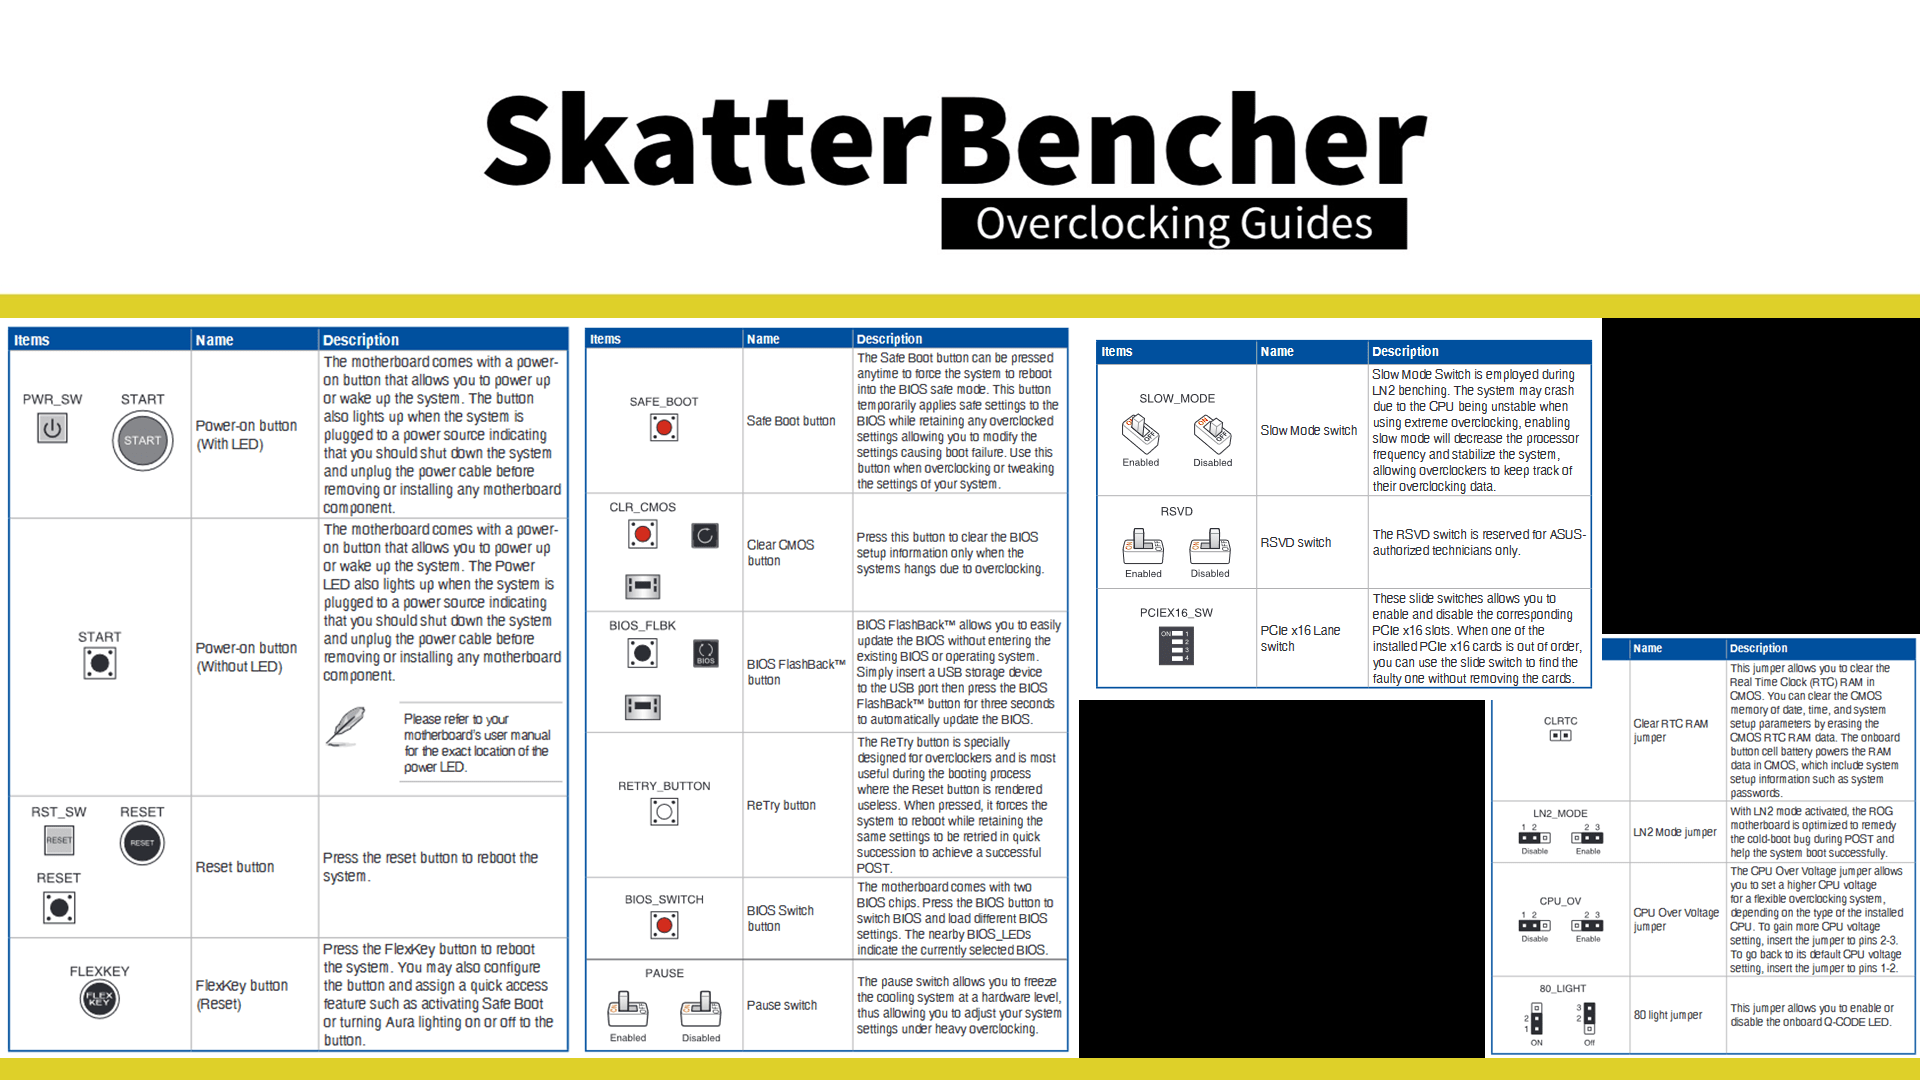
However, before we get going, make sure to locate the CMOS Clear button
Pressing the Clear CMOS button will reset all your BIOS settings to default which is helpful if you want to start your BIOS configuration from scratch. However, it does not delete any of the BIOS profiles previously saved. The Clear CMOS button is located on the rear I/O panel.
OC Strategy #1: PBO 2 + EXPO
In our first overclocking strategy, we take advantage of AMD exclusive features Precision Boost Overdrive and Extended Profiles for Overclocking.
PBO 2 – Precision Boost Overdrive 2
With the launch of Zen 3, AMD introduced an improved version of the Precision Boost Overdrive toolkit, allowing for manual tuning of the parameters affecting the Precision Boost frequency boost algorithm.
Precision Boost Overdrive 2 builds on the PBO implementation of Zen 2. In addition to the platform overclocking knobs from Zen+ (PPT, TDC, EDC) and processor overclocking knobs from Zen 2 (Boost Override and Scalar), Precision Boost Overdrive 2 introduces Curve Optimizer.

There are essentially 3 levels of Precision Boost Overdrive
- AMD’s stock values, which can be set by disabling PBO
- The motherboard vendor values, which are programmed into the BIOS to match the motherboard VRM specification and can be set by enabling PBO
- Custom values, which can be programmed by the end-user

I explored the ins and outs of Precision Boost Overdrive 2 tuning in my AMD Raphael Overclocking launch article. If you want to learn more about the impact of each of these settings, I suggest you check out that article.
In this overclocking strategy, we’re just enabling Precision Boost Overdrive, whereas, in the following strategies, we’ll explore tuning the parameters.
We find that the following values have changed:

For previous Ryzen CPUs, increasing the platform boost parameters substantially impacted performance. Especially for the higher core-count CPUs. For Ryzen 7000, however, AMD’s default platform parameters are relatively unconstraining. During a Prime95 non-AVX workload, we see maximum values for PPT, TDC, and EDC are 200W, 148A, and 151A, respectively. That’s well below the limits.
So, ultimately, we don’t expect that much performance improvement.
EXPO – Extended Profiles for Overclocking
EXPO stands for AMD Extended Profiles for Overclocking. It is an AMD technology that enables ubiquitous memory overclocking profiles for AMD platforms supporting DDR5 memory. EXPO allows memory vendors such as G.SKILL to program higher performance settings onto the memory sticks. If the motherboard supports EXPO, you can enable higher performance with a single BIOS setting. So, it saves you lots of manual configuration.

While our memory kit is rated at DDR5-6400, I had to run it at DDR5-6000 for stability reasons as my system wasn’t stable at higher frequencies. I’m using an early CPU, motherboard, and BIOS combination, so memory overclocking may improve soon.
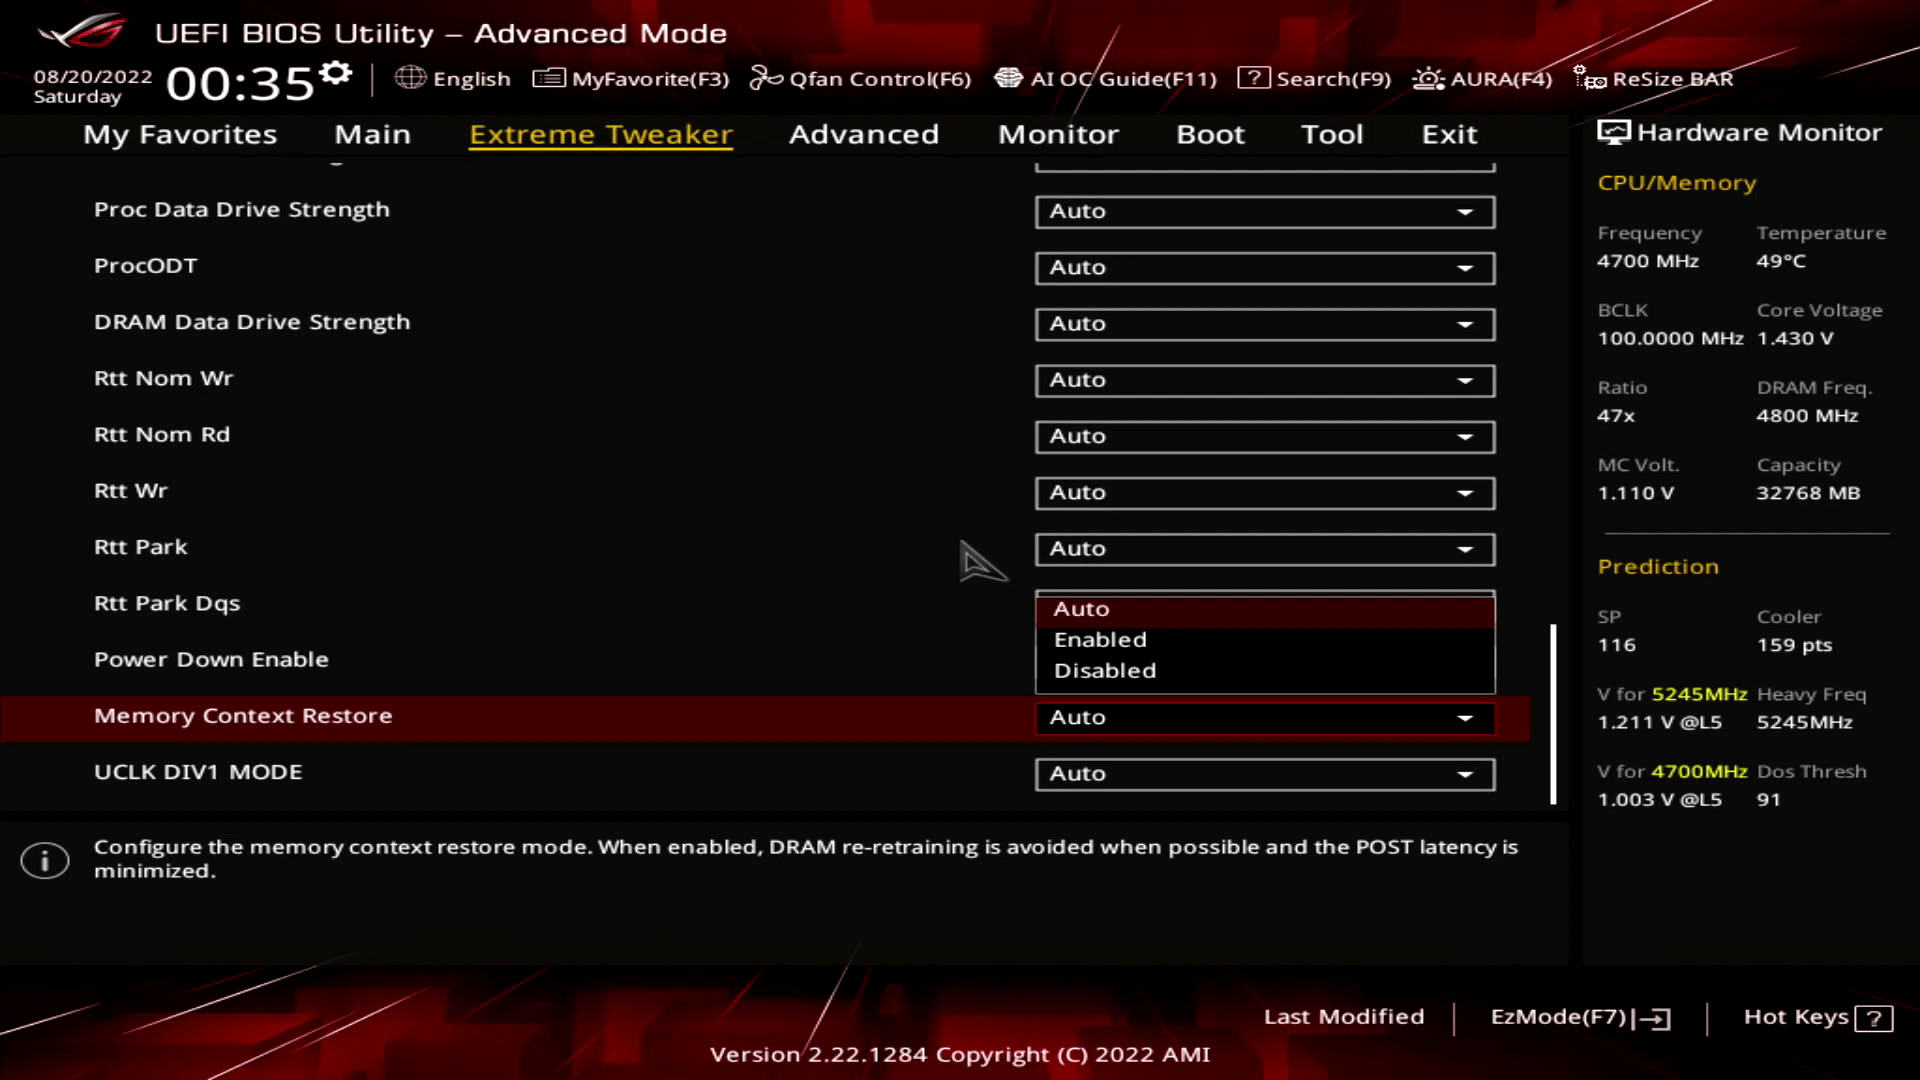
Memory Context Restore
In the meantime, to increase the chance of a successful memory overclock, I recommend disabling a memory controller option called Memory Context Restore.
Memory Context Restore essentially enables or disables forced DRAM re-training at every boot. Training is a DRAM process that aims to optimize the signal integrity between the CPU memory controller and DRAM memory chips. Better signal integrity means better stability at higher frequencies. Memory training can be a lengthy process. So, to improve a system’s boot-up speed, BIOS routines typically skip some parts or even the entire process.
I find that disabling this option, and thus forcing the DRAM training process on every boot, significantly improves memory stability at higher frequencies. Unfortunately, it also lengthens the boot-up process.
BIOS Settings & Benchmark Results
Upon entering the BIOS
- Go to the Extreme Tweaker menu
- Set Ai Overclock Tuner to EXPO II
- Set Memory Frequency to DDR5-6000MHz
- Enter the DRAM Timing Control submenu
- Set Memory Context Restore to Disabled
- Leave the DRAM Timing Control submenu
- Enter the Precision Boost Overdrive submenu
- Set Precision Boost Overdrive to Enabled
Then save and exit the BIOS.
We re-ran the benchmarks and checked the performance increase compared to the default operation.
- SuperPI 4M: +1.29%
- Geekbench 5 (single): +1.11%
- Geekbench 5 (multi): +6.55%
- Cinebench R23 Single: +0.69%
- Cinebench R23 Multi: +3.73%
- CPU-Z V17.01.64 Single: +0.13%
- CPU-Z V17.01.64 Multi: +0.87%
- V-Ray 5: +0.87%
- AI Benchmark: +6.05%
- 3DMark Night Raid: +2.38%
- CS:GO FPS Bench: +0.63%
- Tomb Raider: +1.50%
- Final Fantasy XV: +1.66%

Here are the 3DMark CPU Profile scores:
- CPU Profile 1 Thread: +0.80%
- CPU Profile 2 Threads: +2.402%
- CPU Profile 4 Threads: +1.24%
- CPU Profile 8 Threads: +0.34%
- CPU Profile 16 Threads: +0.87%
- CPU Profile Max Threads: +2.19%

As expected, enabling Precision Boost Overdrive does little to improve the system’s performance. After all, the CPU is primarily limited by operating temperature, not by any platform power parameters. Thanks to enabling EXPO, we see a performance improvement of 6.55% in Geekbench 5 Multi.
When running Prime 95 Small FFTs with AVX-512 enabled, the average CPU effective clock is 4901 MHz with 1.152 volts. The average CPU temperature is 95.3 degrees Celsius. The ambient and water temperature is 25.0 and 35.3 degrees Celsius. The average CPU package power is 206.6 watts.

When running Prime 95 Small FFTs with AVX disabled, the average CPU effective clock is 5023 MHz with 1.204 volts. The average CPU temperature is 95.3 degrees Celsius. The ambient and water temperature is 25.0 and 34.8 degrees Celsius. The average CPU package power is 200.4 watts.

OC Strategy #2: AI Overclocking
In our second overclocking strategy, we use the Asus AI Overclocking feature integrated into the ASUS ROG BIOS.
Ryzen 9 7900X ASUS AI Overclocking
For many years board vendors have tried to implement automatic overclocking features in their BIOS for more straightforward performance enhancement. This has always been a mixed bag, as most preset OC profiles are overly optimistic in frequency target or overly generous with the voltage selection. So often, you would end up with a slightly unstable or overheating system.
ASUS AI overclocking uses a unique strategy for automatic overclocking. Instead of working with preset frequency and voltage profiles, the system will monitor the CPU and cooling system throughout an initial testing phase. Based on its findings, it will then predict the optimal settings. The system will automatically guide the overclocking process and adjust voltages and frequency to match your cooling system.
The better your cooling, the higher your AI overclock.

ASUS introduced AI Overclocking on its Z490 ROG motherboards (SkatterBencher #10) as a next-generation automatic overclocking technology. Since then, it’s been present on every next Intel platform; however, not on any AMD platform. That changes with the AM5.
There are three steps to enabling AI overclocking. First, reset the BIOS to default settings. Then, reboot and enter the operating system. Run a couple of heavy workloads such as Prime95, Realbench, or Cinebench R23 for 10 to 30 minutes. Then return to the BIOS and enter the AI OC Guide menu from the top. Make sure to read through the explanation and click Enable AI when ready.

In addition to automatic overclocking, AI Overclocking provides a lot of advanced information and suggestions in the AI Features menu. The information includes:
- P0 VID and SP values for each CPU core
- Precision Boost Overdrive 2 suggested overclocking parameters
- Dynamic OC Switcher suggested overclocking parameters
The SP value is based on the combination of maximum boost frequency, temperature, and P0 VID. Generally, it indicates the quality of a particular core. A higher SP value would indicate a better-quality core with superior overclocking capabilities, though it’s not an exact science. The overclocking suggestions are based on a continued evaluation of your CPU thermal solution.

After enabling AI Overclock, the following settings have changed:
- CPU Core Ratio: AI Optimized
- Preference: Performance
- Precision Boost Overdrive: Enabled
- Medium Load Boostit: Enabled
- Max CPU Boost Clock Override: +100MHz
- Scalar: 7X
- Curve Optimizer: -10 for CCD0 and -4 for CCD1
- Dynamic OC Switcher: Enabled
- CCX0 Ratio: 53.25X
- CCD1 Ratio: 51.25X
- Core VID: 1.231V
- Current Threshold: 91A
As you can see, AI Overclock provides a conservative +100 MHz increase of the Precision Boost maximum frequency. It also boosts the CPU to 5225 MHz in all-core workloads by enabling Dynamic OC Switcher.

BIOS Settings & Benchmark Results
Upon entering the BIOS
- Enter the Ai Overclocking Guide
- Go through the guide, then click Enable AI
- Set Ai Overclock Tuner to EXPO II
- Set Memory Frequency to DDR5-6000MHz
- Ensure CPU Core Ratio is set to AI Optimized and Preference is set to performance
- Enter the DRAM Timing Control submenu
- Set Memory Context Restore to Disabled
- Leave the DRAM Timing Control submenu
Then save and exit the BIOS.
We re-ran the benchmarks and checked the performance increase compared to the default operation.
- SuperPI 4M: +1.48%
- Geekbench 5 (single): +1.38%
- Geekbench 5 (multi): +8.01%
- Cinebench R23 Single: +1.18%
- Cinebench R23 Multi: +5.59%
- CPU-Z V17.01.64 Single: +1.09%
- CPU-Z V17.01.64 Multi: +1.42%
- V-Ray 5: +4.78%
- AI Benchmark: +6.86%
- 3DMark Night Raid: +3.10%
- CS:GO FPS Bench: +0.68%
- Tomb Raider: +1.50%
- Final Fantasy XV: +2.66%

Here are the 3DMark CPU Profile scores
- CPU Profile 1 Thread: +1.59%
- CPU Profile 2 Threads: +2.59%
- CPU Profile 4 Threads: +1.52%
- CPU Profile 8 Threads: +2.08%
- CPU Profile 16 Threads: +1.58%
- CPU Profile Max Threads: +2.56%

Increasing the Precision Boost maximum CPU frequency ceiling by 100 MHz is an increase of less than 2% over the standard limit of 5700 MHz. However, the Curve Optimizer settings should provide a nice boost to the average frequency. Overall, the performance uplift is not that huge. However, with the DOS-powered manual overclock, we get a considerable improvement of up to 8.01% in Geekbench 5.
When running Prime 95 Small FFTs with AVX-512 enabled, unfortunately, the CPU is not stable. AI Overclock targets the typical use-case and stability requirements, not a worst-case scenario like Prime95 with AVX.
When running Prime 95 Small FFTs with AVX disabled, the average CPU effective clock is 5221 MHz with 1.145 volts. The average CPU temperature is 86.0 degrees Celsius. The ambient and water temperature is 25.7 and 34.8 degrees Celsius. The average CPU package power is 190.1 watts.

OC Strategy #3: PBO Tuned with Curve Optimizer
In our third overclocking strategy, we will use the Curve Optimizer tool included in the Precision Boost Overdrive overclocker’s toolkit.
PBO 2: Curve Optimizer
As I mentioned earlier in this video, Curve Optimizer is an important new feature of Precision Boost Overdrive 2.

Curve Optimizer allows end-users to adjust the factory-fused VFT curve, or voltage-frequency-temperature curve, for each CPU core separately. The VFT curve is a unique curve for each core inside your CPU that defines the required voltage for a given frequency at a given temperature. Higher frequencies or higher operating temperatures require higher voltage.

Curve Optimizer adjusts the VFT curve by offsetting the voltages of the factory-fused VFT curve. By setting a positive offset, you increase the voltage point. Conversely, you decrease the voltage point by setting a negative offset.


You can offset the entire curve by up to 30 steps in a positive direction and up to 300 steps in a negative direction. Each step represents approximately 5 to 7mV.
The traditional overclocking approach for AMD Ryzen CPUs is to set a negative curve optimizer. Two things happen when you adjust the VFT curve with a negative point offset.
- You effectively tell the CPU that it needs less voltage for a given frequency. And, as a consequence, at a given voltage, it can apply a higher frequency. So, when the Precision Boost 2 algorithm determines sufficient power and temperature headroom to use 1.35V, with the negative point offset, it will target a higher frequency.
- The CPU temperature will be lower because you use less voltage at a given frequency. That extra thermal headroom will also encourage the Precision Boost algorithm to target higher voltages and frequencies.
In my AMD Raphael overclocking launch article, I explored the ins and outs of Curve Optimizing with Precision Boost Overdrive 2. If you want to learn more about the impact of Curve Optimizer, I suggest you check out that article.
As I mentioned already, Curve Optimizer is available on a per-core basis. Like in the past, per-core tuning offers a real benefit as it provides some cores with a lot more frequency headroom.
Ryzen 9 7900X Curve Optimizer Tuning Process
The manual tuning process for Curve Optimizer can become quite convoluted since it affects the CPU core voltage in all scenarios ranging from very light single-threaded workloads to heavy all-core workloads.
My Curve Optimizer process for this Ryzen 9 7900X was as follows.
First, I use a broad tuning approach to get a big-picture understanding of the tuning opportunity. Then, I narrow down the per-core curve optimizer settings to achieve stability in a light workload. Then, I verify the stability in all-core multi-threaded workloads. Lastly, I run through all my benchmarks to validate stability in a wide range of test scenarios.
The broad tuning process includes:
- Using Shamino’s Boost Curve tool to track the average frequency across an increasing amount of active threads
- Gradually increasing an all-core negative curve optimizer until the point of instability
- Gradually increasing Fmax Boost Override in case the boost frequency is hitting the frequency ceiling
The narrow tuning process includes:
- Using SuperPI 32M with affinity to a specific thread to check the maximum effective clock frequency
- Gradually increasing the per-core negative curve optimizer until the point of instability for each core
- Gradually increasing Fmax Boost Override in case the boost frequency is hitting the frequency ceiling
The all-core stability process includes running Prime 95 Small FFTs with both AVX-512 enabled and disabled.
The benchmark validation process includes completing all the benchmarks I’ve included in this guide. If a benchmark is unstable, I increase every core’s per-core curve optimizer value by 2 until I reach stability.

In my case, I used a per-core Curve Optimizer ranging from -28 on Cores 2, 4, 6, 7, 8, 10, and 11 to -9 on Core 5 and a Fmax boost override of +200 MHz.

I will show you the BIOS configuration in a minute. First, note that the per-core curve optimizer settings are CPU-specific, and the optimal values of your CPU may differ substantially.
The following table shows the boost profile for this specific CPU.


We can make a couple of interesting observations.
At stock, the boost curve shows frequencies well below the advertised boost frequency of 5.6 GHz. That’s not implausible, considering the boost curve frequency is based on the average frequency of every active core, and some cores just boost higher than others. But, upon closer inspection of the boost of each individual core, we find that the maximum boost frequency under a light workload is 5584 MHz for Cores 0 and 1. That’s still below the advertised boost frequency of 5.6 GHz, but close enough.
While AMD advertises a boost clock of 5.6 GHz, the factory-programmed Fmax frequency ceiling is 5.7 GHz. So, on some CPUs, you may see the frequency boost beyond the advertised boost frequency. However, since none of the cores on our CPU are boosting past 5.6 GHz, increasing the Fmax ceiling by 200 MHz to 5.9 GHz won’t change much to the boost curve. And that’s what we also see in the results.
After Curve Optimizing, we can see a substantial frequency uplift across the board. While none of our cores are hitting the increased Fmax ceiling, some cores in CCD0 are boosting well over 5.8 GHz.
BIOS Settings & Benchmark Results
Upon entering the BIOS
- Go to the Extreme Tweaker menu
- Set Ai Overclock Tuner to EXPO II
- Set Memory Frequency to DDR5-6000MHz
- Enter the DRAM Timing Control submenu
- Set Memory Context Restore to Disabled
- Leave the DRAM Timing Control submenu
- Enter the Precision Boost Overdrive submenu
- Set Precision Boost Overdrive to Enabled
- Set CPU Boost Clock Override to Enabled (Positive)
- Set Max CPU Boost Clock Override to 200
- Enter the Curve Optimizer submenu
- Set Curve Optimizer to Per Core
- For every core, set Curve Optimizer Sign to Negative
- For Cores 0 and 1, set Curve Optimizer Magnitude to 17
- For Cores 2, 4, 6, 7, 8, 10, and 11, set Curve Optimizer Magnitude to 28
- For Core 3, set Curve Optimizer Magnitude to 9
- For Core 9, set Curve Optimizer Magnitude to 22
Then save and exit the BIOS.
We re-ran the benchmarks and checked the performance increase compared to the default operation.
- SuperPI 4M: +3.09%
- Geekbench 5 (single): +1.65%
- Geekbench 5 (multi): +8.32%
- Cinebench R23 Single: +1.57%
- Cinebench R23 Multi: +5.62%
- CPU-Z V17.01.64 Single: +1.73%
- CPU-Z V17.01.64 Multi: +2.34%
- V-Ray 5: +5.22%
- AI Benchmark: +8.50%
- 3DMark Night Raid: +3.50%
- CS:GO FPS Bench: +1.23%
- Tomb Raider: +1.50%
- Final Fantasy XV: +2.03%

Here are the 3DMark CPU Profile scores
- CPU Profile 1 Thread: +2.30%
- CPU Profile 2 Threads: +3.85%
- CPU Profile 4 Threads: +2.39%
- CPU Profile 8 Threads: +2.45%
- CPU Profile 16 Threads: +3.26%
- CPU Profile Max Threads: +4.20%

While the performance uplift after Curve Optimizing is not earth-shattering, it’s nice to see we have achieved better performance across the board. We see the highest performance improvement of +8.50% in AI Benchmark.
When running Prime 95 Small FFTs with AVX-512 enabled, the average CPU effective clock is 5040 MHz with 1.141 volts. The average CPU temperature is 95.3 degrees Celsius. The ambient and water temperature is 25.7 and 36.0 degrees Celsius. The average CPU package power is 205.8 watts.

When running Prime 95 Small FFTs with AVX disabled, the average CPU effective clock is 5148 MHz with 1.200 volts. The average CPU temperature is 95.3 degrees Celsius. The ambient and water temperature is 25.1 and 34.8 degrees Celsius. The average CPU package power is 202.1 watts.

OC Strategy #4: PB Supercharged with ECLK
In our fourth overclocking strategy, we take advantage of the return of the ECLK mode. ECLK stands for external clock and is precisely what the term suggests: an external clock generator. It was previously available on Ryzen 2000 Pinnacle Ridge processors but was removed afterward.
Raphael ECLK Overview
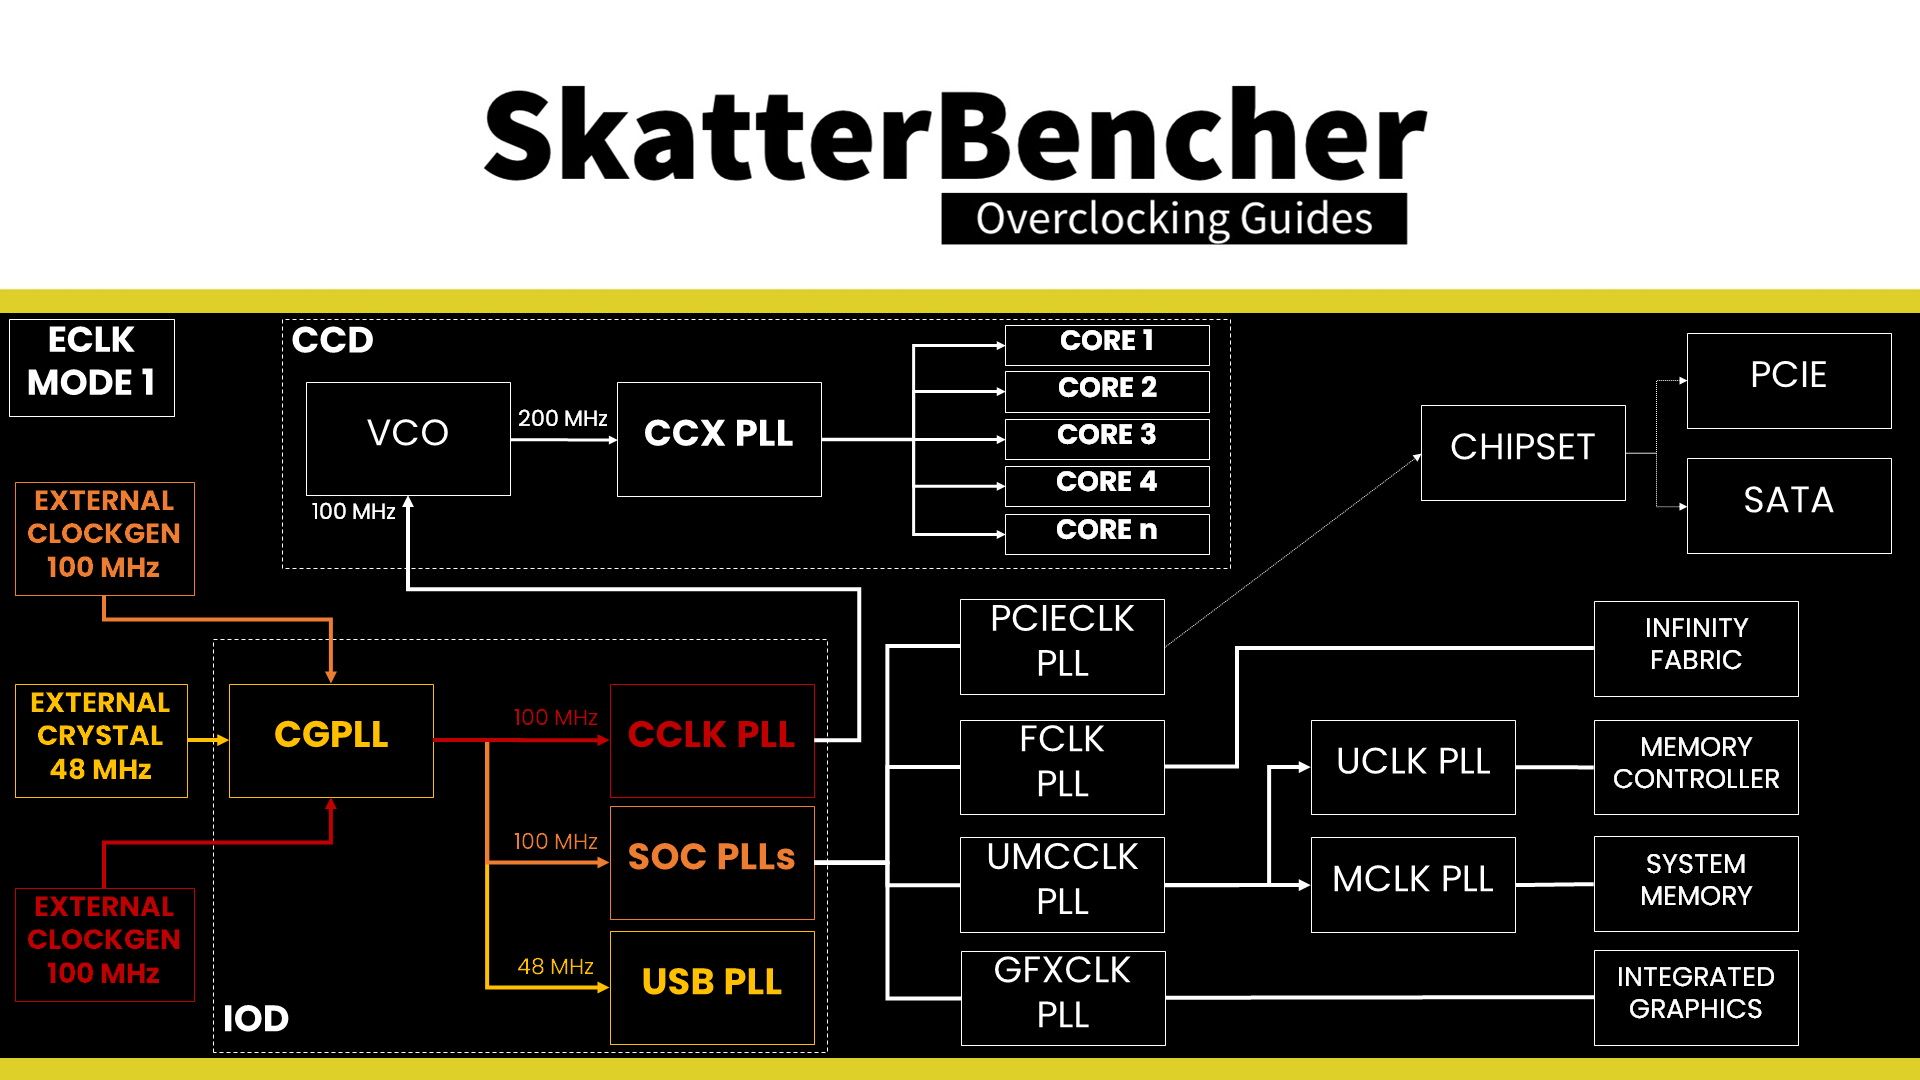
The standard Raphael platform has a 48 MHz crystal input to the integrated CGPLL clock generator. The CGPLL then generates a 48 MHz clock for the USB PLL and a 100 MHz reference clock for the FCH, which contains the CCLK PLL for the CPU cores and several SOC PLLs.
The external clocks are inputs to the FCH. There you can configure how you want to use the external clocks. In addition to the standard internal CGPLL, Raphael supports up to two external clock modes. They’re called eCLK0 Mode and eCLK1 Mode.
In eCLK0 Mode, an external 100MHz reference clock is used for both the CPU and SOC PLLs. In other words, it’s a reference clock that affects the CPU core clocks and the PCIe and SATA clocks. The USB PLL is still driven by the 48 MHz crystal via the CGPLL.
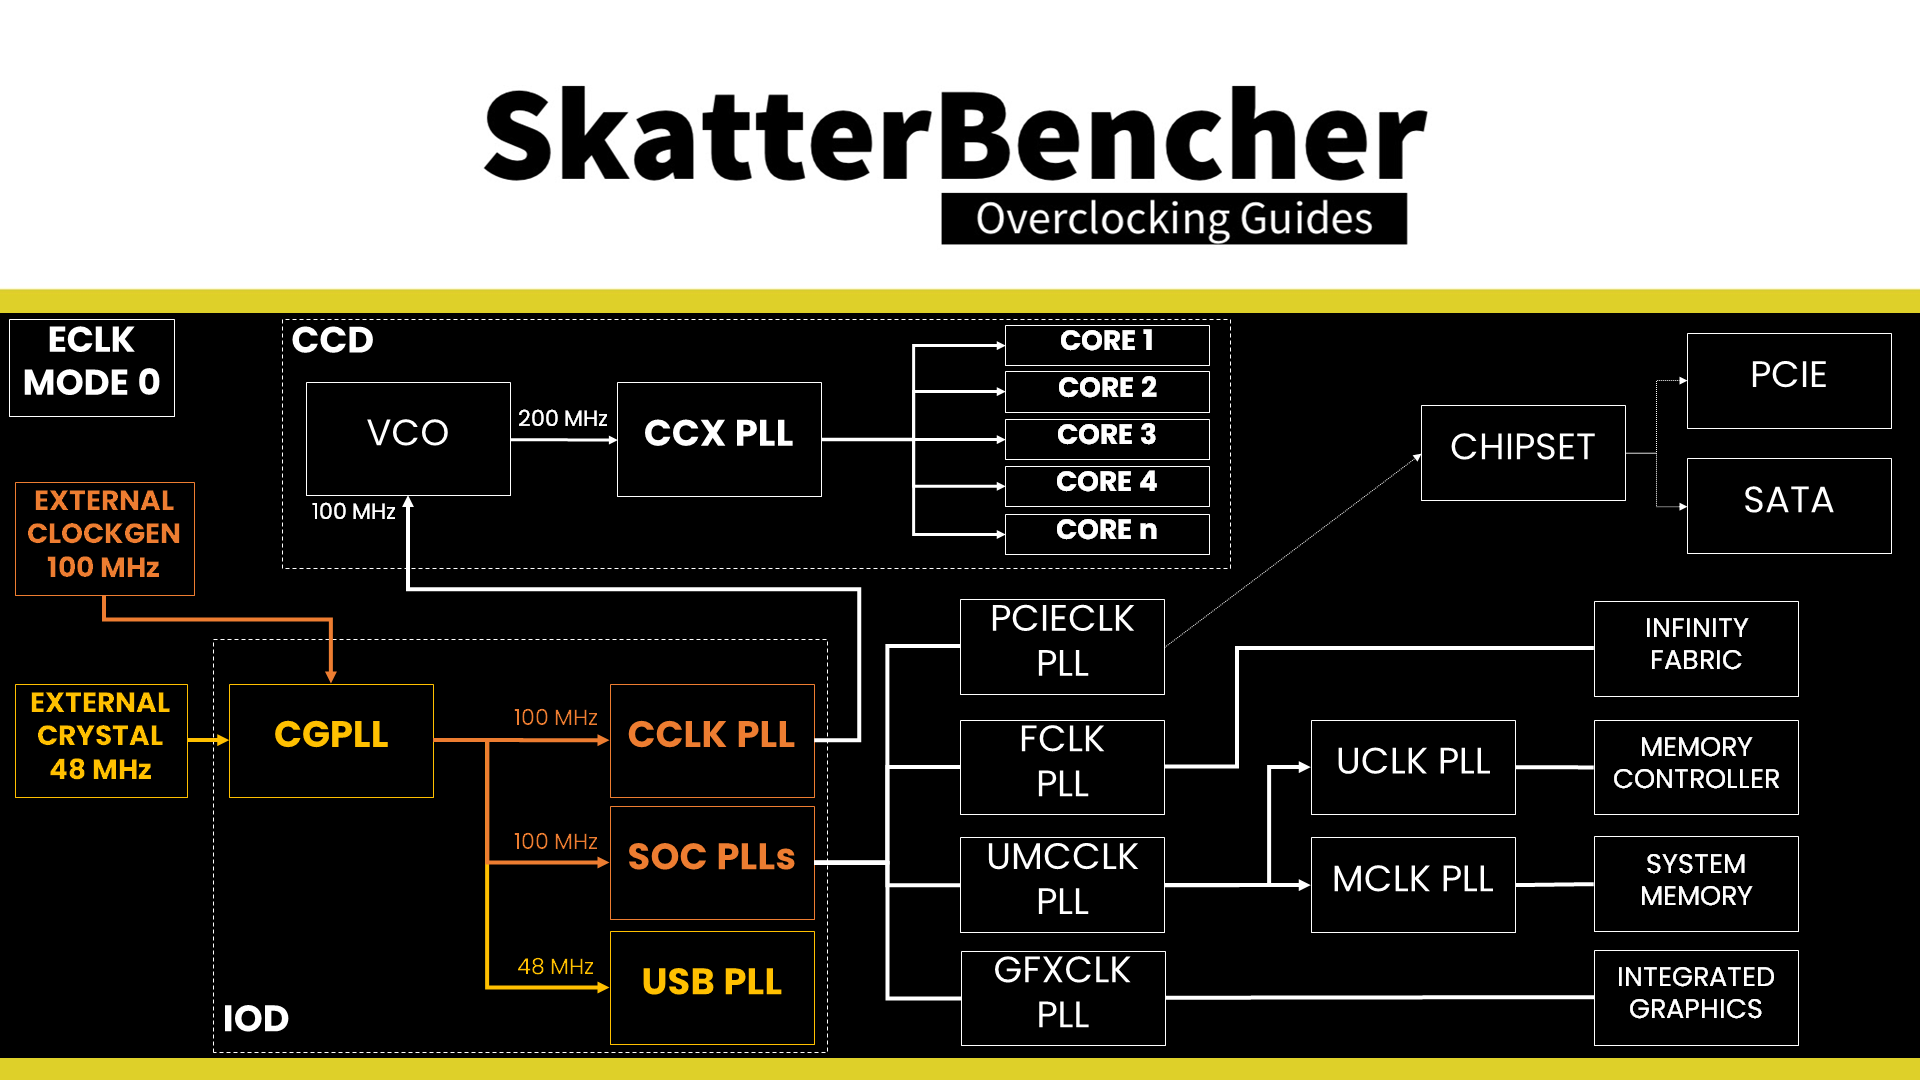
In eCLK1 Mode, there are two distinct external 100MHz reference clocks. One clock provides the 100MHz input for the CPU PLL, and another provides the 100MHz reference clock for the SOC PLLs. AMD suggests up to 140 MHz can be expected for the CPU core reference clock, but your mileage may vary. The USB PLL is still driven by the 48 MHz crystal via the CGPLL.
In previous SkatterBencher blogs, I referred to the technique of overclocking the reference clock as “supercharging PBO.” Unlike previous Ryzen CPUs, reference clock overclocking is very well supported and provides a viable path to overclocking.
The overclocking strategy with ECLK is the polar opposite of what we’re used to with Ryzen CPUs. As shown in OC Strategy #3, Ryzen overclocking is typically done with a negative curve optimizer. That pushes the Precision Boost algorithm to reach higher boost frequencies.

With ECLK, we still build on the factory-fused VFT curve but adjust the frequency by adjusting the reference clock. For example, if the Precision Boost has a VFT point for 5000 MHz at 1.15V at 50C, with an ECLK of 105 MHz, the actual point will be 5250 MHz at 1.15V at 50C.
Obviously, the default voltage for this VFT point won’t suffice for stable operation. So, counter-intuitively, we use a positive curve optimizer to increase the voltages of the VFT point. For example, a +30 curve optimizer may increase the voltage by 150mV. Thus, the resulting VFT point will be 5250 MHz at 1.25V at 50C.
Suppose Curve Optimizer doesn’t provide you with sufficient additional voltage. In that case, you can always add a voltage offset via the VRM controller configuration.
One more important point: ECLK also affects the maximum frequency ceiling. With an ECLK of 105 MHz, the new programmed Fmax for the 7900X is 5700 MHz x 1.05 = 5985 MHz. That’s way too high for this CPU. Luckily, we can use a negative Fmax boost override to fix this.

Ryzen 9 7900X ECLK Tuning Process
The manual tuning process for eCLK tuning can become quite convoluted since it affects the CPU core stability in all scenarios ranging from very light single-threaded workloads to heavy all-core workloads.
My ECLK tuning process for this Ryzen 9 7900X was as follows.
First, I use a broad tuning approach to get a big-picture understanding of the tuning opportunity. Then, I narrow down the per-core curve optimizer settings to achieve stability in a light workload. Then, I verify the stability in all-core multi-threaded workloads. Lastly, I run through all my benchmarks to validate stability in a wide range of test scenarios.
The broad tuning process includes:
- Using Shamino’s Boost Curve tool to track the average frequency across an increasing amount of active threads
- Gradually increasing the ECLK frequency until the point of instability
- In case of instability, reduce the programmed Fmax by configuring a negative boost override
The narrow tuning process includes:
- Using SuperPI 32M with affinity to a specific thread to check the maximum effective clock frequency
- Gradually reduce the negative Fmax Boost Override in case the boost frequency is hitting the frequency ceiling
- In case of instability, set a positive per-core curve optimizer
The all-core stability process includes running Prime 95 Small FFTs with both AVX-512 enabled and disabled.
The benchmark validation process includes completing all the benchmarks I’ve included in this guide. If a benchmark is unstable, I increase every core’s per-core curve optimizer value by 2 until I reach stability.

In my case, I used an ECLK of 105 MHz, a Fmax boost override of -75, and a per-core Curve Optimizer ranging from +1 on Core 1 to +21 on Cores 0, 2, 3, 4, and 5. I will show you the BIOS configuration in a minute. First, note that these settings, especially the curve optimizer, are CPU-specific, and the optimal values of your CPU may differ substantially.

The following table shows the boost profile for this specific CPU.


We can make a couple of interesting observations.
While tuning with eCLK provides, generally speaking, higher boost frequencies than tuning exclusively with Curve Optimizer, the maximum boost frequencies are not that far apart.
Overall, the eCLK strategy typically provides an avenue to slightly higher frequencies at the cost of slightly higher voltages. While this offers better performance in light workloads, the higher voltages will push the CPU quicker to the thermal limit. Thus, in heavy workloads, strictly using the Curve Optimizer tool for undervolting yields slightly better results.
It is nice that our best core can achieve a 5.9 GHz effective clock in a light workload like SuperPI 32M. In fact, this CPU can even boost to 6 GHz with slightly more aggressive voltages. I’ll show you the BIOS settings in video on my YouTube channel.

BIOS Settings & Benchmark Results
Upon entering the BIOS
- Go to the Extreme Tweaker menu
- Set Ai Overclock Tuner to EXPO II
- Set eCLK Mode to Asynchronous Mode
- Set BCLK2 Frequency to 105
- Set Memory Frequency to DDR5-6000MHz
- Enter the DRAM Timing Control submenu
- Set Memory Context Restore to Disabled
- Leave the DRAM Timing Control submenu
- Enter the Precision Boost Overdrive submenu
- Set Precision Boost Overdrive to Enabled
- Set CPU Boost Clock Override to Enabled (Negative)
- Set Max CPU Boost Clock Override to 75
- Enter the Curve Optimizer submenu
- Set Curve Optimizer to Per Core
- For every core, set Curve Optimizer Sign to Positive
- For Cores 0, 2, 3, 4, and 5, set Curve Optimizer Magnitude to 21
- For Core 1, set Curve Optimizer Magnitude to 1
- For Cores 6, 7, 8, 10, and 11, set Curve Optimizer Magnitude to 3
- For Core 9, set Curve Optimizer Magnitude to 6
Then save and exit the BIOS.
We re-ran the benchmarks and checked the performance increase compared to the default operation.
- SuperPI 4M: +3.09%
- Geekbench 5 (single): +2.58%
- Geekbench 5 (multi): +8.64%
- Cinebench R23 Single: +1.77%
- Cinebench R23 Multi: +5.27%
- CPU-Z V17.01.64 Single: +3.63%
- CPU-Z V17.01.64 Multi: +2.67%
- V-Ray 5: +5.84%
- AI Benchmark: +8.65%
- 3DMark Night Raid: +3.71%
- CS:GO FPS Bench: +2.58%
- Tomb Raider: +1.50%
- Final Fantasy XV: +2.21%

Here are the 3DMark CPU Profile scores
- CPU Profile 1 Thread: +2.75%
- CPU Profile 2 Threads: +4.54%
- CPU Profile 4 Threads: +2.69%
- CPU Profile 8 Threads: +2.87%
- CPU Profile 16 Threads: +3.310%
- CPU Profile Max Threads: +4.40%

As the maximum boost frequencies have substantially increased from the stock values, we can see a performance uplift across the board. Even in single-threaded benchmarks, we see a performance improvement. The highest performance uplift is +8.65% in AI Benchmark.
When running Prime 95 Small FFTs with AVX-512 enabled, the average CPU effective clock is 4949 MHz with 1.165 volts. The average CPU temperature is 95.3 degrees Celsius. The ambient and water temperature is 25.7 and 34.6 degrees Celsius. The average CPU package power is 214.6 watts.

When running Prime 95 Small FFTs with AVX disabled, the average CPU effective clock is 5081 MHz with 1.213 volts. The average CPU temperature is 95.3 degrees Celsius. The ambient and water temperature is 25.5 and 34.4 degrees Celsius. The average CPU package power is 207.3 watts.

OC Strategy #5: Manual Overclock
In our fifth overclocking strategy, we will pursue a manual overclock.
One could question the use-case for manual overclocking an AMD Ryzen CPU. Just like with all past Ryzen processors, the major downside of manual overclocking is that you lose the benefits of Precision Boost technology in low-threaded benchmark applications. So, whereas this 7900X can boost up to 5600 MHz with Precision Boost, it will be limited to your set fixed frequency when manually overclocking.
However, manual overclocking is not all negative and even has some benefits.
First, automatic overclocking and frequency boosting technologies leave a little margin on the table. We can exploit this margin and finetune for application stability when manually overclocking with our specific hardware configuration.
Second, in multi-threaded applications, Precision Boost Overdrive applies a single frequency to every core. However, on AMD Ryzen CPUs, you can set the frequency for each CCX separately. So, we can exploit the fact that some CCXs may overclock better than others. This last point is particularly relevant for the 7900X.
Thirdly, by setting a fixed voltage, we avoid the CPU dynamically and rapidly updating its VID requests to the VRM controller. This alleviates stress on the VRM and typically yields lower temperatures.

To better understand the performance tuning opportunities embedded in the Ryzen 9 7900X processor, let’s look at its topology in more detail.
CPU Core Clocking Topology
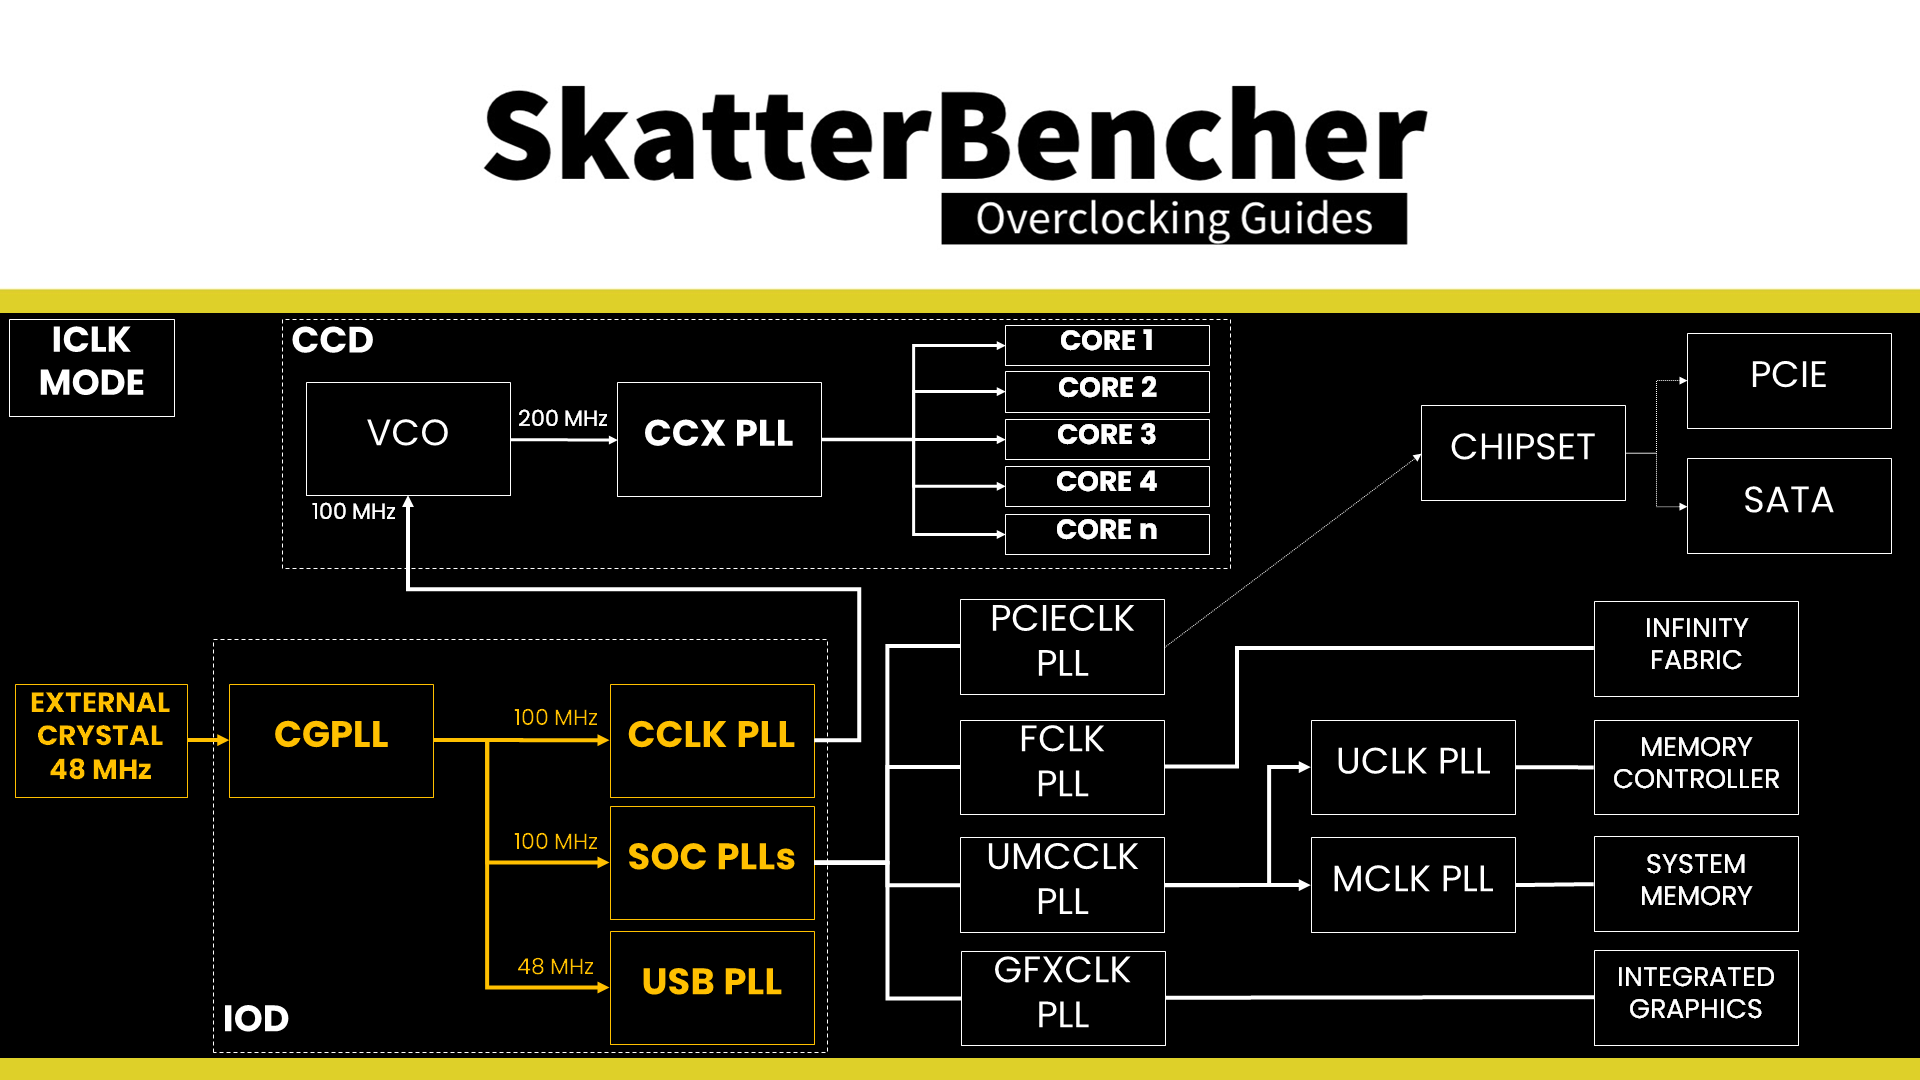
The clocking of AMD Raphael is similar to the previous generation of Zen 3 Vermeer desktop CPUs.
The standard Raphael platform has a 48 MHz crystal input to the integrated CGPLL clock generator. The CGPLL then generates a 48 MHz clock for the USB PLL and a 100 MHz reference clock for the FCH, which contains the CCLK PLL for the CPU cores and several SOC PLLs.
The CCLK PLL 100MHz reference clock drives the 200 MHz VCO, which is then multiplied by an FID and divided by a DID. As a whole, this provides CPU clock frequency granularity of 25 MHz.
As with Vermeer, each CCX has its own PLL, with the cores within that CCX running at the same frequency. In a typical operation, all cores within a CCX will run at the same frequency. The effective clock will differ if the core is in a different P-state.
The SOC PLLs include a wide range of PLLs present on the IO die. The ones most relevant for overclocking are:
- FCLK for the data fabric
- UCLK for the memory controller
- MCLK for the system memory
- GFXCLK for the integrated graphics
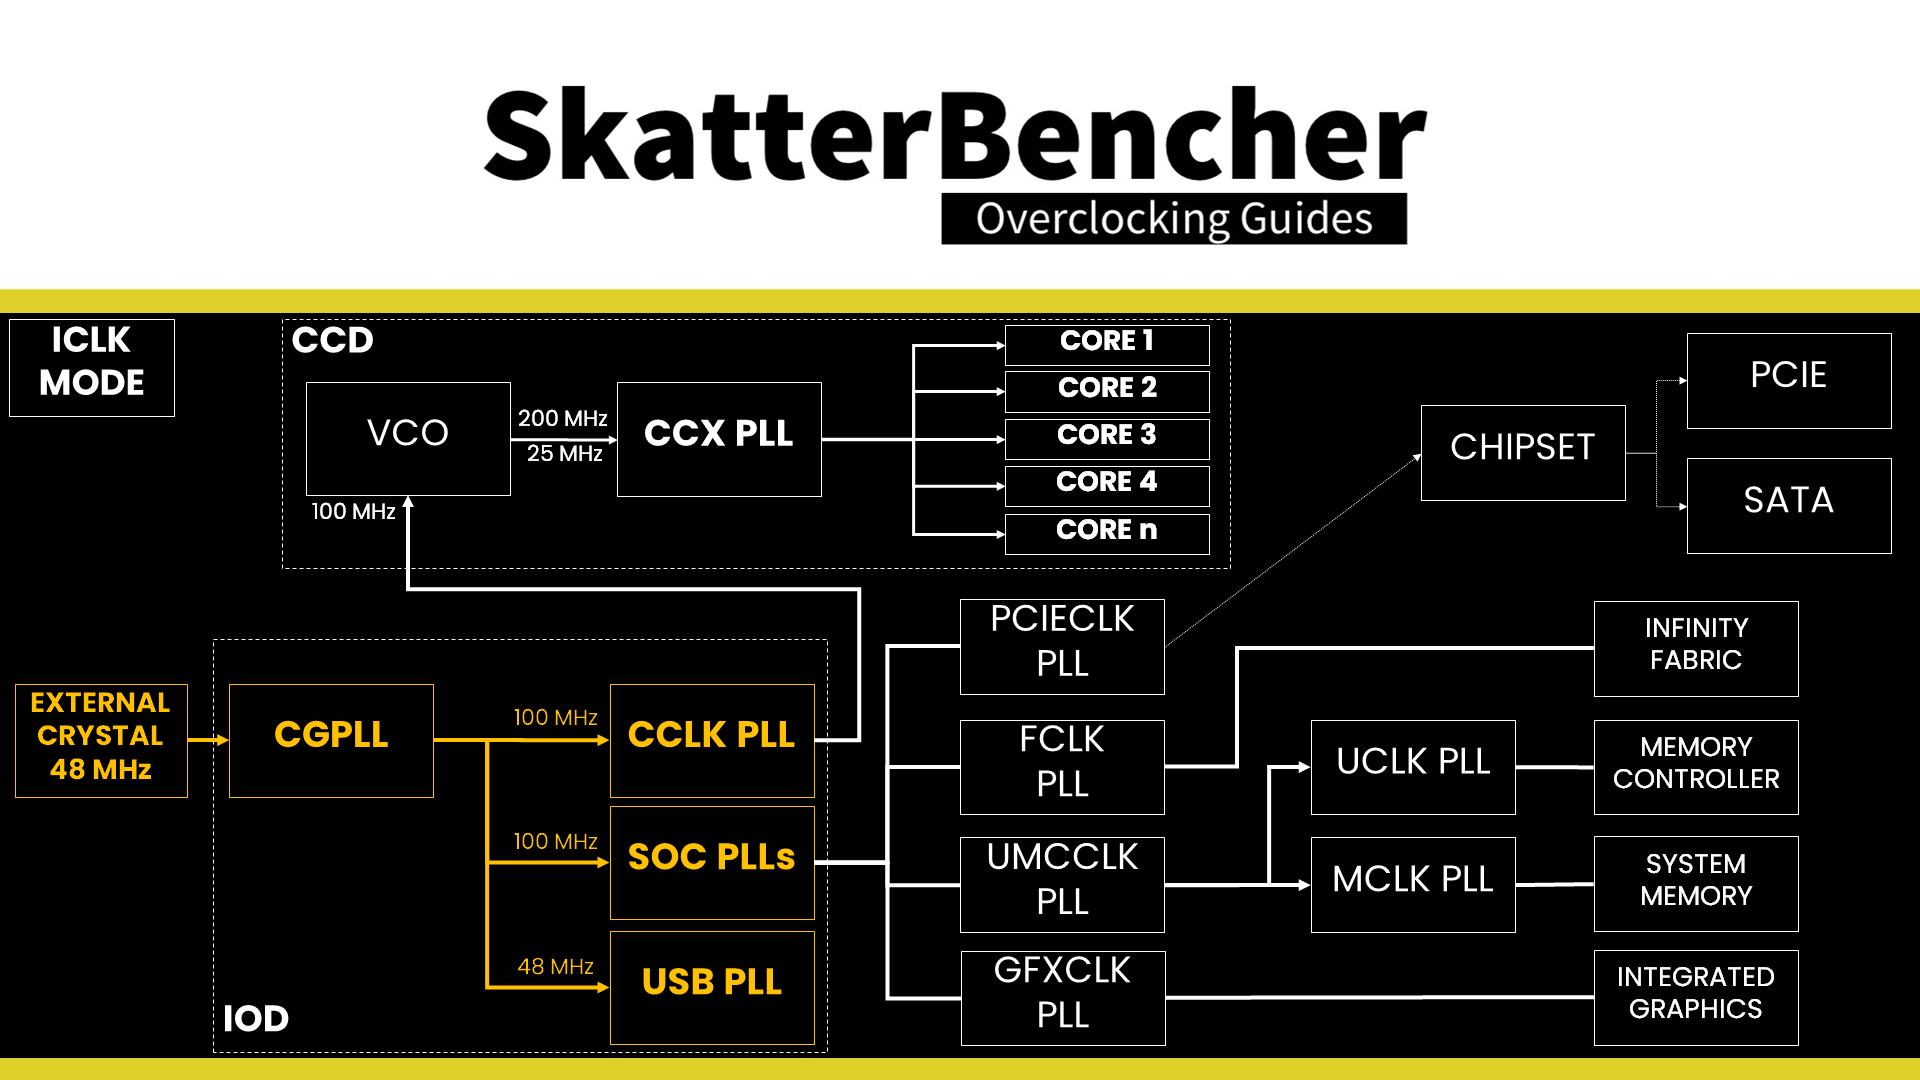
The SOC PLLs are not particularly relevant for manual CPU Core overclocking.
As I mentioned in OC Strategy #4, in addition to the standard internal CGPLL, Raphael supports up to two external clock modes. We won’t be using Eclk in this overclocking strategy.
CPU Core Voltage Topology
From the voltage topology perspective, there are a few minor changes. Like Vermeer, the processor still relies on an internal and external power supply to generate the processor voltages.
There are four primary power supplies from the motherboard VRM to the processor: VDDCR, VDDCR_SOC, VDDCR_MISC, and VDDIO_MEM_S3. I have covered the details extensively in my Raphael overclocking launch video.
The VDDCR voltage rail provides the external power for two internal voltage regulators: VDDCR_CPU and VDDCR_VDDM.
VDDCR_CPU provides the voltage for the CPU cores in CCX. On CPUs with multiple CCXs, each CCX has its own VDDCR_CPU voltage rail, but the voltage will be identical. The voltage rails can work in either regular or bypass mode, but on Raphael, it is always in bypass mode. That means the voltage is always equal to the VDDCR external voltage.
VDDCR_VDDM provides the voltage for the L2, L3, and, if present, 3D V-Cache on a CCX. On CPUs where there are multiple CCXs, each CCX has its own VDDCR_VDDM voltage rail. This rail cannot work in bypass mode; therefore, it is internally regulated from the VDDCR external voltage rail. The default VDDM voltage is 0.95V
The VDDCR voltage rail can be directly controlled via the SVI3 interface. VDDCR_VDDM cannot be controlled by the end-user.

Choosing the proper manual voltage is always a matter of finding a suitable trade-off between increased overclocking potential, the thermal challenges that come with increased voltage, and of course, consideration of CPU lifespan.
Ryzen 9 7900X CCX Frequency Tuning Process
With that last thought, we kick off our manual overclocking process.
Our limiting factor will ultimately be the cooling solution as power consumption increases exponentially with operating voltage and temperature scales (somewhat) linearly with power consumption.
The maximum voltage will be determined by the application we’re tuning for. So, the first step in our tuning process would be deciding on the stress test representing our worst-case scenario. In this case, I picked Prime95 Small FFTs with AVX disabled.
The next step is to set a fixed CPU ratio and check the maximum temperature when running our workload. If there’s thermal headroom left, increase the operating voltage.
Once we know the maximum voltage, we can tune the CCX ratio. Simply increase the CPU ratio until the application shows instability, then back off. This approach will give you the maximum stable per-CCX frequency for a given voltage.
In our case, we end up with a CPU ratio of 54.25X for CCD0, 52.50X for CCD1, and a Core VID of 1.25V. Under our worst-case stress test, this yields a CPU voltage of 1.162V and a CPU temperature of 88 degrees Celsius.

BIOS Settings & Benchmark Results
Upon entering the BIOS
- Go to the Extreme Tweaker menu
- Set Ai Overclock Tuner to EXPO II
- Set Memory Frequency to DDR5-6000MHz
- Enter the CPU Core Ratio (Per CCX) submenu
- Set Core VID to 1.250
- Set CCX0 Ratio to 54.25
- Set CCX0 Ratio to 52.50
- Enter the DRAM Timing Control submenu
- Set Memory Context Restore to Disabled
- Leave the DRAM Timing Control submenu
Then save and exit the BIOS.
We re-ran the benchmarks and checked the performance increase compared to the default operation.
- SuperPI 4M: -4.15%
- Geekbench 5 (single): -3.21%
- Geekbench 5 (multi): +7.75%
- Cinebench R23 Single: -3.83%
- Cinebench R23 Multi: +8.30%
- CPU-Z V17.01.64 Single: -4.31%
- CPU-Z V17.01.64 Multi: +2.96%
- V-Ray 5: +6.67%
- AI Benchmark: +7.66%
- 3DMark Night Raid: +2.41%
- CS:GO FPS Bench: +0.65%
- Tomb Raider: +1.50%
- Final Fantasy XV: +1.16%

Here are the 3DMark CPU Profile scores
- CPU Profile 1 Thread: -3.28%
- CPU Profile 2 Threads: -2.31%
- CPU Profile 4 Threads: -0.64%
- CPU Profile 8 Threads: +2.16%
- CPU Profile 16 Threads: +2.45%
- CPU Profile Max Threads: +3.94%

As expected, we see a performance deficit against stock performance in single-threaded applications as manual overclocking doesn’t benefit from the Precision Boost 1T frequency. In multi-threaded applications, however, we see a nice performance uplift up to +8.30% in AI Benchmark.
When running Prime 95 Small FFTs with AVX-512 enabled, unfortunately, the CPU is not stable. This is a deliberate choice on our side as we decided that Prime95 with AVX512 enabled is not a representative worst-case workload for our system.
When running Prime 95 Small FFTs with AVX disabled, the average CPU effective clock is 5334 MHz with 1.162 volts. The average CPU temperature is 88.0 degrees Celsius. The ambient and water temperature is 24.8 and 34.1 degrees Celsius. The average CPU package power is 203.9 watts.

AMD Ryzen 9 7900X: Conclusion
Alright, let us wrap this up.
Overall, I very much enjoyed overclocking the Ryzen 9 7900X for a couple of reasons:
Firstly, achieving a 5.9 GHz maximum boost frequency for one core is very cool. I would’ve never imagined this being possible on an AMD Ryzen CPU. Albeit not 24/7 stable, reaching 6 GHz with regular water cooling is also a significant milestone for me.
Secondly, it’s always cool when new avenues and strategies for overclocking open up. The re-introduction of eCLK mode provides a viable path for overclocking, as shown in this guide. While it’s not a straightforward best choice in all scenarios, it’s definitely an approach worth including in your tuning repertoire.
Usually, I would also include an overclocking strategy featuring ASUS Dynamic OC Switching. However, the all-core frequency achieved in medium workloads by tuning with eCLK matches our all-core maximum stable frequency in this case. Thus, there are no performance gains to be had by using DOS.
Anyway, that’s all for today!
I want to thank my Patreon supporters for supporting my work.
As per usual, if you have any questions or comments, feel free to drop them in the comment section below.
See you next time!