Making a Ryzen 9000 V/F Curve
Today, we’re putting together a Ryzen 9000 V/F Curve using the Ryzen 9 9950X3D dual-CCD “Granite Ridge” processor.
Ryzen 9000 V/F Curve: Introduction
Hello and welcome to CheckPoint, a blog series for talking about specific overclocking topics in a shorter format.
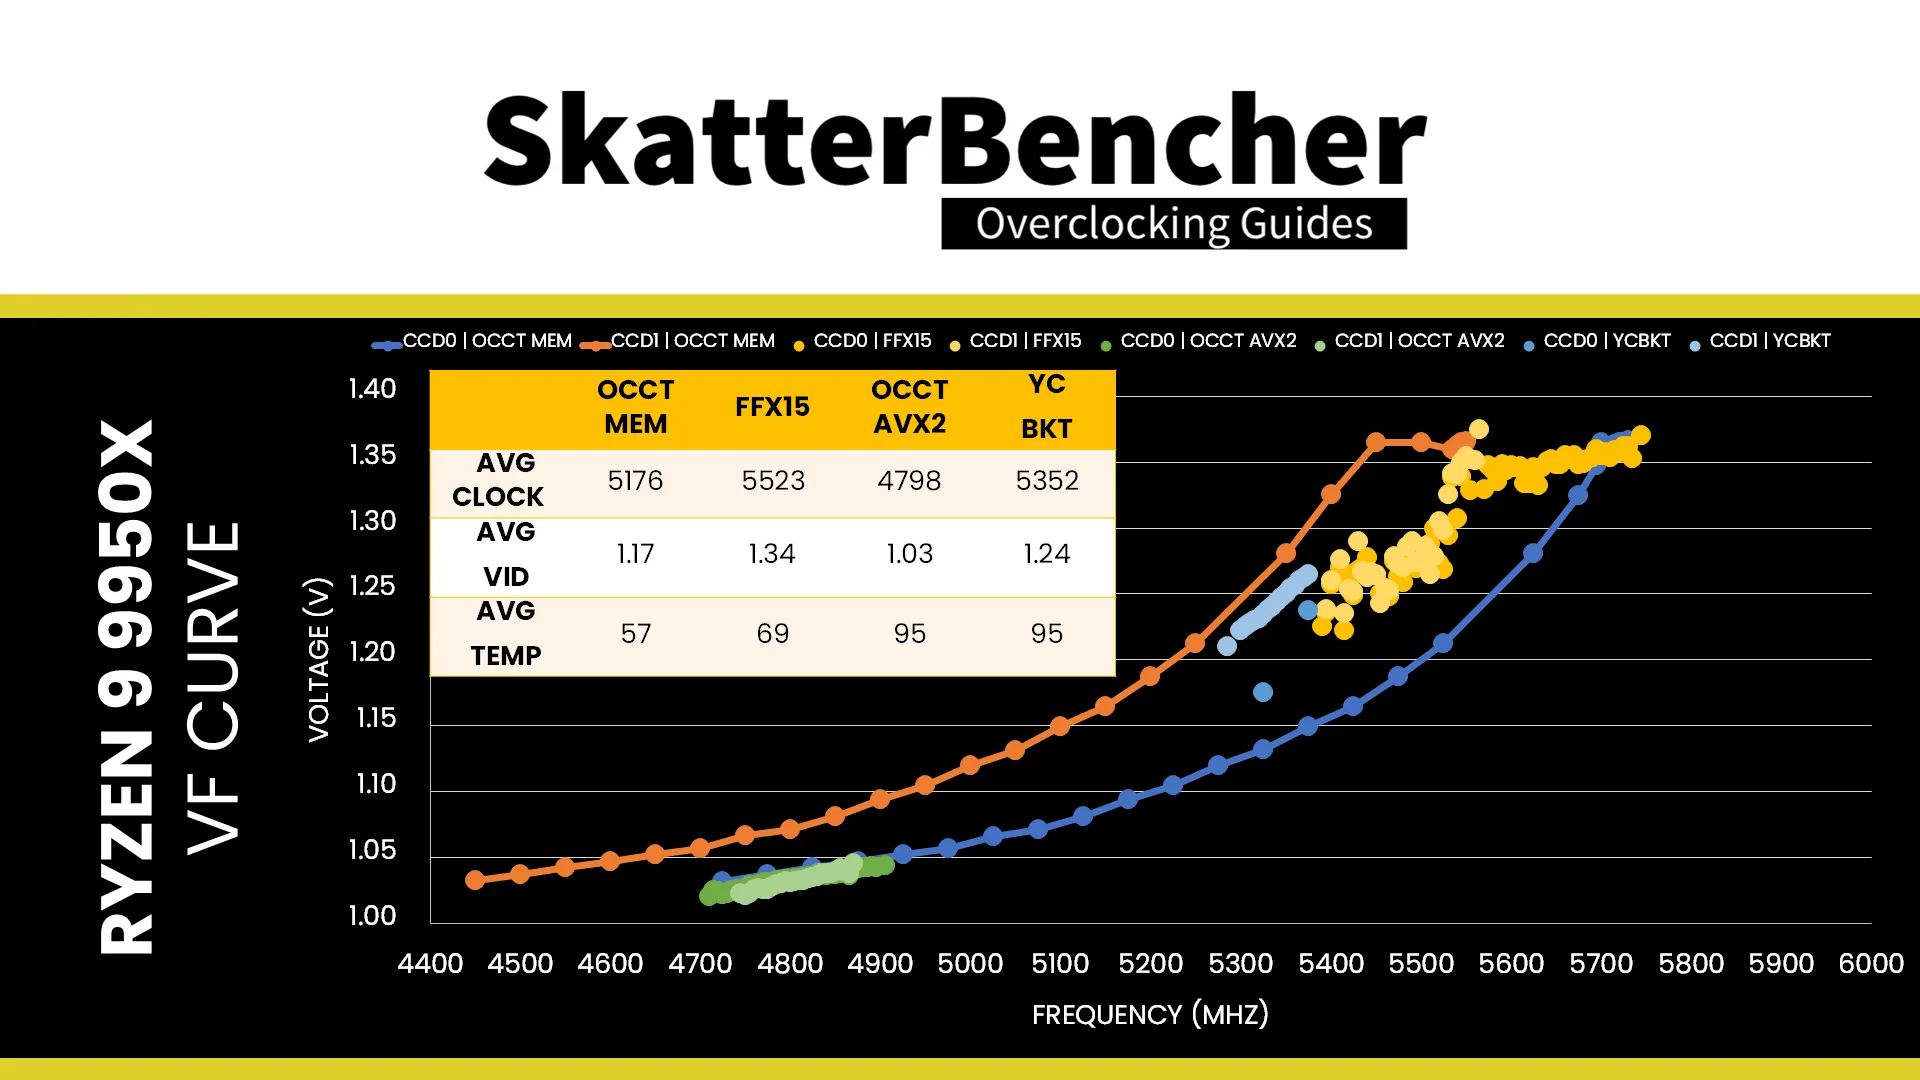
Today, I want to show you how I put together the Ryzen 9000 V/F curves I’ve been using in all my SkatterBencher guides. These V/F curves are not only useful to visualize the impact of tuning with Curve Optimizer and Curve Shaper, but they also help me better analyze instability when tuning the processor.
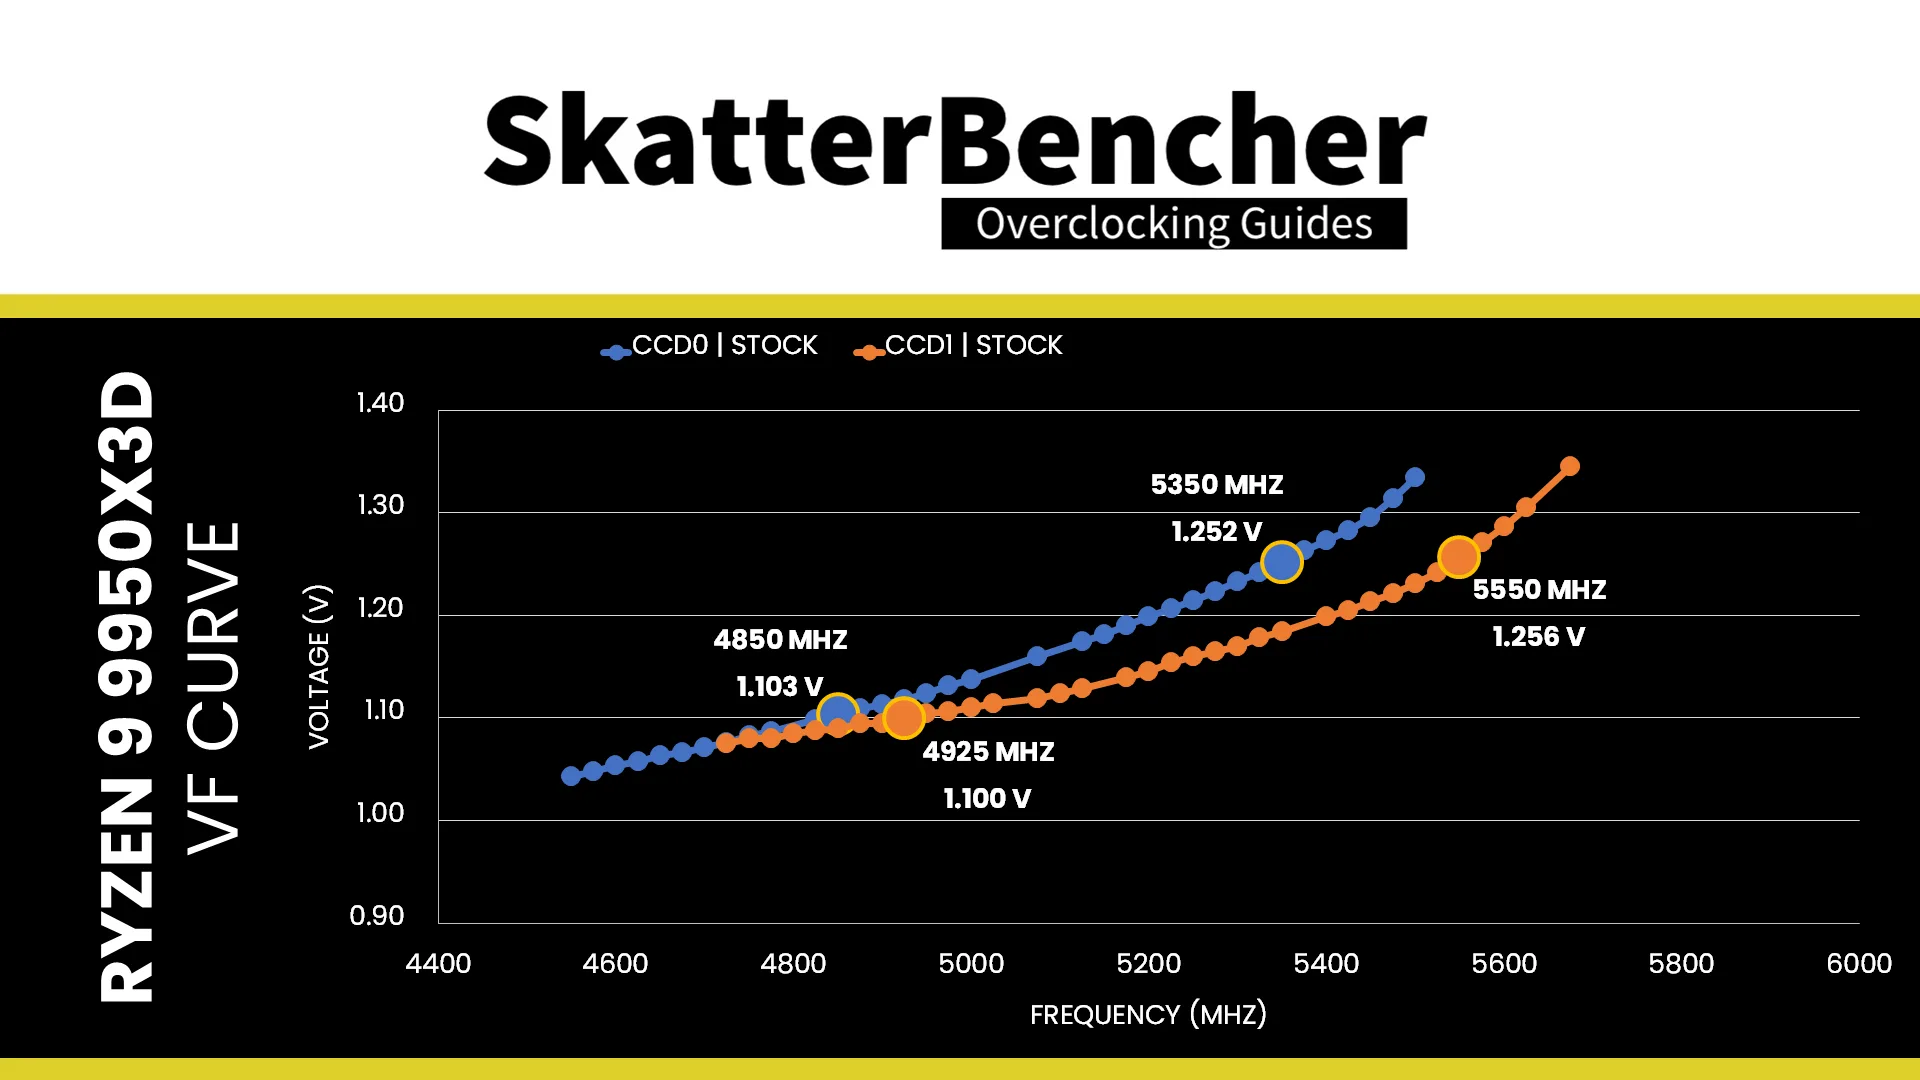
I will use the Ryzen 9 9950X3D as an example because it’s a dual-CCD processor with two distinctly different CCDs since CCD 0 has 3D V-Cache and CCD1 is the highest binned available for Ryzen 9000.
I will walk you through the entire process and provide some notes and tips along the way. By the end of the blog post, I hope you’ll be able to do this for your own processor as well. Let’s get started!
What’s a V/F Curve?
If you’ve watched several of my videos or any other overclocking guides, you should be familiar with the term V/F curve. In case you haven’t: a V/F curve describes the relationship between an operating frequency and the voltage required to operate at that frequency.
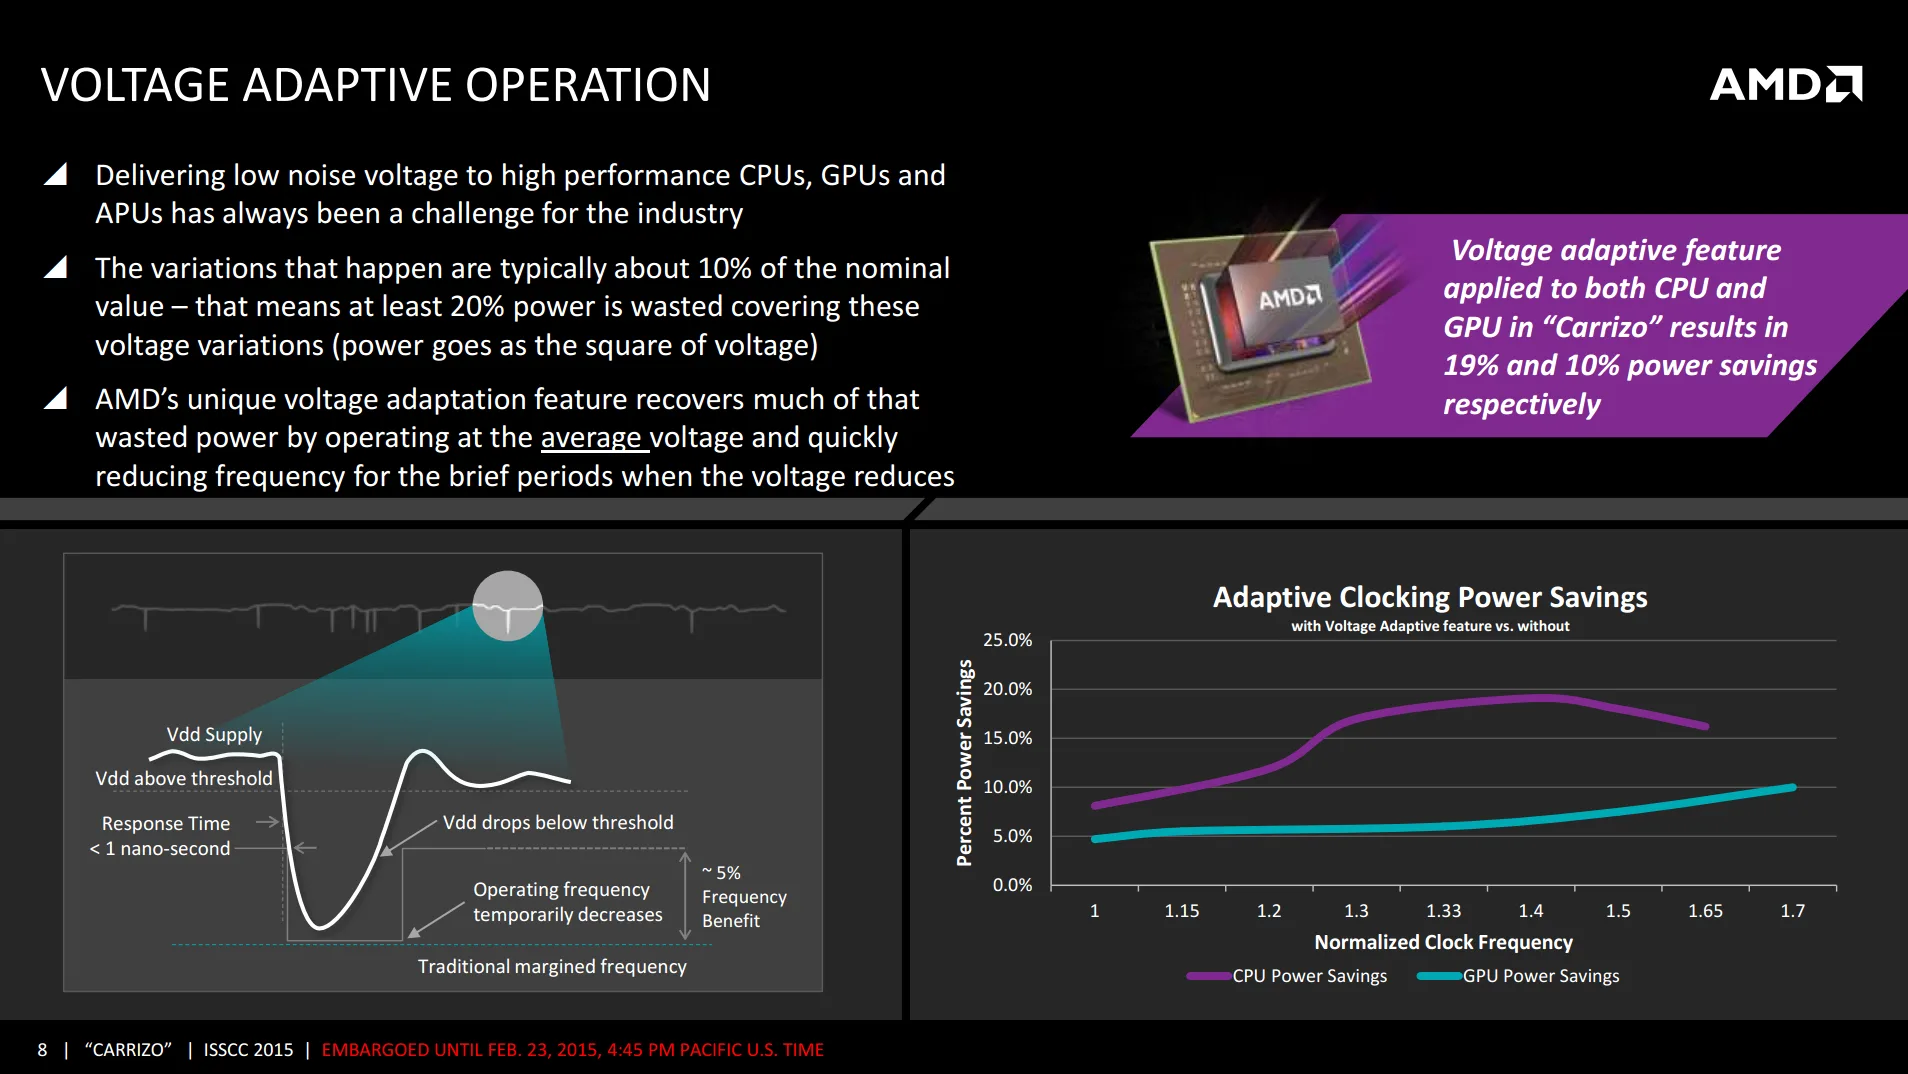
Pretty much every modern SoC has a voltage-frequency curve though some are more advanced than others. AMD in particular uses a combination of lookup tables and adaptive clocking to match an operating frequency with a suitable operating voltage. The “adaptive” nature of the AMD clocking technology – marketed under the banner Precision Boost 2 – makes it more difficult to get a grip on the CPU’s V/F curve.
The simplest way of looking at the V/F curve would, of course, be if AMD would expose a CPU’s VFT table via the BIOS or software tool. Unfortunately, a CPU’s V/F curve is a closely guarded trade secret for many reasons and, thus, we’re left with the observation method to figure out the V/F curve.
AMD Precision Boost 2 Technology
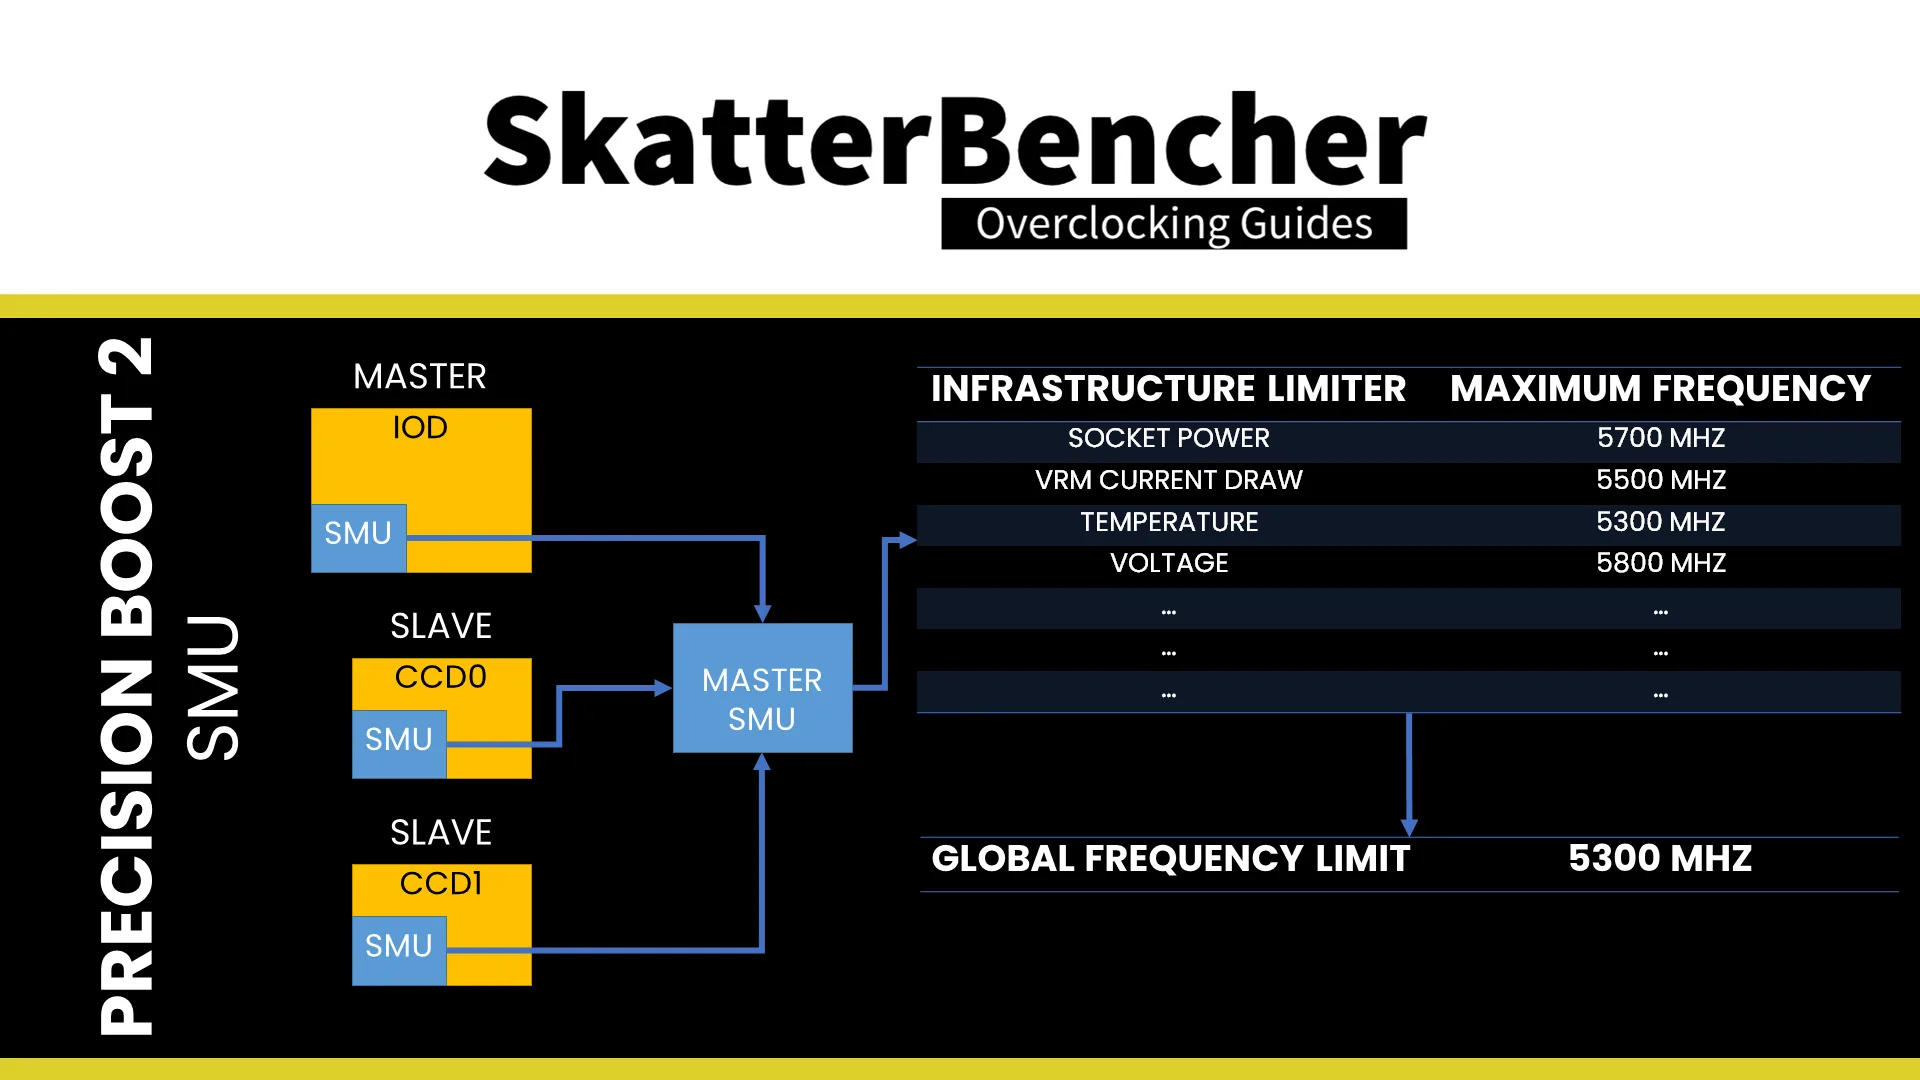
AMD Precision Boost 2 is a technology that opportunistically increases the CPU performance based on the CPU temperature, current, and power headroom. Its magic is performed by the SMU or System Management Unit.
Each chip on a Ryzen CPU has an SMU, meaning there are 3 SMUs on a Ryzen 9000 CPU with 2 CCDs and 1 IOD. One of those SMUs will work as Master SMU, while the others work as Slave SMUs.
The SMU has a range of capabilities, including, most importantly, the ability to manage the CPU performance within the so-called infrastructure constraints. The infrastructure restricts the maximum operating limits on various metrics, including power draw, temperature, and voltage. We don’t have a comprehensive, confirmed list of metrics, though some are exposed to the end-user via the Precision Boost Overdrive overclocker’s toolkit and other AMD BIOS menus.
The point of explaining all this is to highlight that, when we try to capture the CPU V/F curve, we need to think of all the various ways the frequency may be adjusted by the SMU.
The nature of the highly adaptive AMD Precision Boost 2 algorithm is that the CPU operating frequency bounces around all the time, rarely sitting at the same frequency for more than a couple of seconds. This makes it challenging to reliably derive the CPU’s V/F curve.
Another roadblock is the voltage topology of a Ryzen desktop processor as a single voltage plane powers the cores in both CCDs. That means the effective voltage is determined by the V/F curves of each CCD, so it’s not easy to isolate the curve of each CCD.
However, we can use certain tools to simplify the process.
Ryzen 9000 V/F Curve: Process
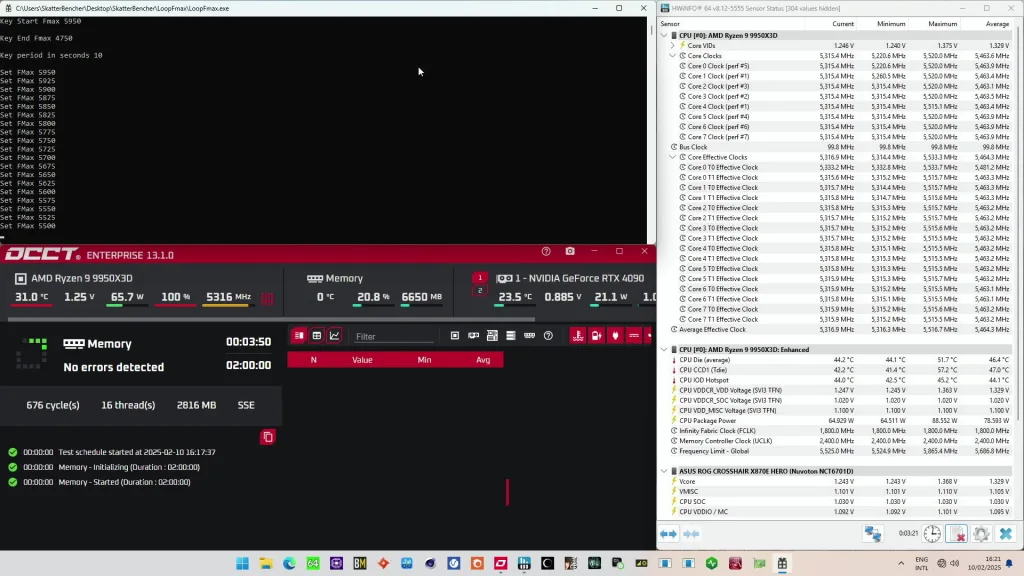
Now that we understand V/F curves and Precision Boost, let’s get down to actually putting together the V/F curves. To do this, I rely on four important tools: LoopFmax, OCCT, HWiNFO, and Excel.
Shamino’s LoopFmax is a small tool that lets you automatically decrease the configured Precision Boost maximum allowed frequency (or Fmax) between +200 and -1000 every time interval. I typically use intervals of 10 seconds as it’s a good tradeoff between gathering sufficient data points and the duration of the data gathering.
OCCT Memory Test is one of the stress tests available in the OCCT software package. It’s designed to test system memory stability but it’s a great tool for compiling the V/F curve because it’s a really light all-core workload. That means it doesn’t heat up the processor or use too much power while having all cores running at the maximum allowed frequency.
HWiNFO is my preferred tool for system telemetry and it offers a simple way to log the data. The data captured by HWiNFO is the foundation for eventually building the V/F curves.
Microsoft Excel is a tool everyone knows and needs no introduction. I’ll use this to clean up the data and build the charts.
Data Gathering
Gathering the data is a pretty simple process for single-CCD Ryzen processors but, as I mentioned earlier, it is a bit trickier with multi-CCD processors due to the shared core voltage rail. By that, I refer to the Ryzen 9000 CPUs having a single voltage rail that powers the cores in both CCDs.
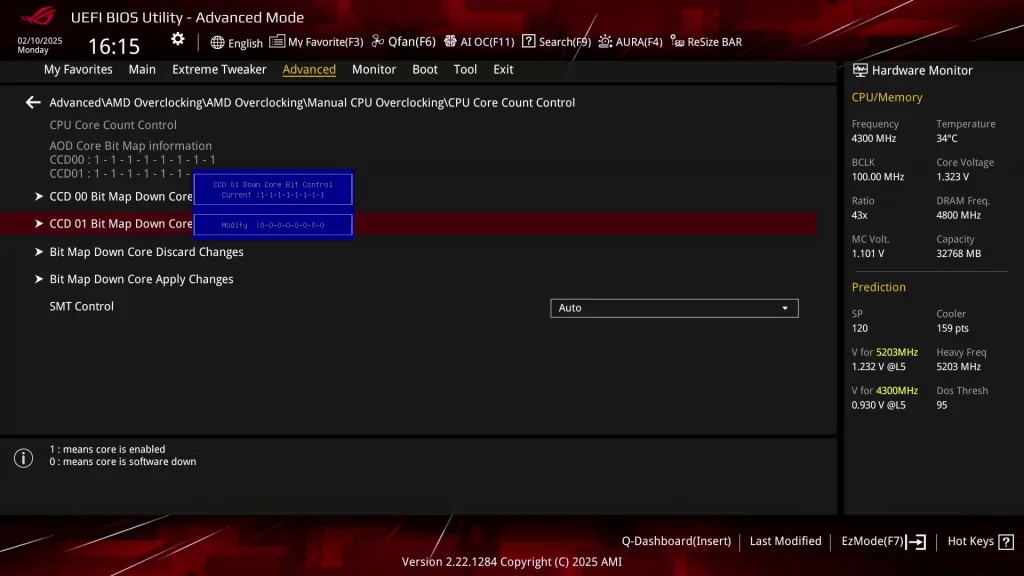
For the Ryzen 9 9950X3D, I want to isolate the V/F curve for each CCD. So, the first step is to go into the BIOS and disable the cores in the other CCD.
In the BIOS, go to the Advanced Menu and enter the AMD Overclocking submenu. Here, go into the Manual CPU Overclocking CPU Core Count Control submenu. If we want to only enable the 3D V-Cache CCD, we can go into the CCD 01 Bit Map Down Core Control submenu and modify all values to 0. Then, make sure to access Bit Map Down Core Apply Changes to save the configuration. This will cause the system to reboot.
In my experience, it’s always best to apply any Curve Optimizer settings after disabling the cores.
Now, we can go into the operating system and set up our system for V/F curve data capturing. Here’s what to pay attention to:
- OCCT Memory Test: set it to 10% and SSE instruction set to keep the load as low as possible.
- HWiNFO: make sure that all cores are loaded before starting logging as that will keep the data cleaner.
- LoopFmax: set Start Fmax to the default Fmax +200, End Fmax to the default Fmax minus 1000, and a reasonable interval period of 10 seconds.
Once all cores are loaded properly you can start the HWiNFO logging process and start the LoopFmax. Now it’s just a matter of waiting until the CPU has cycled through all Fmax steps.
Data Processing
Next, let’s open Excel and start processing the data. Here’s what we want to do:
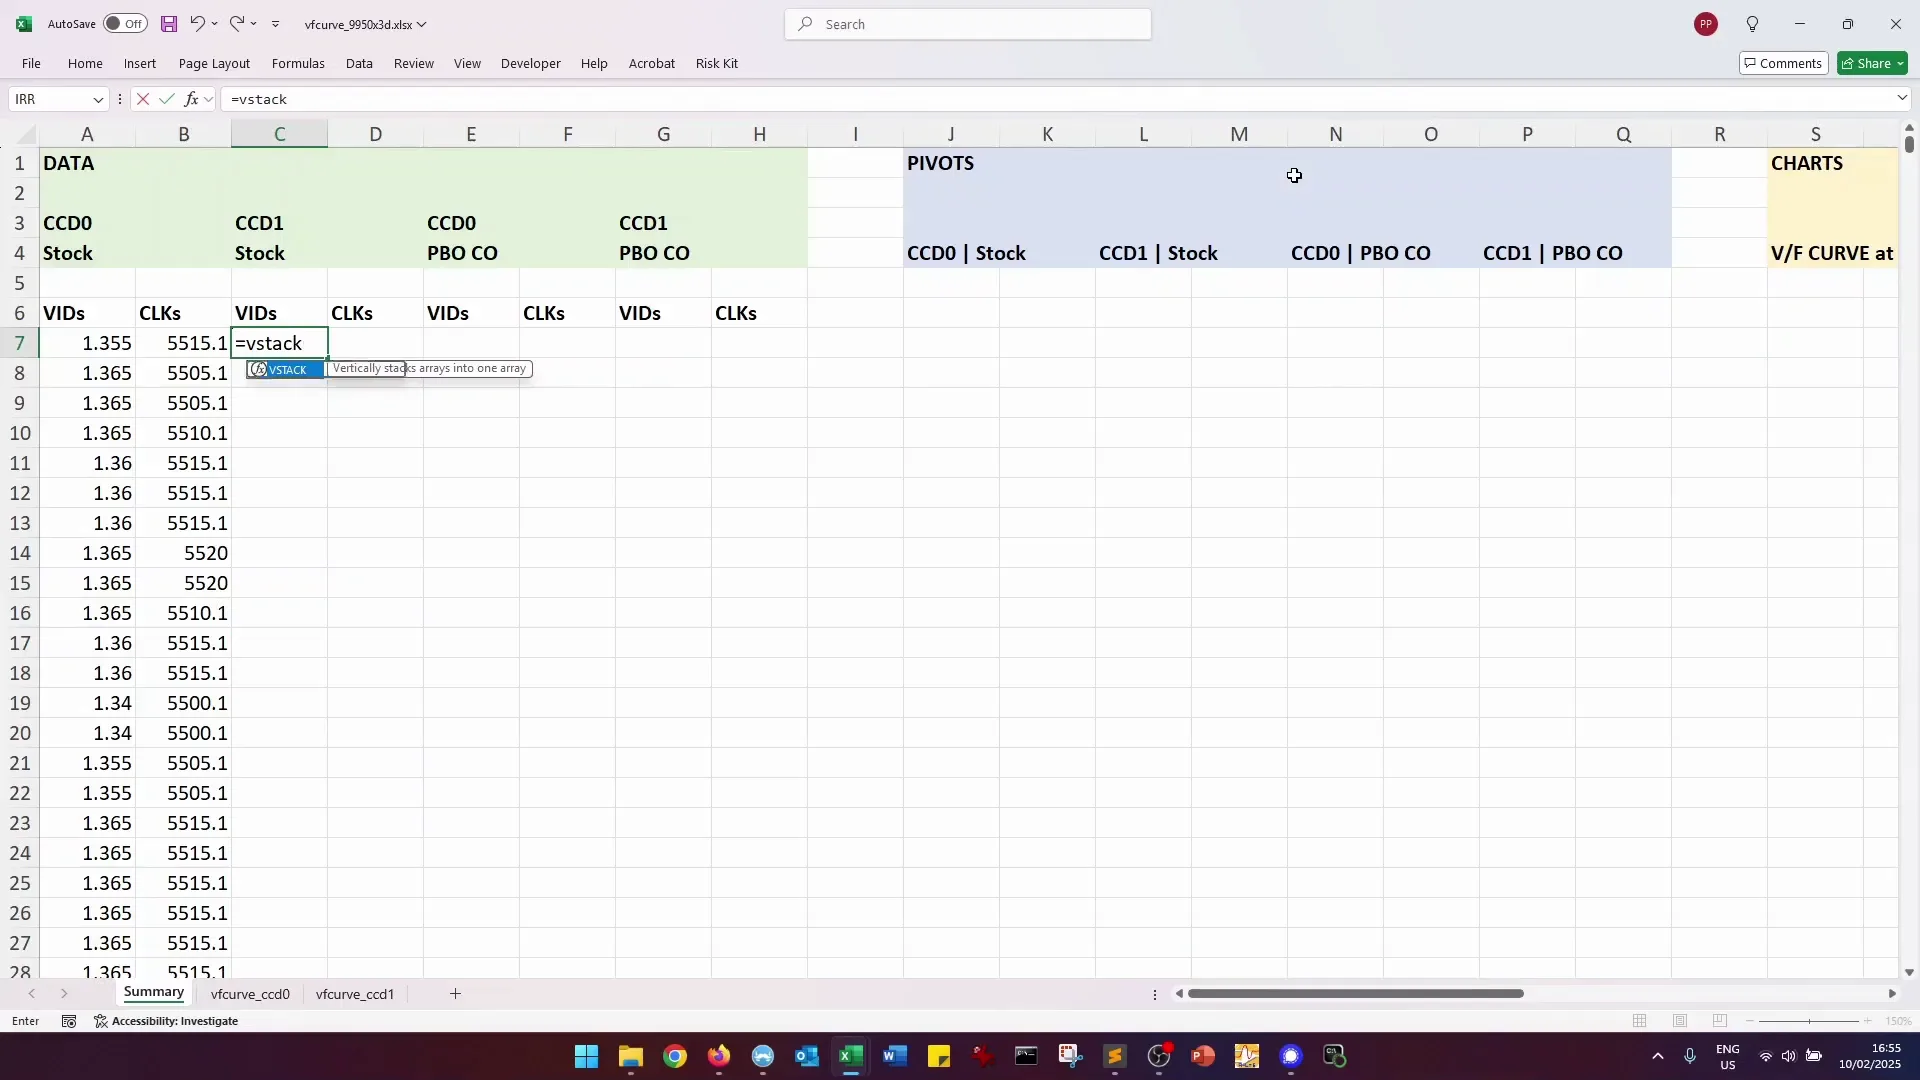
First, we want to isolate the voltage and frequency data. Since I’m building a general V/F curve for the entire CCD I will treat all data from each CPU core equally. So, I use the Excel VSTACK function to put all VID and Core Clock data in a long column.
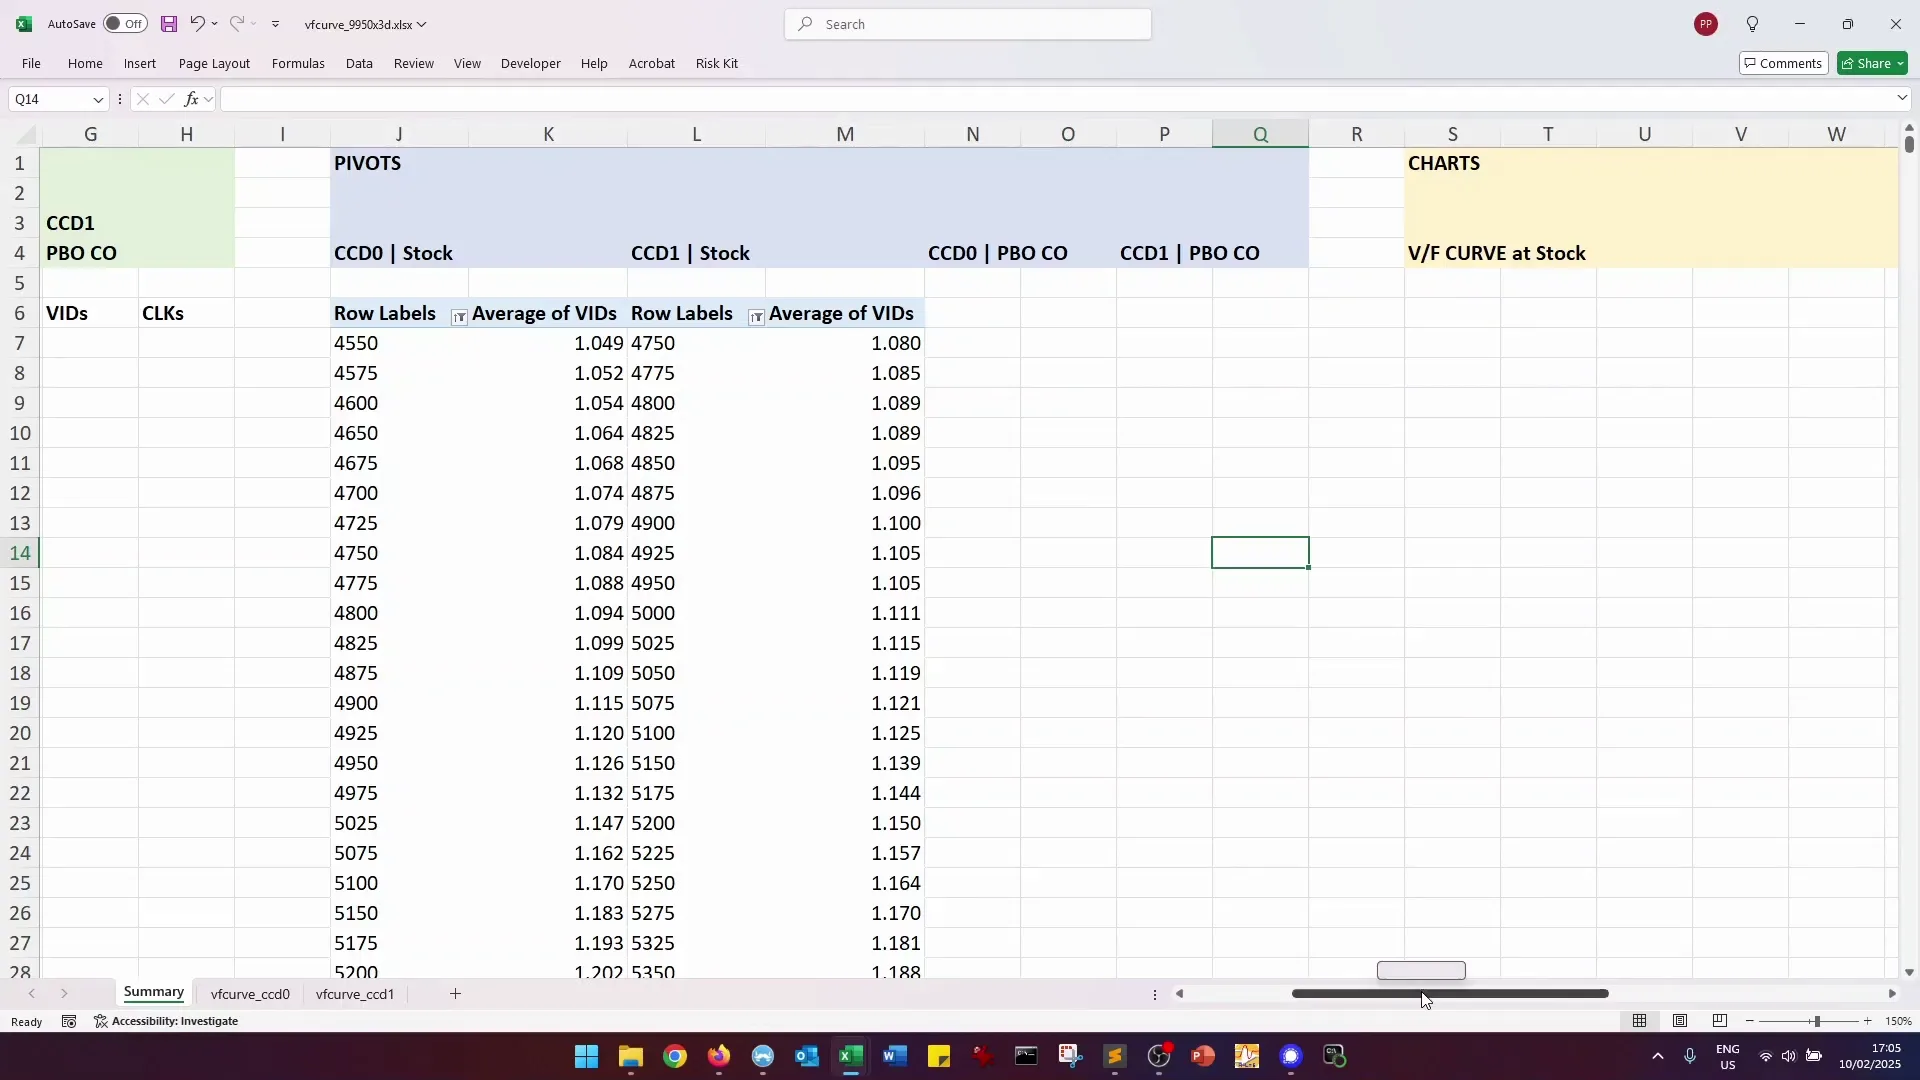
Next, we need to compile the V/F points. For this, I use a pivot table where each frequency point is mapped to an average voltage. Averaging out the voltage helps smooth out the V/F curve which makes it easier to visualize and compare.
As a final step, you might want to clean up some of the outlier data.
Now, you should have a VF table for each CCD matching a Core Clock with its operating voltage. All that’s left is to put this into a nice-looking graph.
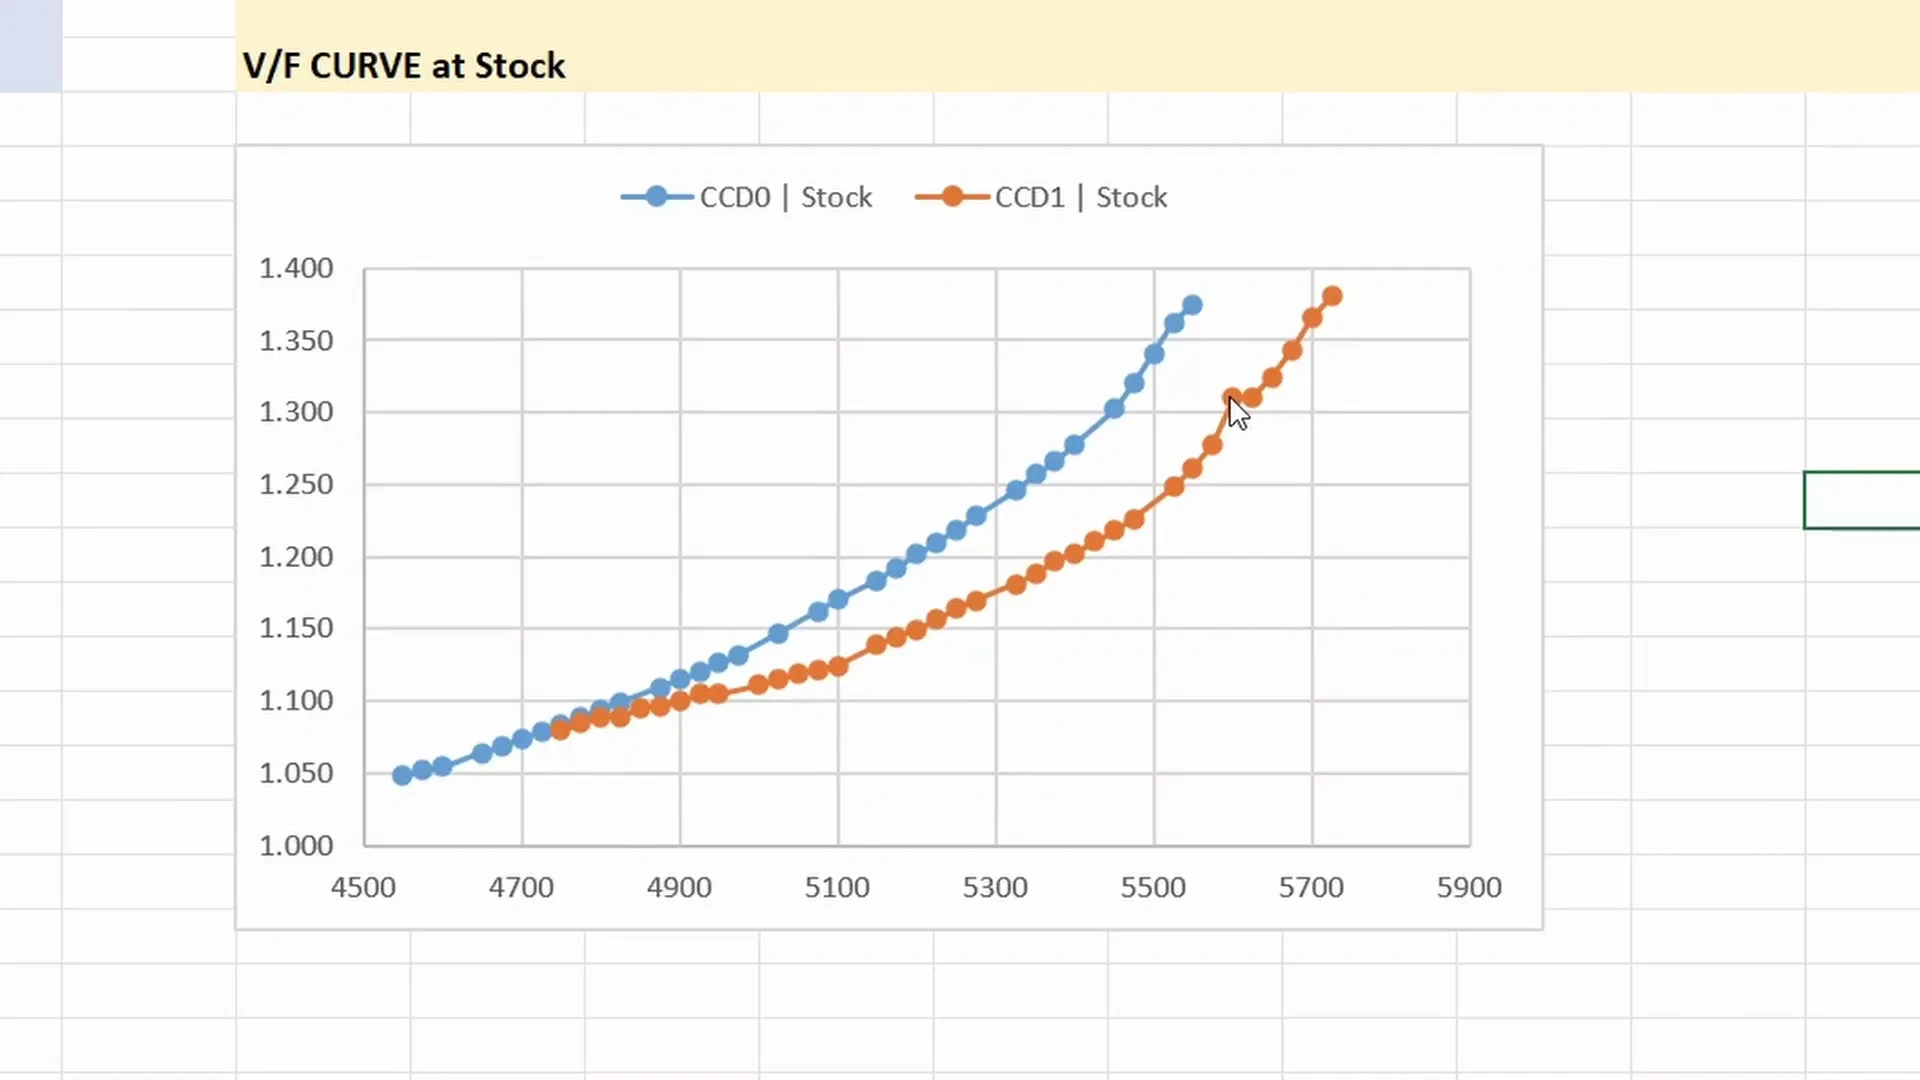
Building the Charts
Putting together the graph is elementary Excel work so I won’t go too deep into the process. The only thing I want to mention is that I’m usually not making charts based on the pivot tables but build them manually because then it’s easy to add other V/F curves as well.
Ryzen 9000 V/F Curve: More Things
Hopefully, this guide can help you put together the V/F curve of your Ryzen processor. Of course, there are more things we can look into.
For example, you could compile the V/F curve of each core independently by enabling just a single core from the BIOS. Or you could compile the V/F curve with a different application to compare the V/F range in higher, more demanding workloads.
These are things I’ve also got on my to-do list so maybe I’ll get around it someday.
Ryzen 9000 V/F Curve: Outro
Alright, that’s it for this CheckPoint – let me know if you have any ideas in the comments below, and see you in the next one!
\24z13L
I’ve been working on extensive mapping of my 9950X3D V/F/T/*etc* curves and I made a cli Pytool (still in progress but it works) to take HWiNFO logs and make 2D/3D plot/graphs. Quite time extensive for logging but I have some interesting results that assisted me in further understanding the “magic” by taking logs with varied settings and conditions:
All logs 250ms polling:
1)Baseline “Basic Bios”: BIOS set to default/optimal, besides needed switch for PCIe 5.0 x4 on an SSD, disables USB4. Absolute baseline BIOS.
2)EXPO “Basic Bios Plus”: “Basic Bios” + EXPO or any favorite memory tuning.
3)PBO Auto “factory boost” : “2” + Bios>Advanced>AMD>PBO>Auto (nothing else)
4)PBO Advanced “Base Advanced” : “2” + Bios>Advanced>AMD>PBO>Advanced (nothing else)
5) PBO Advanced “Base Advanced w/options”: “2” + Bios>Advanced>AMD>PBO>Advanced (motherboard, +200, X10, 100C, CO per core all values zero, CS Disabled)
6) PBO Advanced “Advanced w/options trials”: “5” and log all tests for all cores +15,+10,+5,+4,+3,+2,+1,0,-1,-2,-3,-4,-5,-10,-15,-20,-25,-30,-35,-40,-45,-50 (If crash then isolate and stick error core to last good point, note it for further testing… if one is this far, this is probably self-explanatory)
7) CS discovery – Same idea as “6” but with CO zero’d out, and CS for all values in “6” in all fields, with the 0 being the baseline.
8) CO+CS using logged CO values (-5 to all for example) as the “0” and then testing CS offset values up and down for that “baseline”, repeat for positive, negative CO values (Until satisfied with extrapolated CS shaping influence data)
9) “Optional”: All of the above with FCLK 2000/2200, LLC Modes tests, varied RAM tuning, etc.
Tests:
1)Cold boot and idle 1 hours, then separate warm Idle 8 hours, almost zero processes. Just nothing, no touch! very boring baseline but it does change as the adjustments proceed.
2) P95 small FFTs 4 Hour
3) Cinebench (I used CB24) Multi and Single, separate logs, set 4 hour (240min) each
4) Core Cycler 10 hours, BKT, BBP, SFT, FFT, N32, N64, HNT, VST, C17 60seconds 15s delay, config for long run
5) 3DMark CPU Bench, TSE Stress test, SW Stress test, FSE Stress test same log
6) “Crash test”: Cold boot, Start log, start P95 torture, start a cinebench run while core cycler spins up, open firefox with 450 tabs, open everything and try to soft crash as gently as possible to keep the log going through processes crashing and others opening. this is to make a very diverse and full 3D curve.
I have about 4.5Gb of logs so far, and some very interesting imagery revealing some hard points where PBO seems to stick V/F/T together.
This way it is possible to quickly create custom graphs and get isolated picture of either one or multiple cores (choose to plot worst or best cores, for example, cross CCD), while the system is under load and working for a realistic comparison against the baseline graphs made with the idle and automatic or zero’d PBO functionality. It is interesting how the groupings form consistently.
The testing is ongoing as it is for long duration and accurate tests, so that no smoothing is needed – only the data itself builds the reality and this has given some very close insight upon the mechanism known as either “magic” or, as we all know it simply mystifyingly as,
PBO.
TLDR, here is pretty graph of 9950X3D with BIOS stock, EXPO (only option), and BIOS>Advanced>AMD>PBO>Auto
10 hours Core Cycler 10 hours, BKT, BBP, SFT, FFT, N32, N64, HNT, VST, C17 60seconds 15s delay, config for long run
2D and 3D graphs, separated by CCD and color coded to provide enhanced mental picture of the inner workings and truly the 3D curvature when temp is involved.
The voltage for this graph is taken from VID – and we know that is not delivered voltage of course, but this puts an interesting perspective here.
https://imgur.com/a/Qwyav9U
Thank you for your efforts in helping understand PBO, skatterbencher. Perhaps one day all will be revealed…