SkatterBencher #67: Intel Core i9-14900K Overclocked to 6200 MHz

We overclock and undervolt the Intel Core i9-14900K Raptor Lake Refresh CPU up to 6.2 GHz with the GIGABYTE Z790 Aorus Master X motherboard and EK-Quantum water cooling.
This is my first overclocking guide for the 14th-generation Raptor Lake Refresh processors, and it’s taken me quite some time to complete it. I encountered several interesting challenges and problems, which I hope to detail today. I hope you enjoy the blog post.
Intel Core i9-14900K: Introduction
The Intel Core i9-14900K is the flagship processor of Intel’s 14th-generation Core lineup and the first 14th gen CPU I’m overclocking on this channel. The Raptor Lake Refresh processors launched on October 17, 2023, about one year after the launch of the original Raptor Lake processors.
It should come as no one’s surprise if I say that the Raptor Lake Refresh processors are identical to Raptor Lake processors in every aspect, bar specifics such as frequency, core count, and L3 cache of specific SKUs. Intel Raptor Lake Refresh builds on the same performance hybrid architecture introduced with the 12th-generation Alder Lake. So, it also features Performance P-cores and Efficient E-cores. Like the 13th-gen Raptor Lake, it is built using an improved process dubbed Intel 7 Ultra.

Compared to its Core i9-13900K predecessor, launched one year ago, the 14900K has a 200 MHz higher base and maximum boost frequency. Other than that, the processors are the same.
The exact specification of the Core i9-14900K is a bit unclear. As you may have noticed, some media say the maximum all-core boost is 5.7 GHz, but Intel’s product page says the maximum Turbo Boost 2.0 frequency is 5.6 GHz. Things are confusing because the CPU supports TVB and ABT technologies, but it’s unclear how much frequency these technologies add to the CPU. After a bit of research, I assume the official specification of the 14900K is as follows.
- The P-Core base frequency is 3.2 GHz.
- The Turbo Boost 2.0 (TBT2) frequency is 5.6 GHz, meaning every P-core can boost to 5.6 GHz. Traditionally, this frequency is only available for up to 2 active P-cores. As more cores activate, the maximum frequency drops gradually. But that’s unclear for the 14900K.
- The Turbo Boost Max 3.0 (TBTM3) frequency is 5.8 GHz for up to 2 active P-cores. However, only the favored cores can boost to 5.8 GHz. The others are limited to 5.6 GHz.
- When Thermal Velocity Boost (TVB) is active, the two favored P-cores can boost to 6.0 GHz. Typically, TVB also adds an extra ratio in scenarios with more than two active cores. But, again, that’s unclear for the 14900K. The TVB temperature has traditionally been 70 degrees Celsius; however, that is also unclear for the 14900K, as 6 GHz can be reached even when the cores are 100 degrees Celsius.
- The specification is unclear because of Adaptive Boost Technology (ABT). This technology was first introduced with the 11900K. It provides a significant performance boost, overriding many other Turbo Boost technologies. In the case of the 14900K, when ABT is enabled, up to 8 P-cores can boost to 5.7 GHz even when all P-cores are active. But it’s important to remember that ABT is fused enabled and cannot be disabled by the end user.

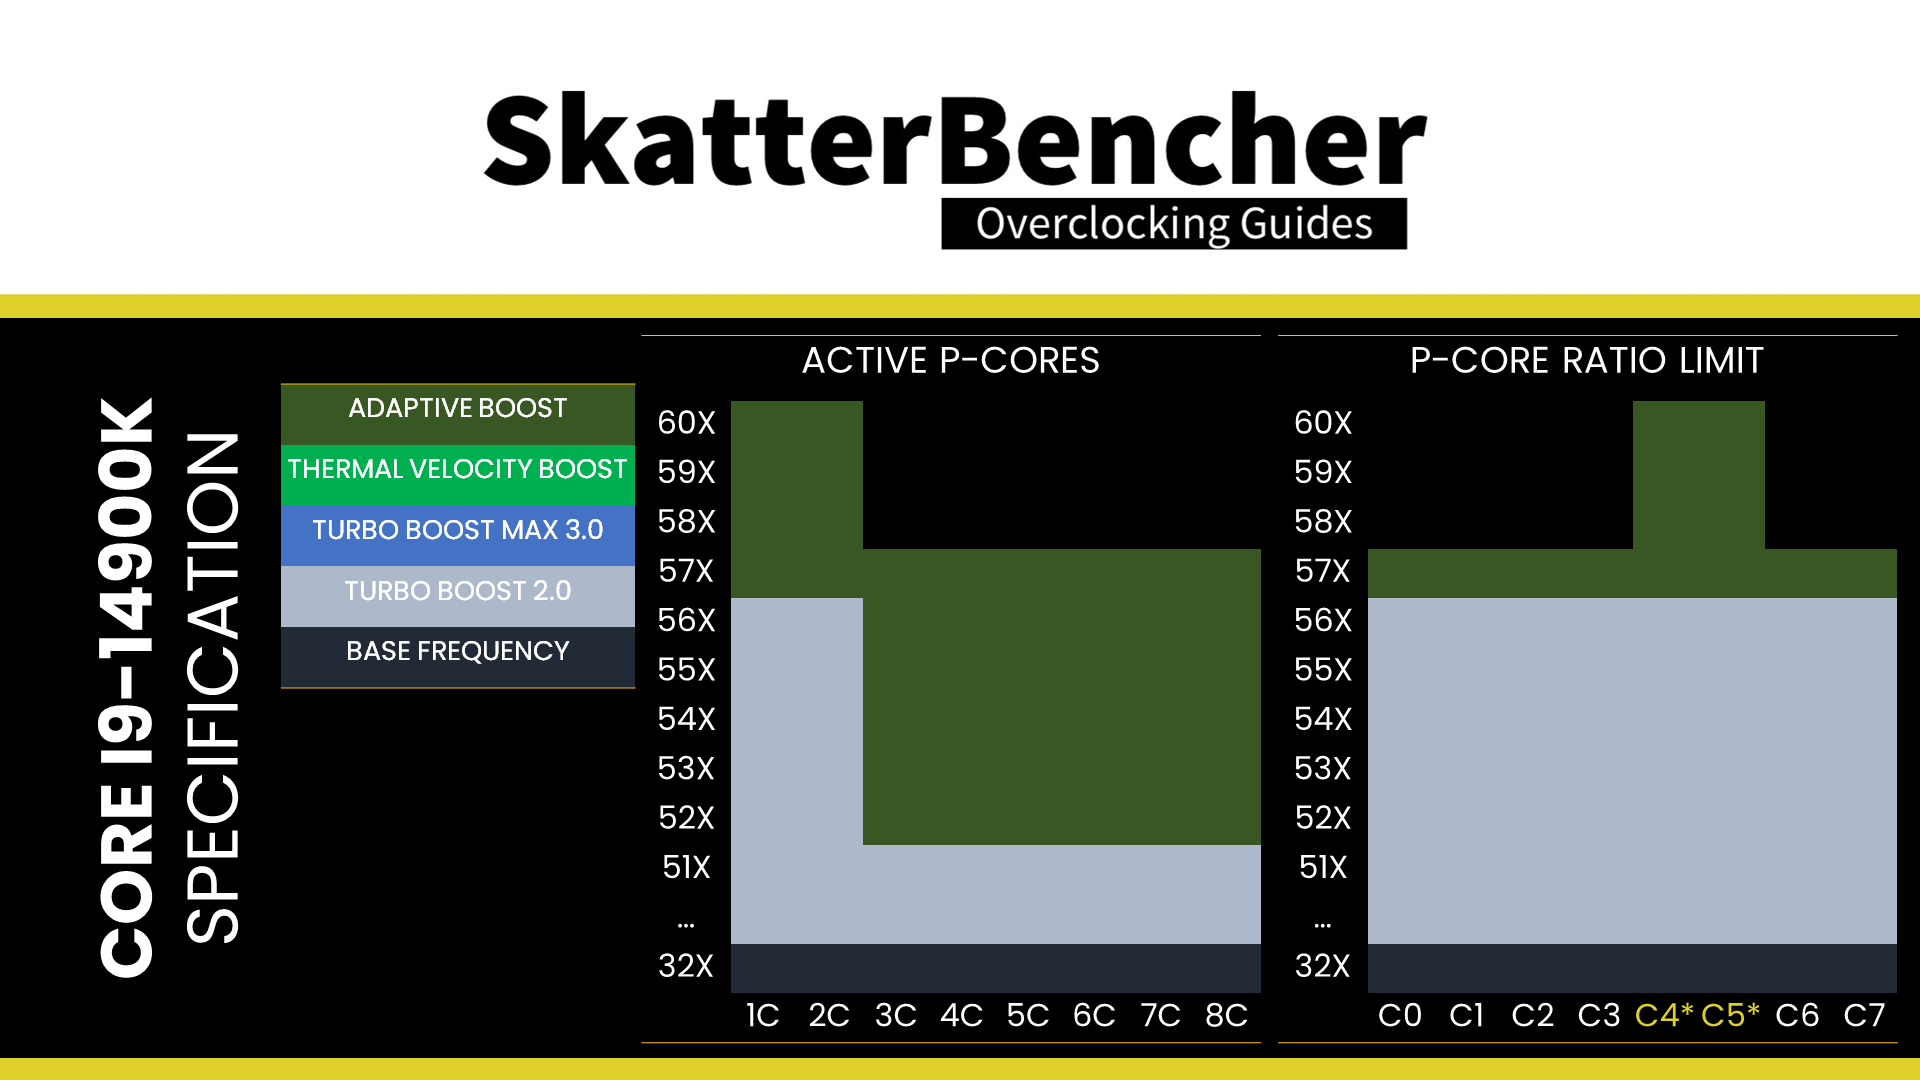
So, as an end-user, what you’ll see in the operating system is that the CPU will boost up to 6 GHz when the two favored cores are active and up to 5.7 GHz when any non-favored core is active up to when all cores are active.
- The E-core base frequency is 2.4 GHz.
- The E-core maximum boost frequency is 4.4 GHz for all cores and all boost scenarios.
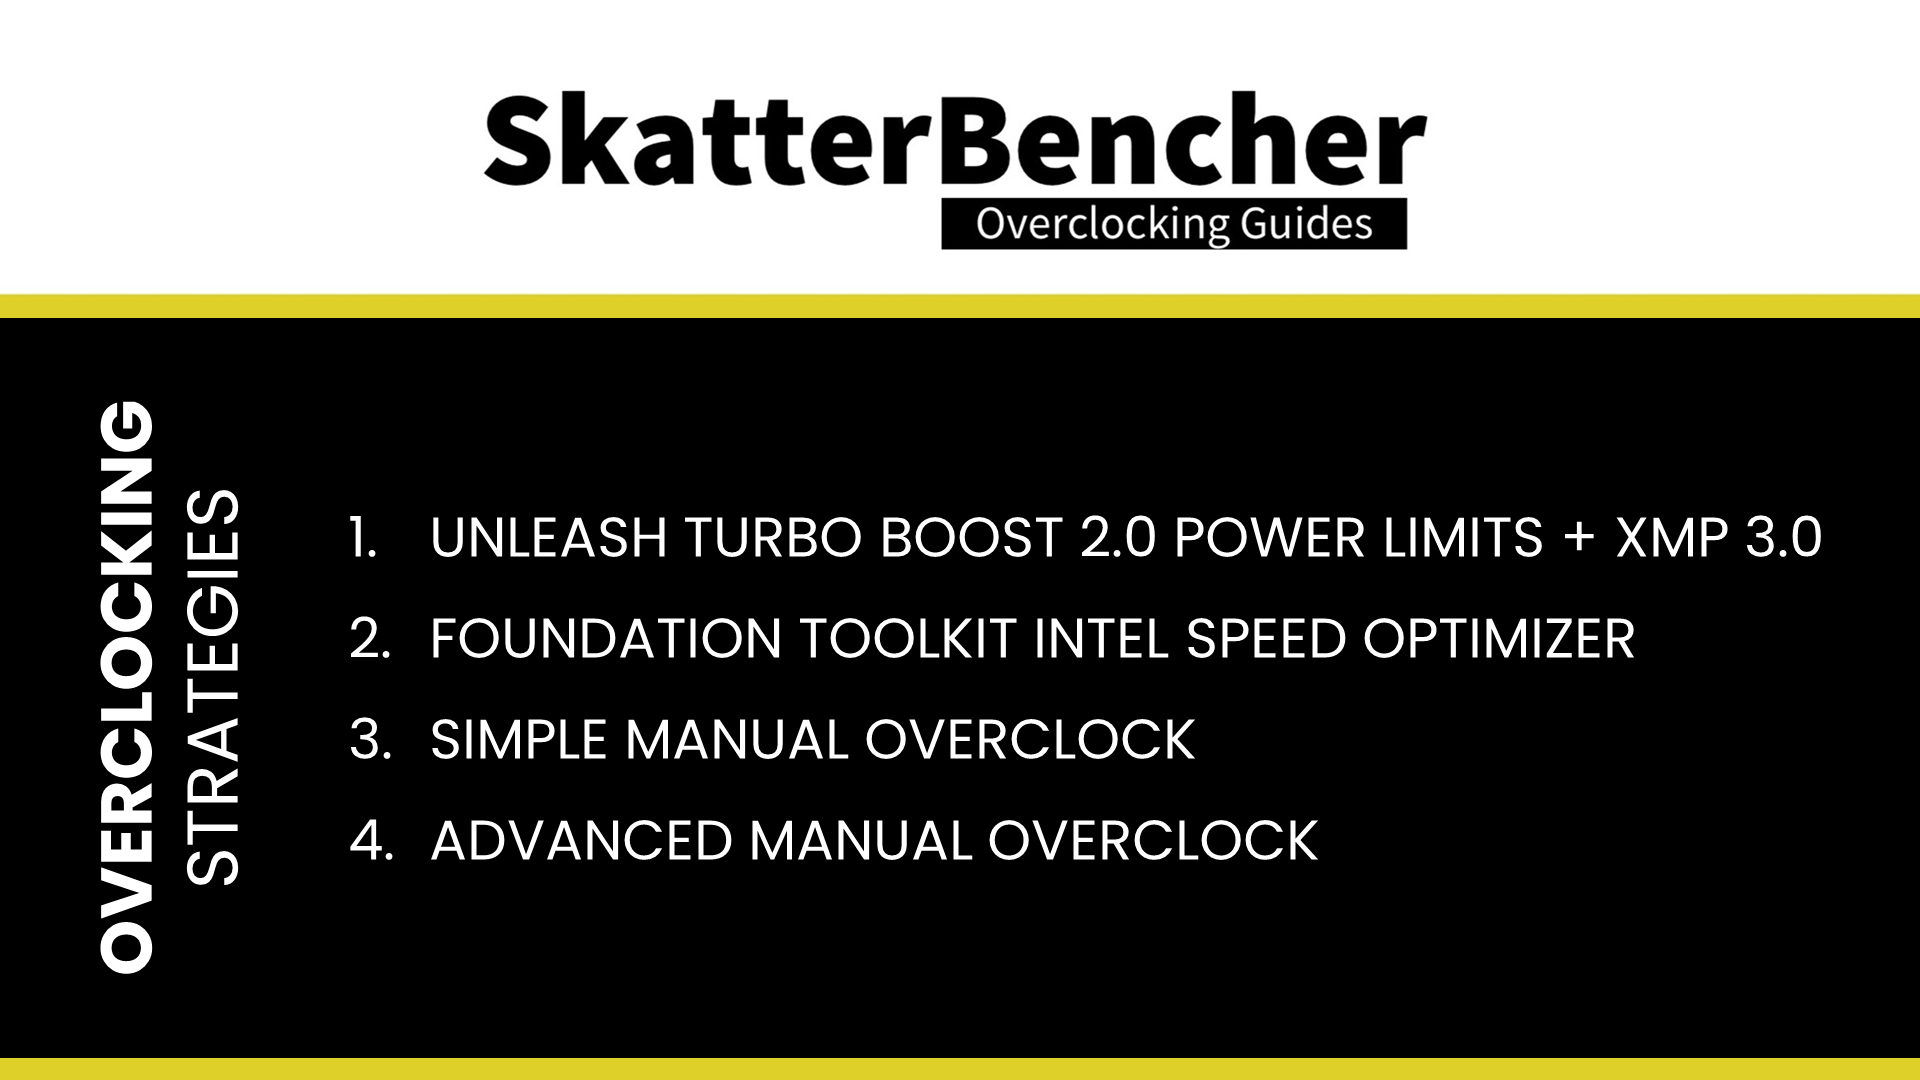
In this blog post, we will cover four different overclocking strategies:
- We unleash the Turbo Boost 2.0 limits and enable XMP 3.0
- We overclock using Foundation Toolkit ISO
- We get into the simple manual overclocking
- We dive a little deeper into the overclocking toolkit for an advanced overclock
However, before we jump into overclocking, let us quickly review the hardware and benchmarks used in this guide.
Intel Core i9-14900K: Platform Overview
The system we’re overclocking today consists of the following hardware.
| Item | SKU | Price (USD) |
| CPU | Intel Core i9-14900K | 599 |
| Motherboard | GIGABYTE Z790 Aorus Master X | 760 |
| CPU Cooling | EK-Quantum Velocity2 EK-Quantum Kinetic FLT 240 D5 EK-Quantum Surface P480M – Black | 147 239 163 |
| Fan Controller | ElmorLabs EFC-SB | 50 |
| Memory | G.SKILL Trident Z DDR5-7200 CL34 32GB | 310 |
| Power Supply | Cooler Master V1200 Platinum | 250 |
| Graphics Card | ASUS ROG Strix RTX 2080 TI | 400 |
| Storage | AORUS RGB 512 GB M.2-2280 NVME | 120 |
| Chassis | Open Benchtable V2 | 200 |
ElmorLabs EFC-SB & EVC2
The Easy Fan Controller SkatterBencher Edition (EFC-SB) is a customized EFC resulting from a collaboration between SkatterBencher and ElmorLabs.

I explained how I use the EFC-SB in a separate blog post on this website. By connecting the EFC-SB to the EVC2 device, I monitor the ambient temperature (EFC), water temperature (EFC), and fan duty cycle (EFC). I include the measurements in my Prime95 stability test results.
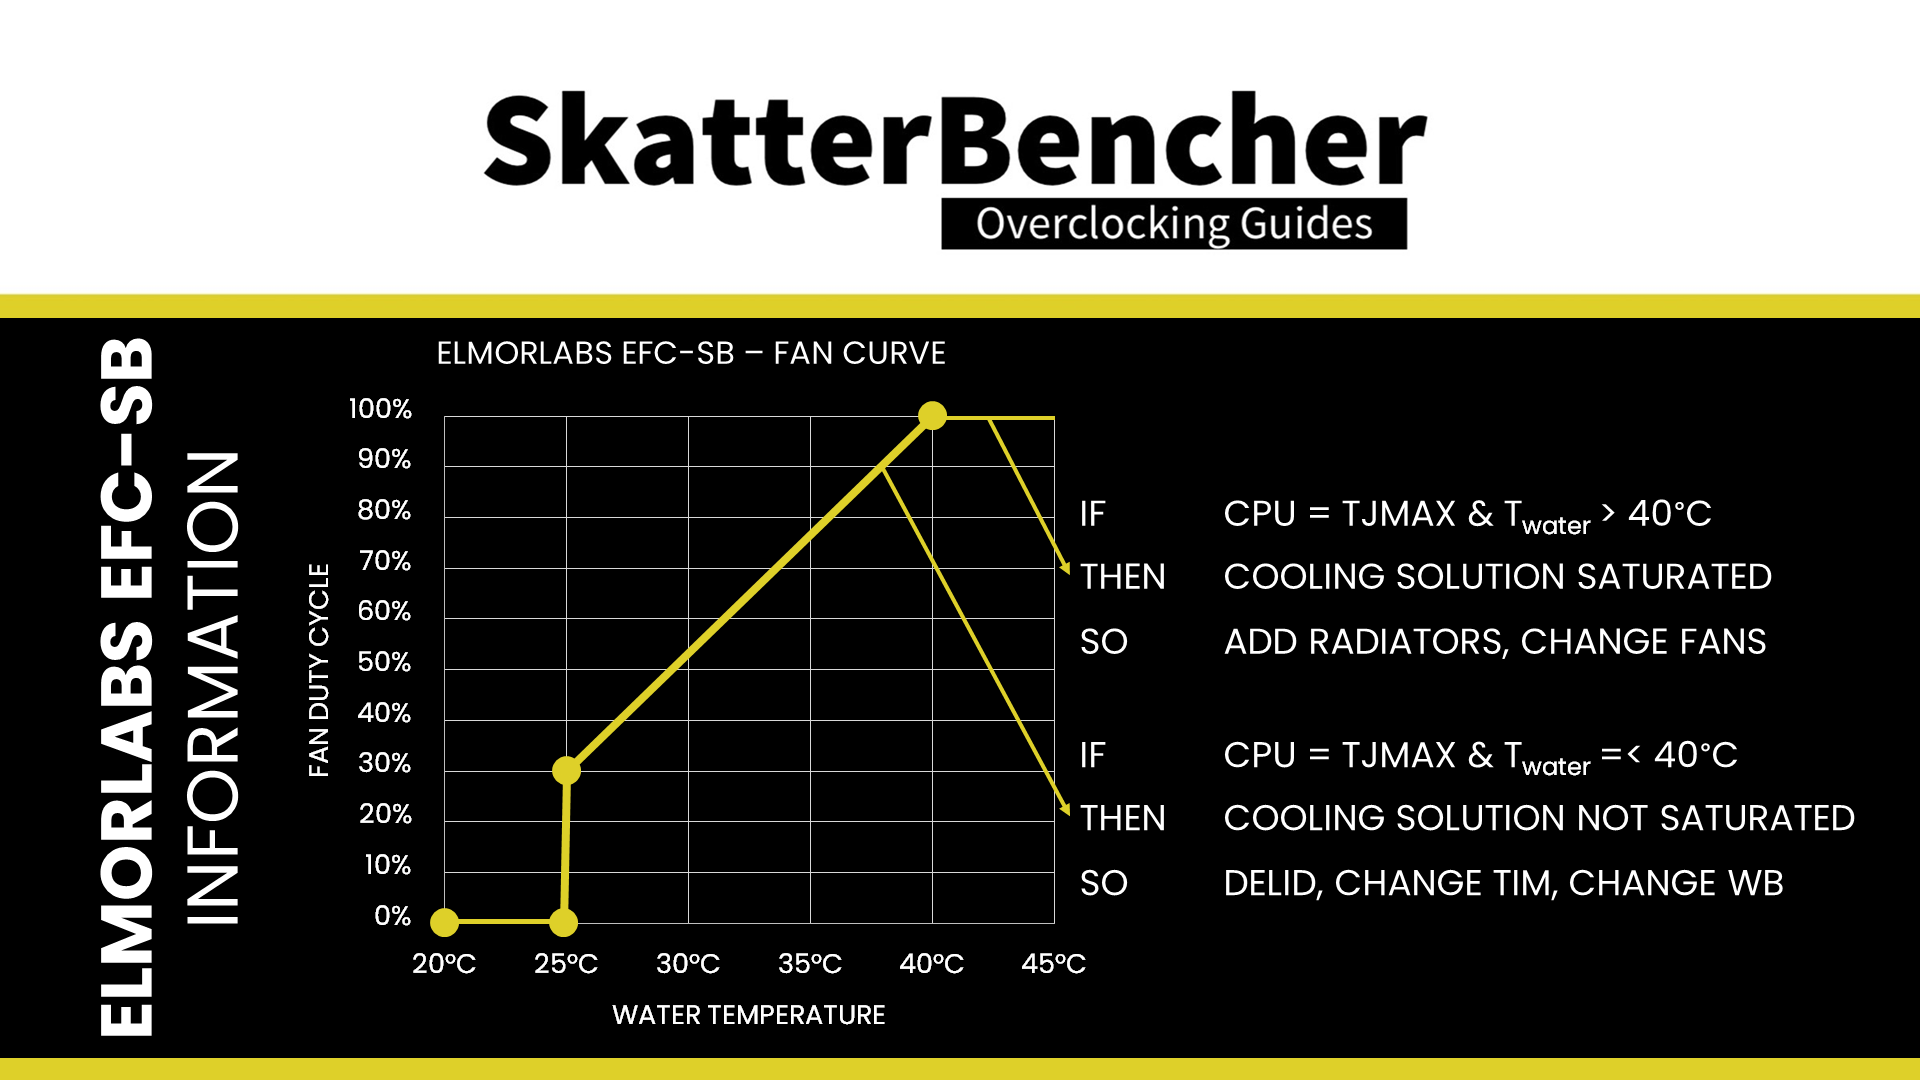
I also use the ElmorLabs EFC-SB to map the radiator fan curve to the water temperature. Without going into too many details, I have attached an external temperature sensor from the water in the loop to the EFC-SB. Then, I use the low/high setting to map the fan curve from 25 to 40 degrees water temperature. I use this configuration for all overclocking strategies.
Intel Core i9-14900K: Benchmark Software
We use Windows 11 and the following benchmark applications to measure performance and ensure system stability.
| BENCHMARK | LINK |
| SuperPI 4M | https://www.techpowerup.com/download/super-pi/ |
| Geekbench 6 | https://www.geekbench.com/ |
| Cinebench 2024 | https://www.maxon.net/en/cinebench/ |
| CPU-Z | https://www.cpuid.com/softwares/cpu-z.html |
| V-Ray 5 | https://www.chaosgroup.com/vray/benchmark |
| Corona Benchmark | https://corona-renderer.com/benchmark |
| AI-Benchmark | https://ai-benchmark.com/ |
| Crossmark | https://bapco.com/products/crossmark/ |
| 3DMark Night Raid | https://www.3dmark.com/ |
| 3DMark CPU Profile | https://www.3dmark.com/ |
| Shadow of the Tomb Raider | https://store.steampowered.com/app/750920/Shadow_of_the_Tomb_Raider_Definitive_Edition/ |
| Final Fantasy XV | http://benchmark.finalfantasyxv.com/na/ |
| OCCT | https://www.ocbase.com/ |
OCCT
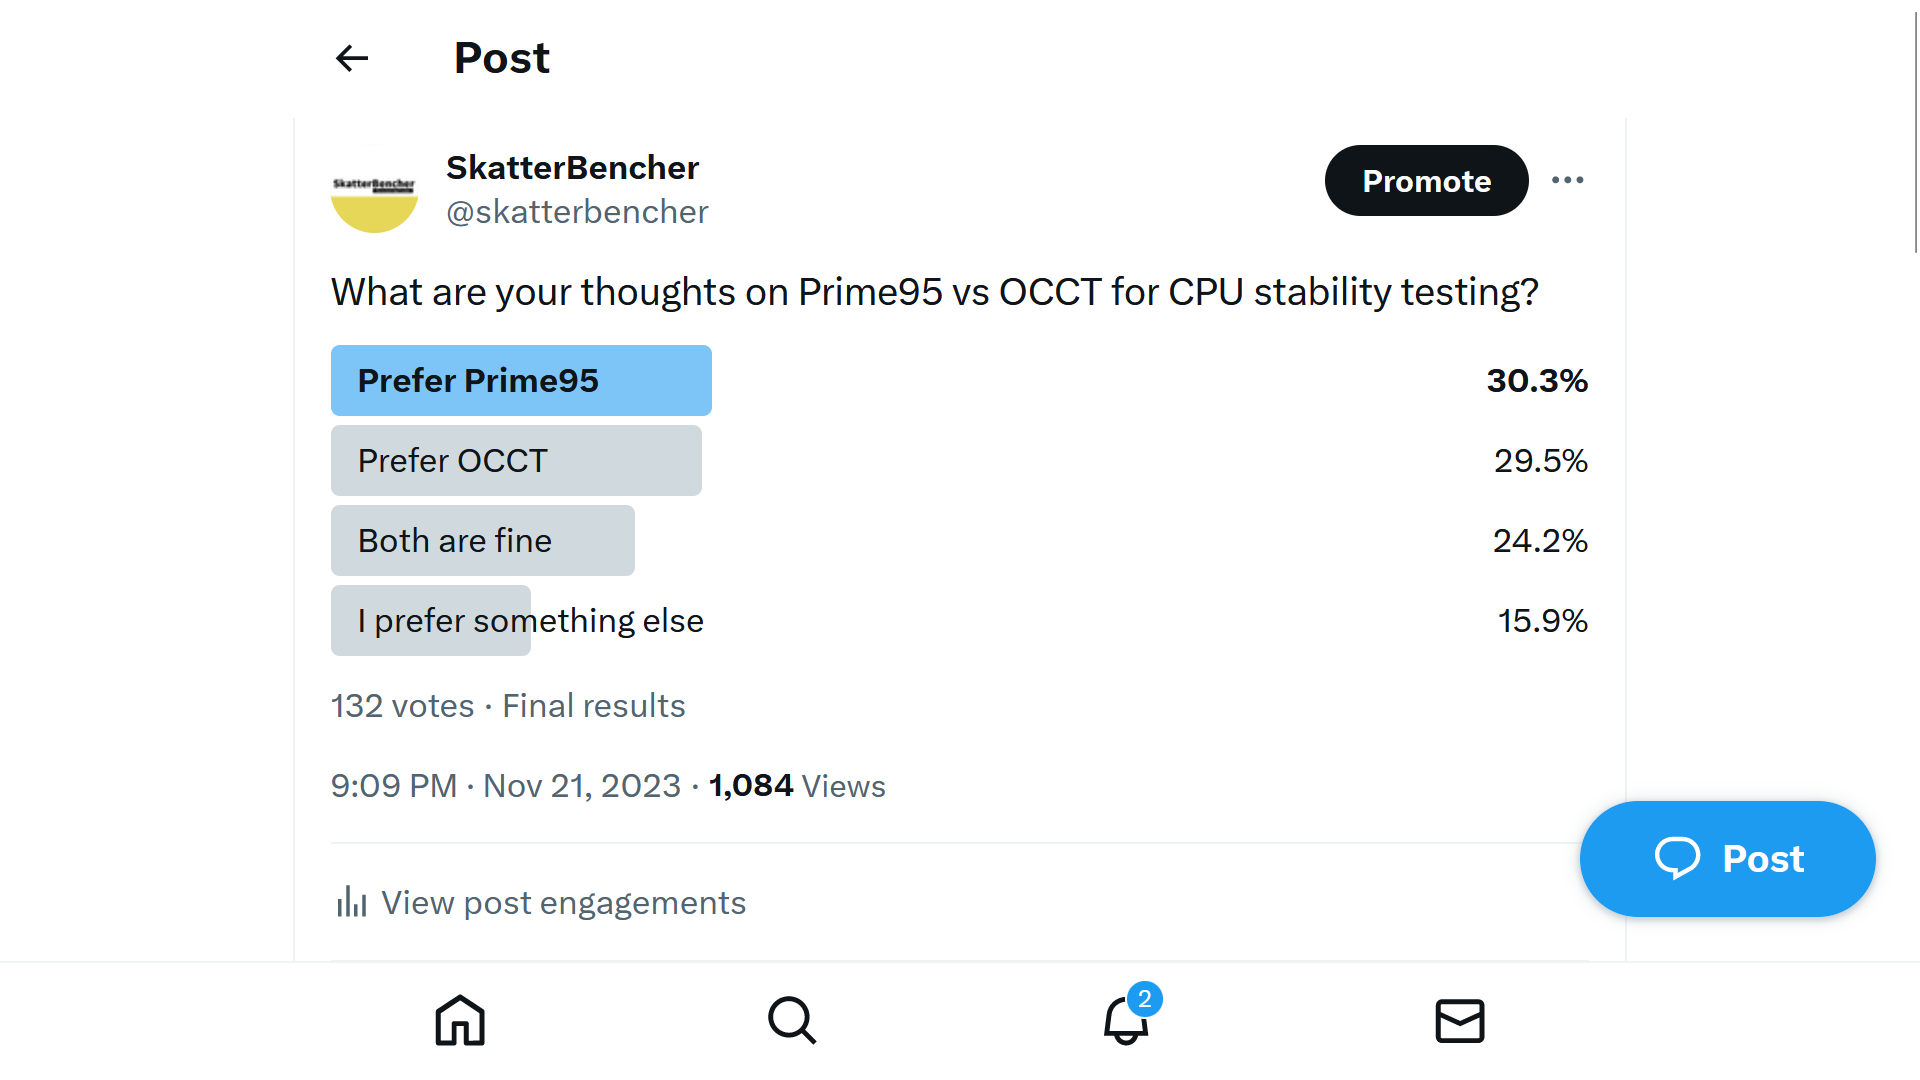
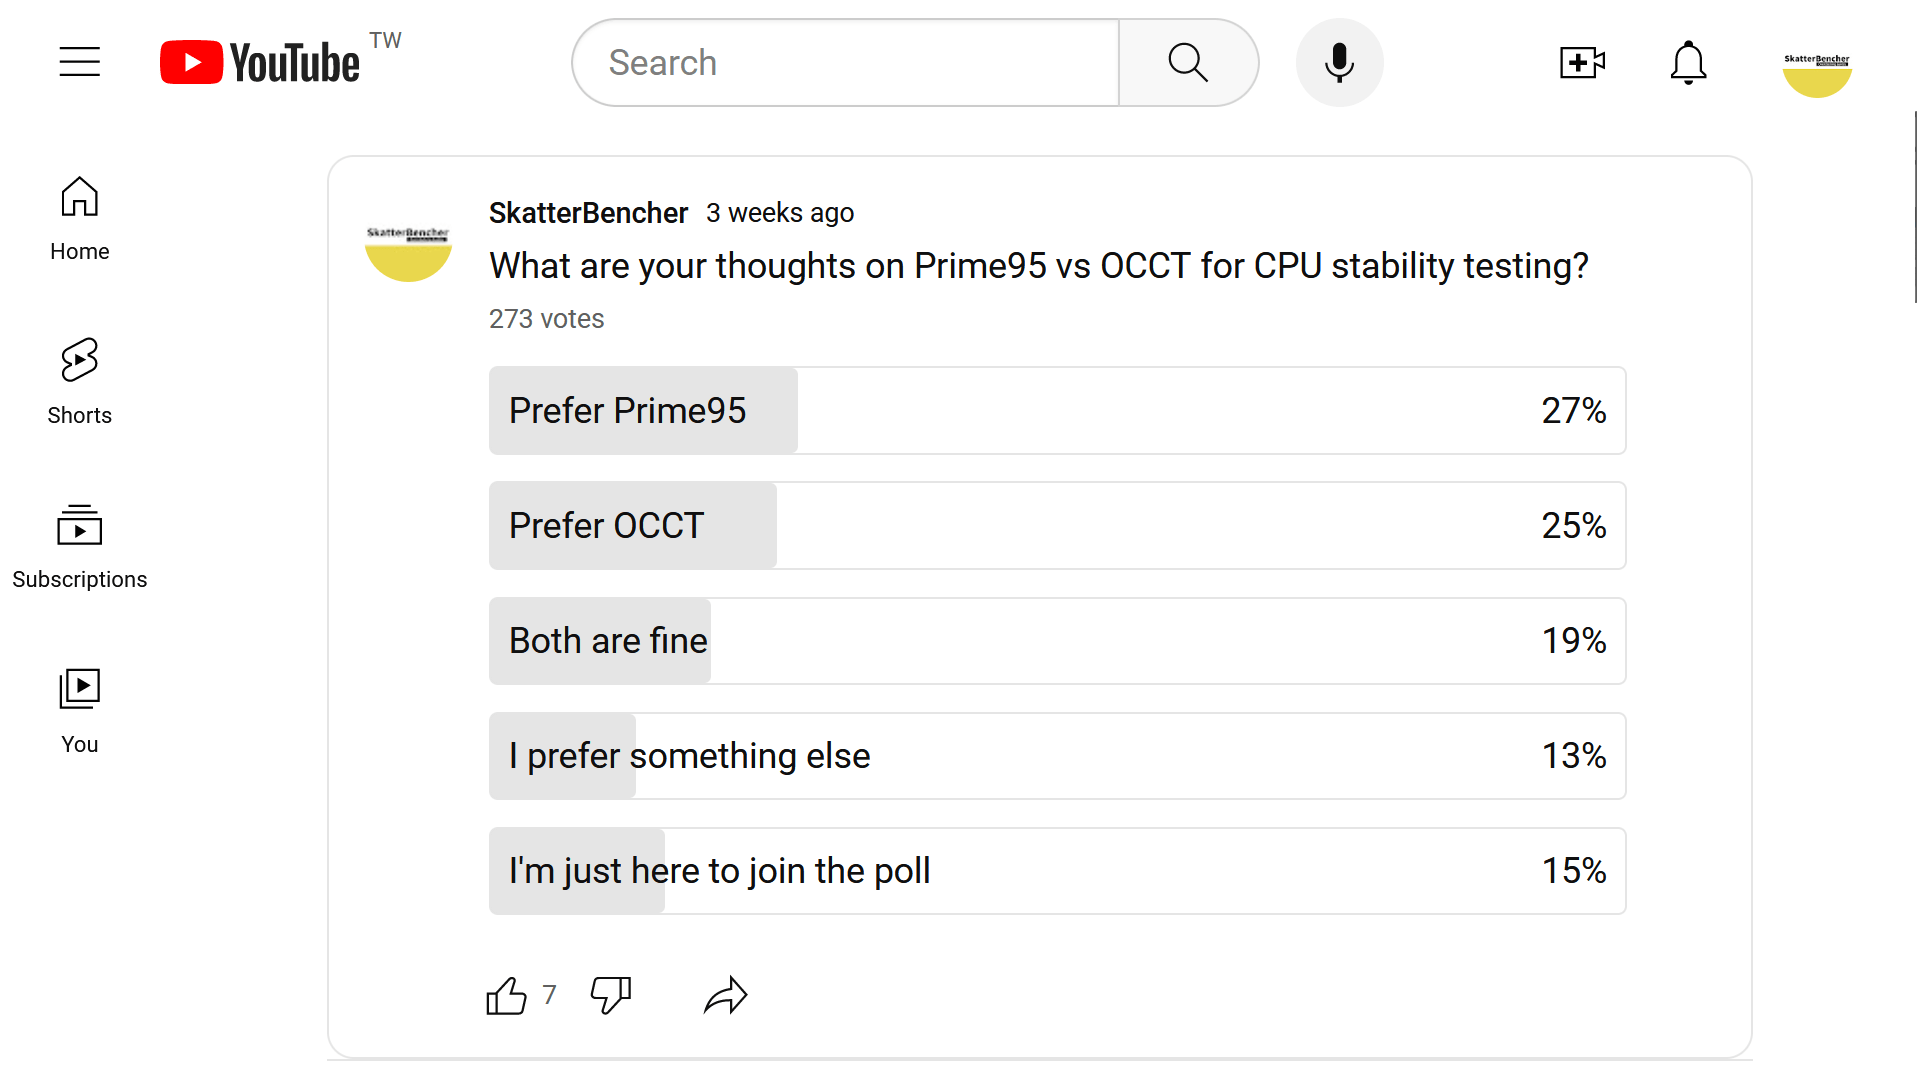
This is my first time using OCCT as a stress test tool instead of Prime95. I want to take a couple of minutes to explain the reason for that. The main reason to consider swapping out Prime95 for OCCT in this guide came after a couple of weeks of struggling to determine why the effective core clock readings kept dropping during a Prime95 workload. Especially with high-speed memory.

For those unaware, we must differentiate between the set (or target) clock and the effective clock on modern chips. The target core clock is the base clock and multiplier. In contrast, the effective core clock is the actual number of clock cycles across a given period. The effective clock is an essential metric because that’s what drives compute performance.
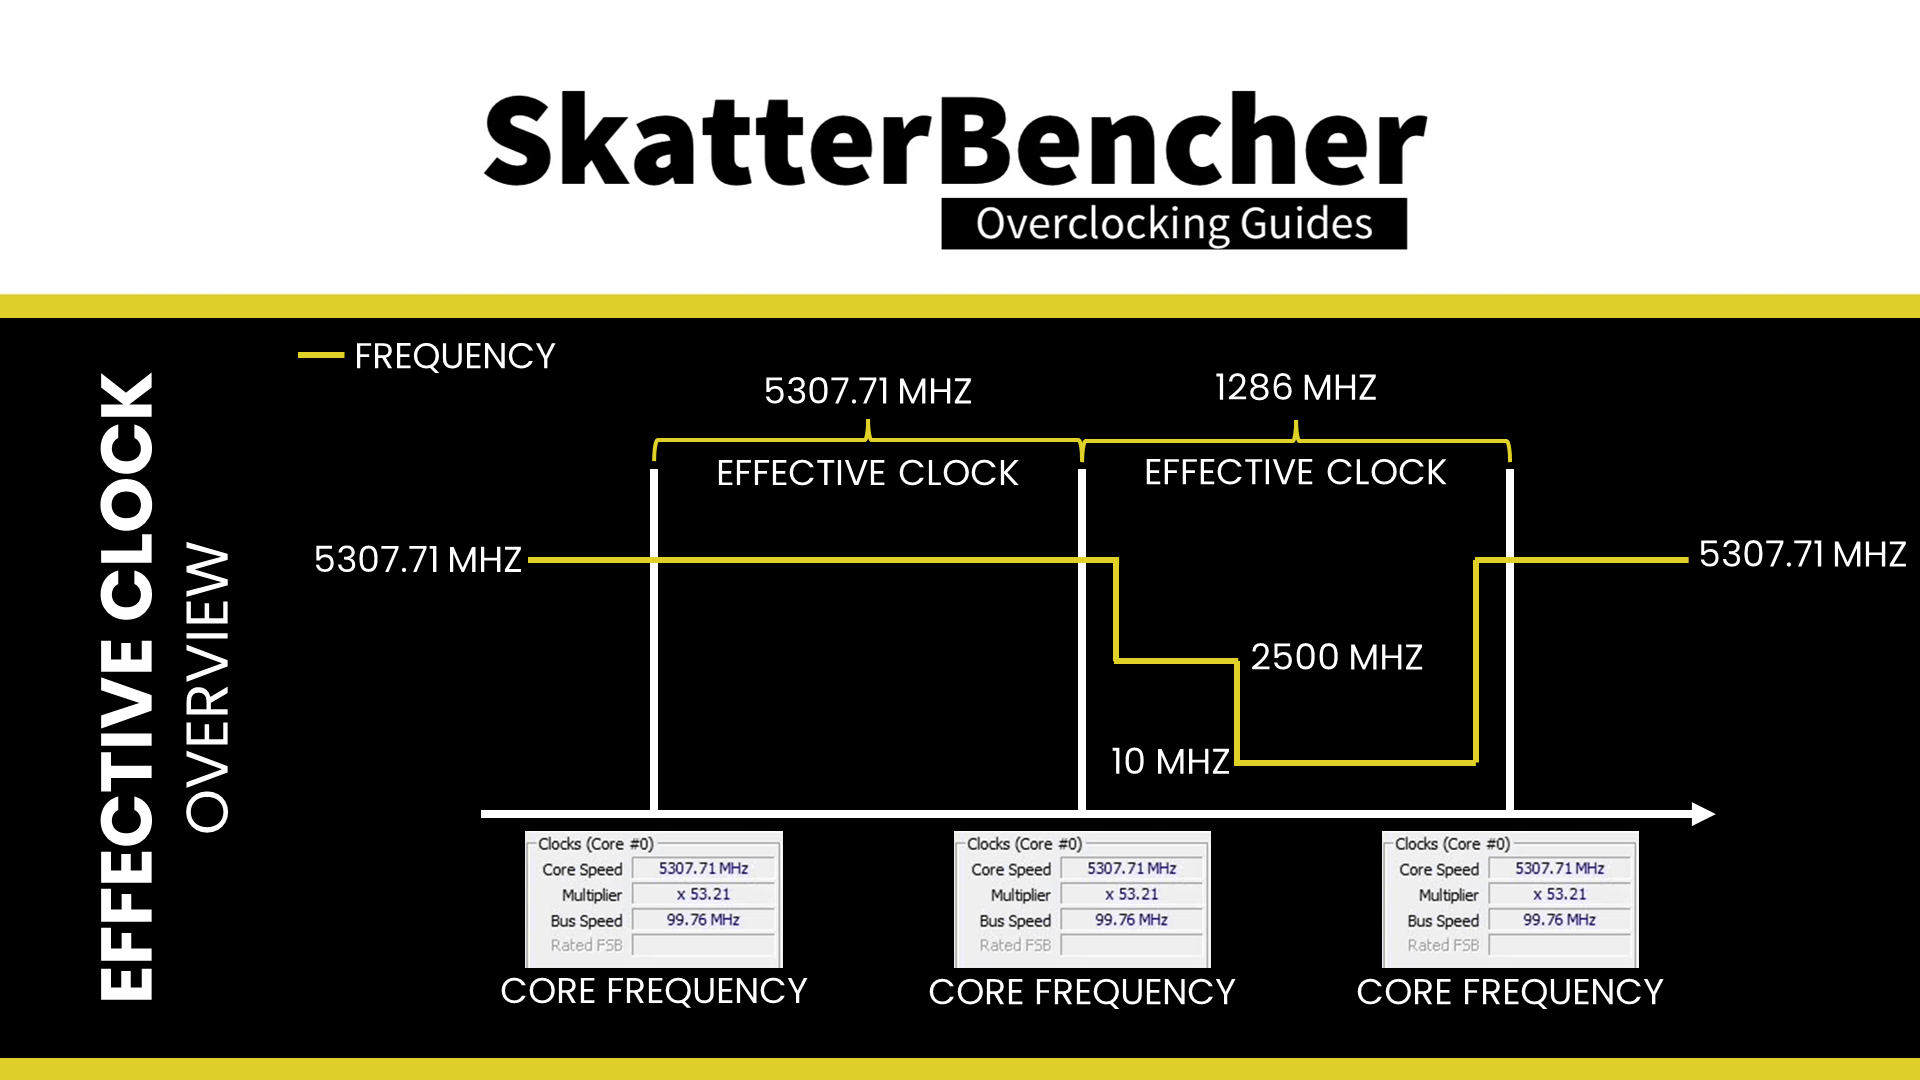
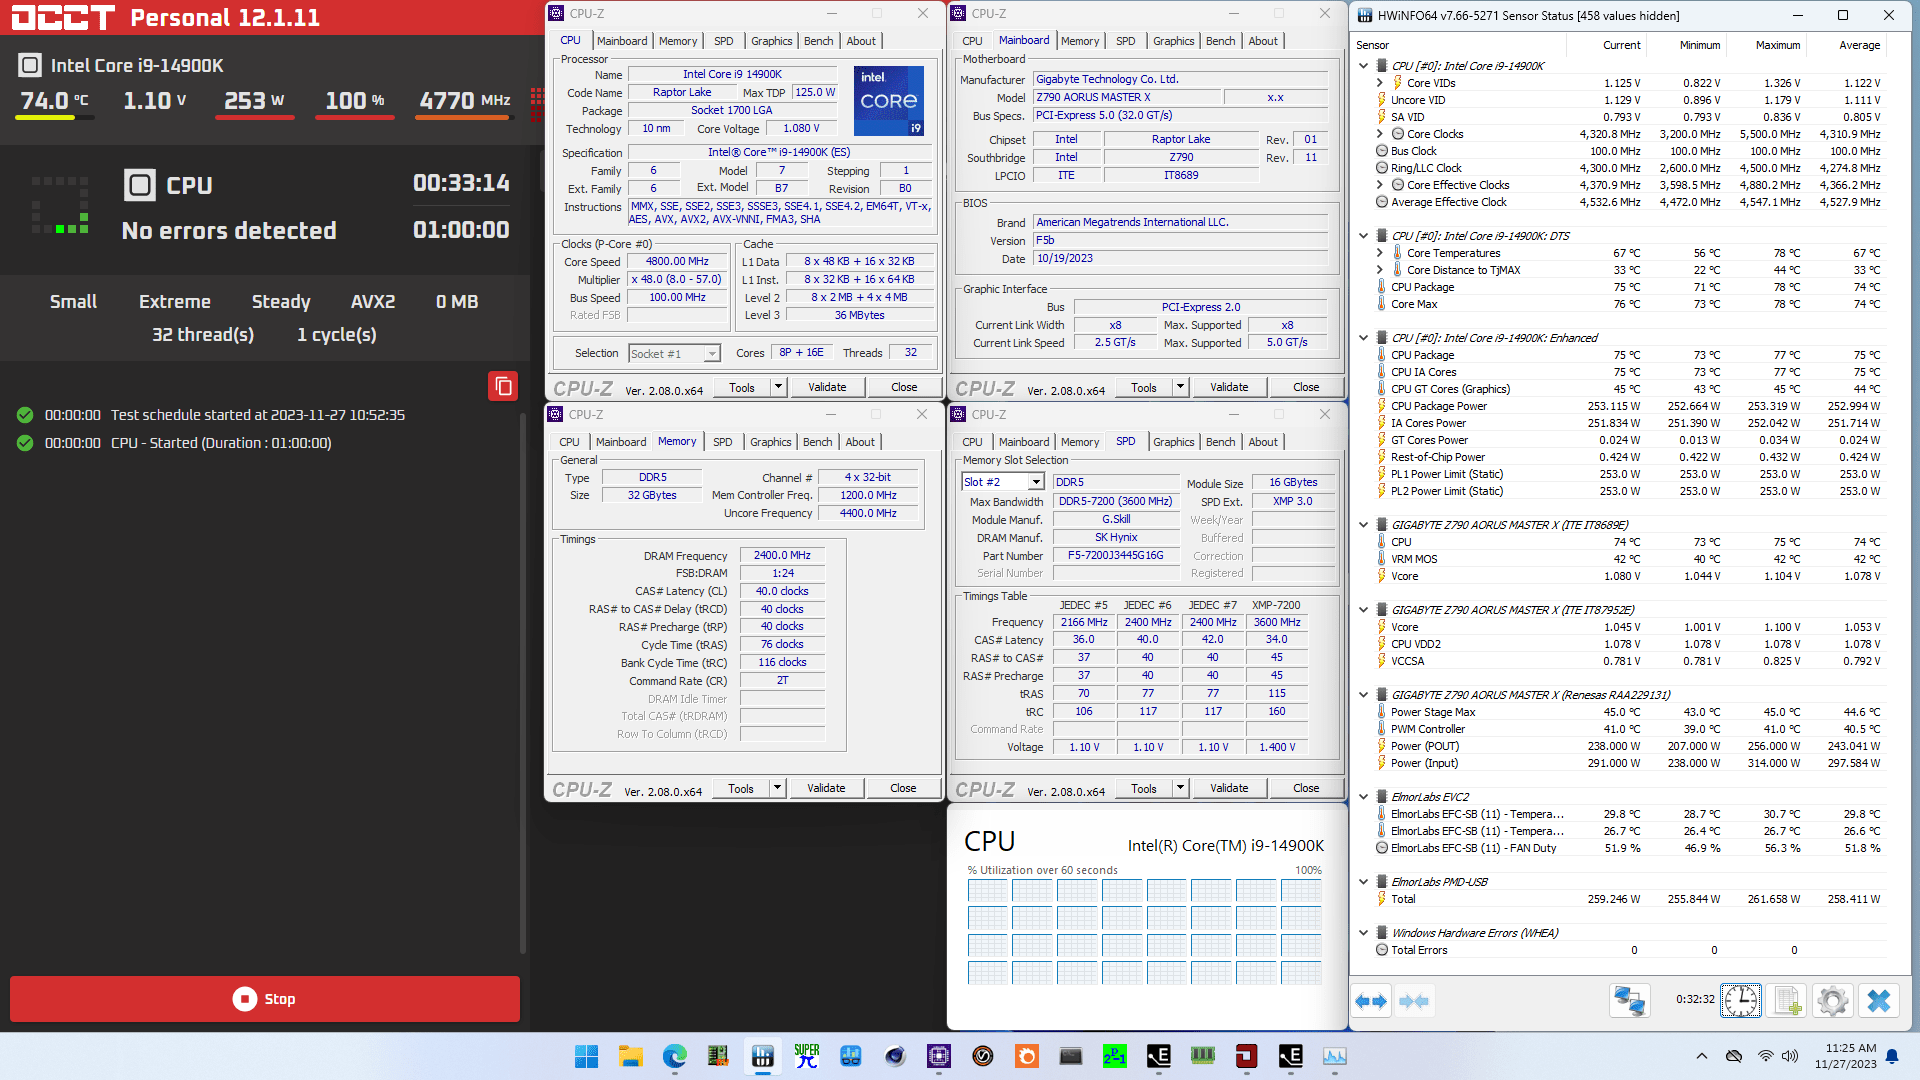
When running Prime95 on this 14900K, I noticed that the effective clock, measured by HWiNFO, would sometimes drop significantly below the target clock. For example, take this Prime95 result, which I ran with the CPU at default. While the target clock remains at the expected 5.7 GHz for the P-cores and 4.4 GHz for the E-cores, the effective clock drops significantly below that.
These effective clock excursions also occur if I run the CPU at much lower frequencies, though to a much lesser extent. However, when I disable hyper-threading for the P-cores, this discrepancy between the set clock and effective P-core clock goes away: 5.7 GHz set is 5.7 GHz get. For the E-cores, there’s still a difference, however.
OCCT provides more options for stress testing. I found that using a variable load type, a similar issue would occur where the P-core and E-core effective clock drops below the target clock. However, with a steady load type, this issue could be mitigated.
Since I want to measure the improvement in core frequency during a worst-case stress test, I want to check the average effective clock of the P-cores and E-cores. The OCCT CPU stability test with a small data set, in extreme mode, and steady load type gave me the highest load in terms of power consumption and stable, effective clock.
As I explored the OCCT software options, I became intrigued with its many options. Since our community seems optimistic about the software vis-à-vis Prime95, I’m looking to further integrate it into my future overclocking guides.
Intel Core i9-14900K: Stock Performance
Before starting overclocking, we must check the system performance at default settings.
Please note that out of the box, the Z790 Aorus Master X has a pretty non-standard configuration, including modified power limits and an AVX offset of minus 7. So, to check the performance at default settings, you must enter the BIOS and
- Switch to Advanced Mode
- In the Tweaker menu
- Enter the Advanced CPU settings submenu
- Set AVX Settings to User Defined
- Set AVX Optimum to Enabled
- Set Turbo Power Limits to Intel POR
- Set AVX Settings to User Defined
Then save and exit the BIOS.
The default Turbo Boost 2.0 parameters for the Core i9-14900K are as follows. We use the Extreme specification for measuring stock performance.

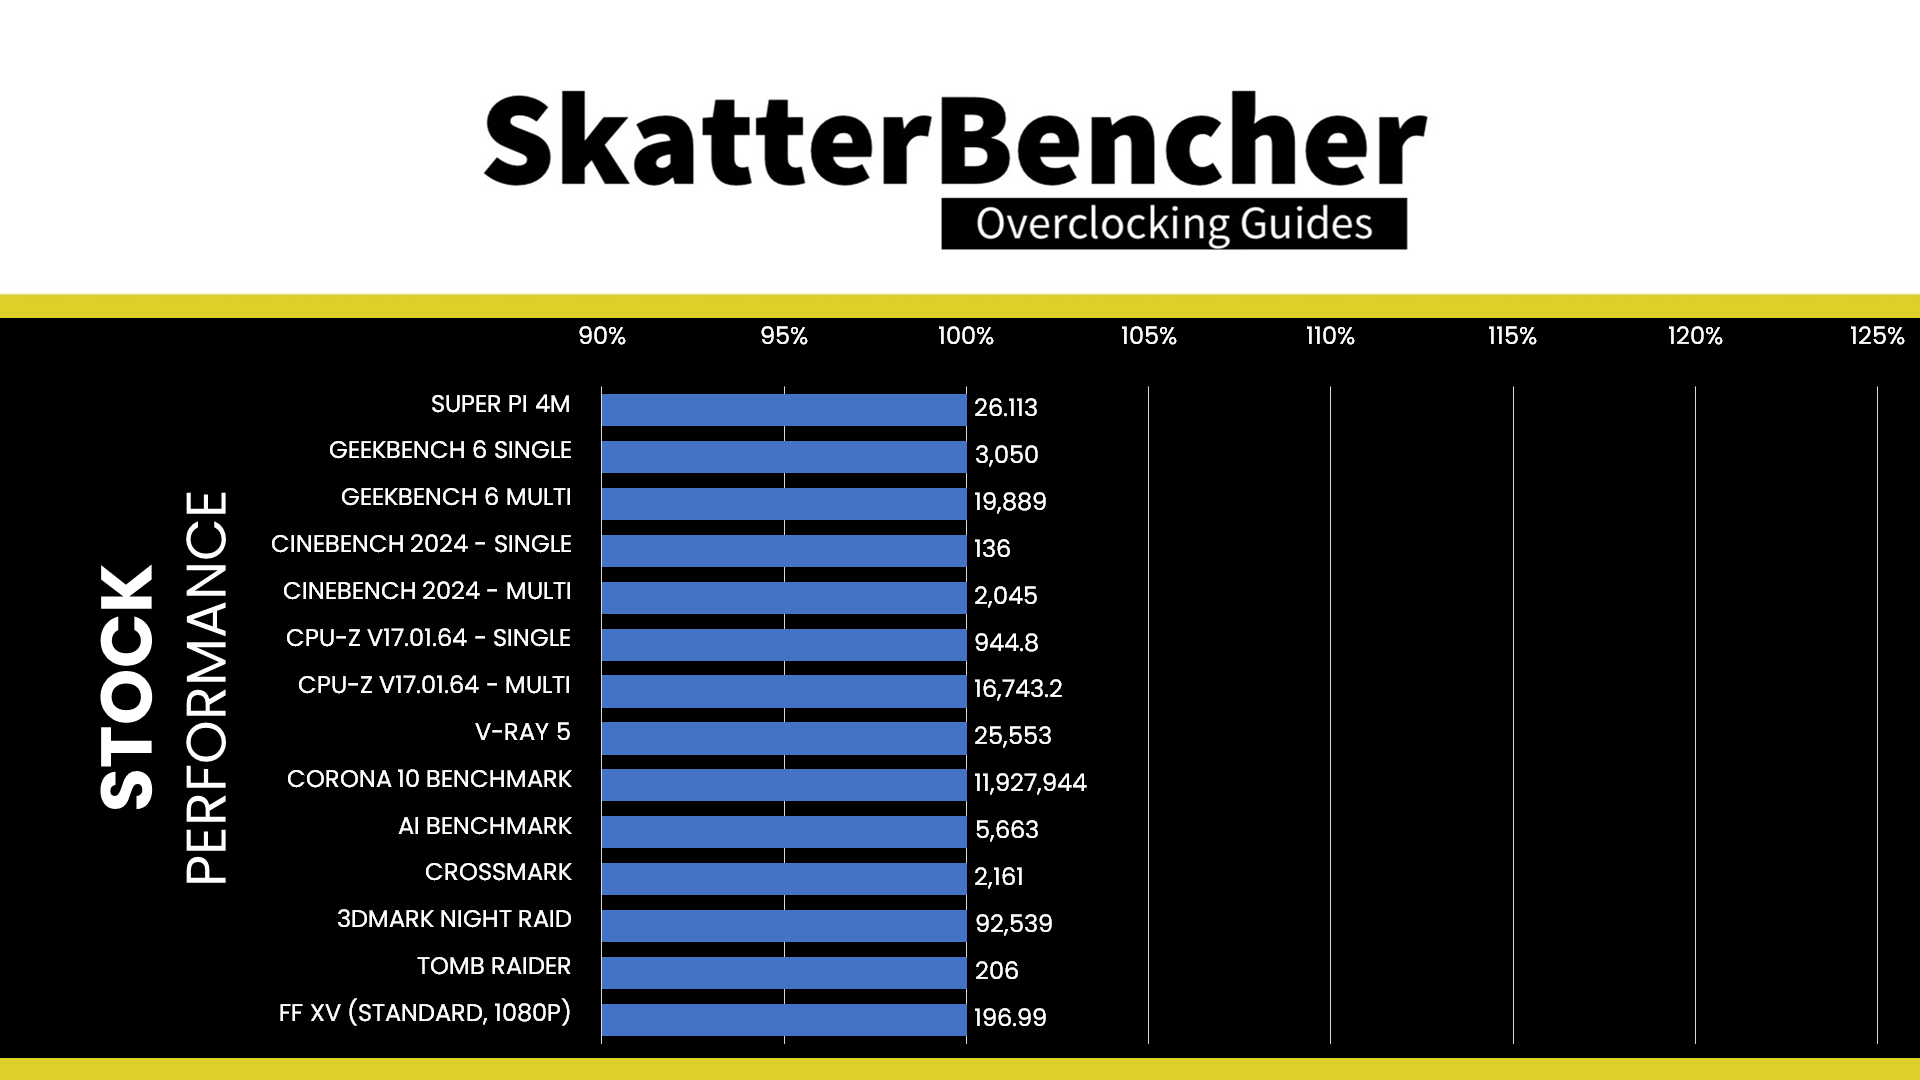
Here is the benchmark performance at stock:
- SuperPI 4M: 26.113 sec
- Geekbench 6 (single): 3,050 points
- Geekbench 6 (multi): 19,889 points
- Cinebench 2024 Single: 136 points
- Cinebench 2024 Multi: 2,045 points
- CPU-Z V17.01.64 Single: 944.8 points
- CPU-Z V17.01.64 Multi: 16,743.2 points
- V-Ray 5: 25,553 vsamples
- Corona Benchmark: 11.93 MRays/sec
- AI Benchmark: 5,663 points
- Crossmark: 2161 points
- 3DMark Night Raid: 92,539 points
- Tom Raider: 206 fps
- Final Fantasy XV: 196.99 fps
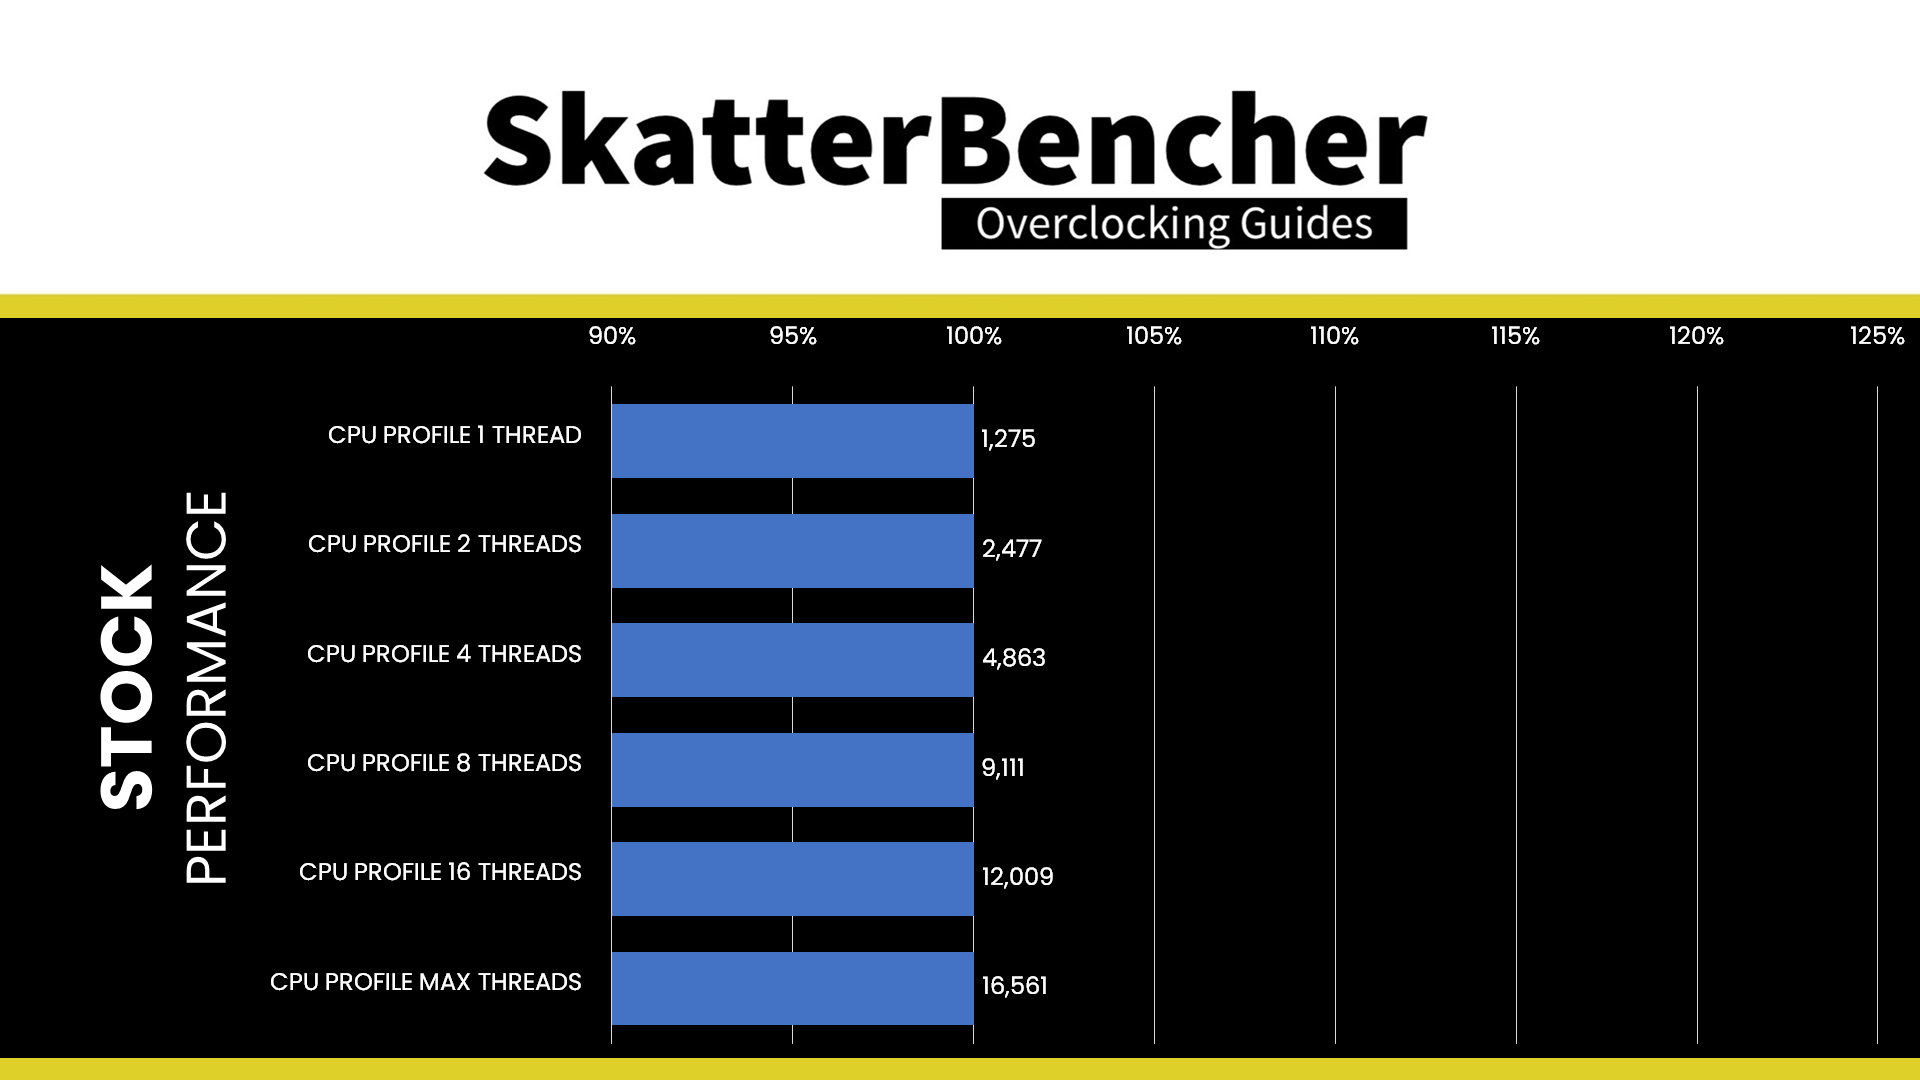
Here are the 3DMark CPU Profile scores at stock
- CPU Profile 1 Thread: 1,275
- CPU Profile 2 Threads: 2,477
- CPU Profile 4 Threads: 4,863
- CPU Profile 8 Threads: 9,111
- CPU Profile 16 Threads: 12,009
- CPU Profile Max Threads: 16,561
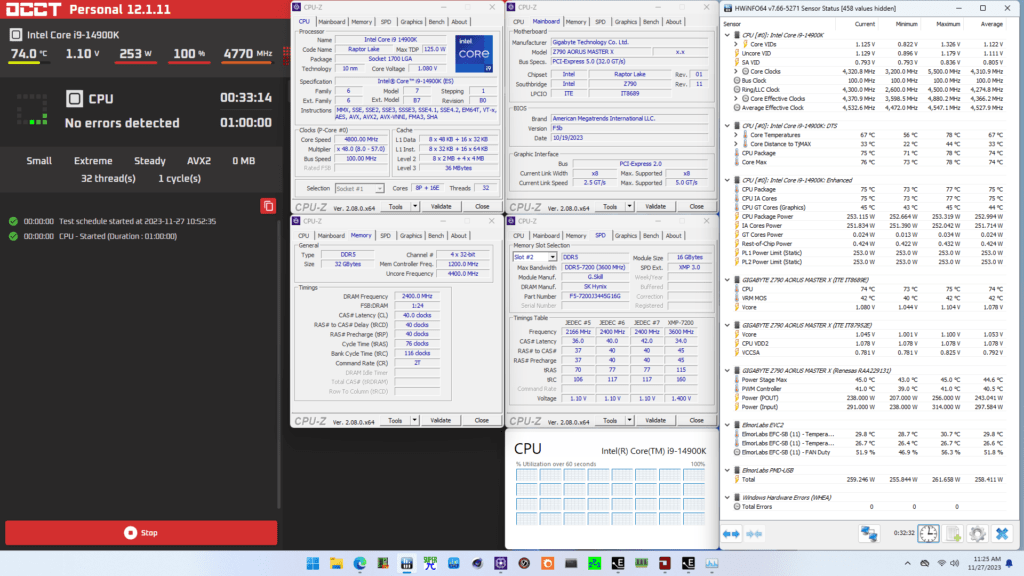
When running the OCCT CPU AVX2 Stability Test, the average CPU P-core effective clock is 4858 MHz, and the average CPU E-core effective clock is 3874 MHz with 1.053 volts. The average CPU temperature is 75 degrees Celsius. The ambient and water temperatures are 26.6 and 29.8 degrees Celsius. The average CPU package power and CPU input power are 253.0 and 258.4 watts.
When running the OCCT CPU SSE Stability Test, the average CPU P-core effective clock is 5049 MHz, and the average CPU E-core effective clock is 3958 MHz with 1.105 volts. The average CPU temperature is 74 degrees Celsius. The ambient and water temperatures are 26.2 and 29.4 degrees Celsius. The average CPU package power and CPU input power are 253.0 and 256.9 watts.

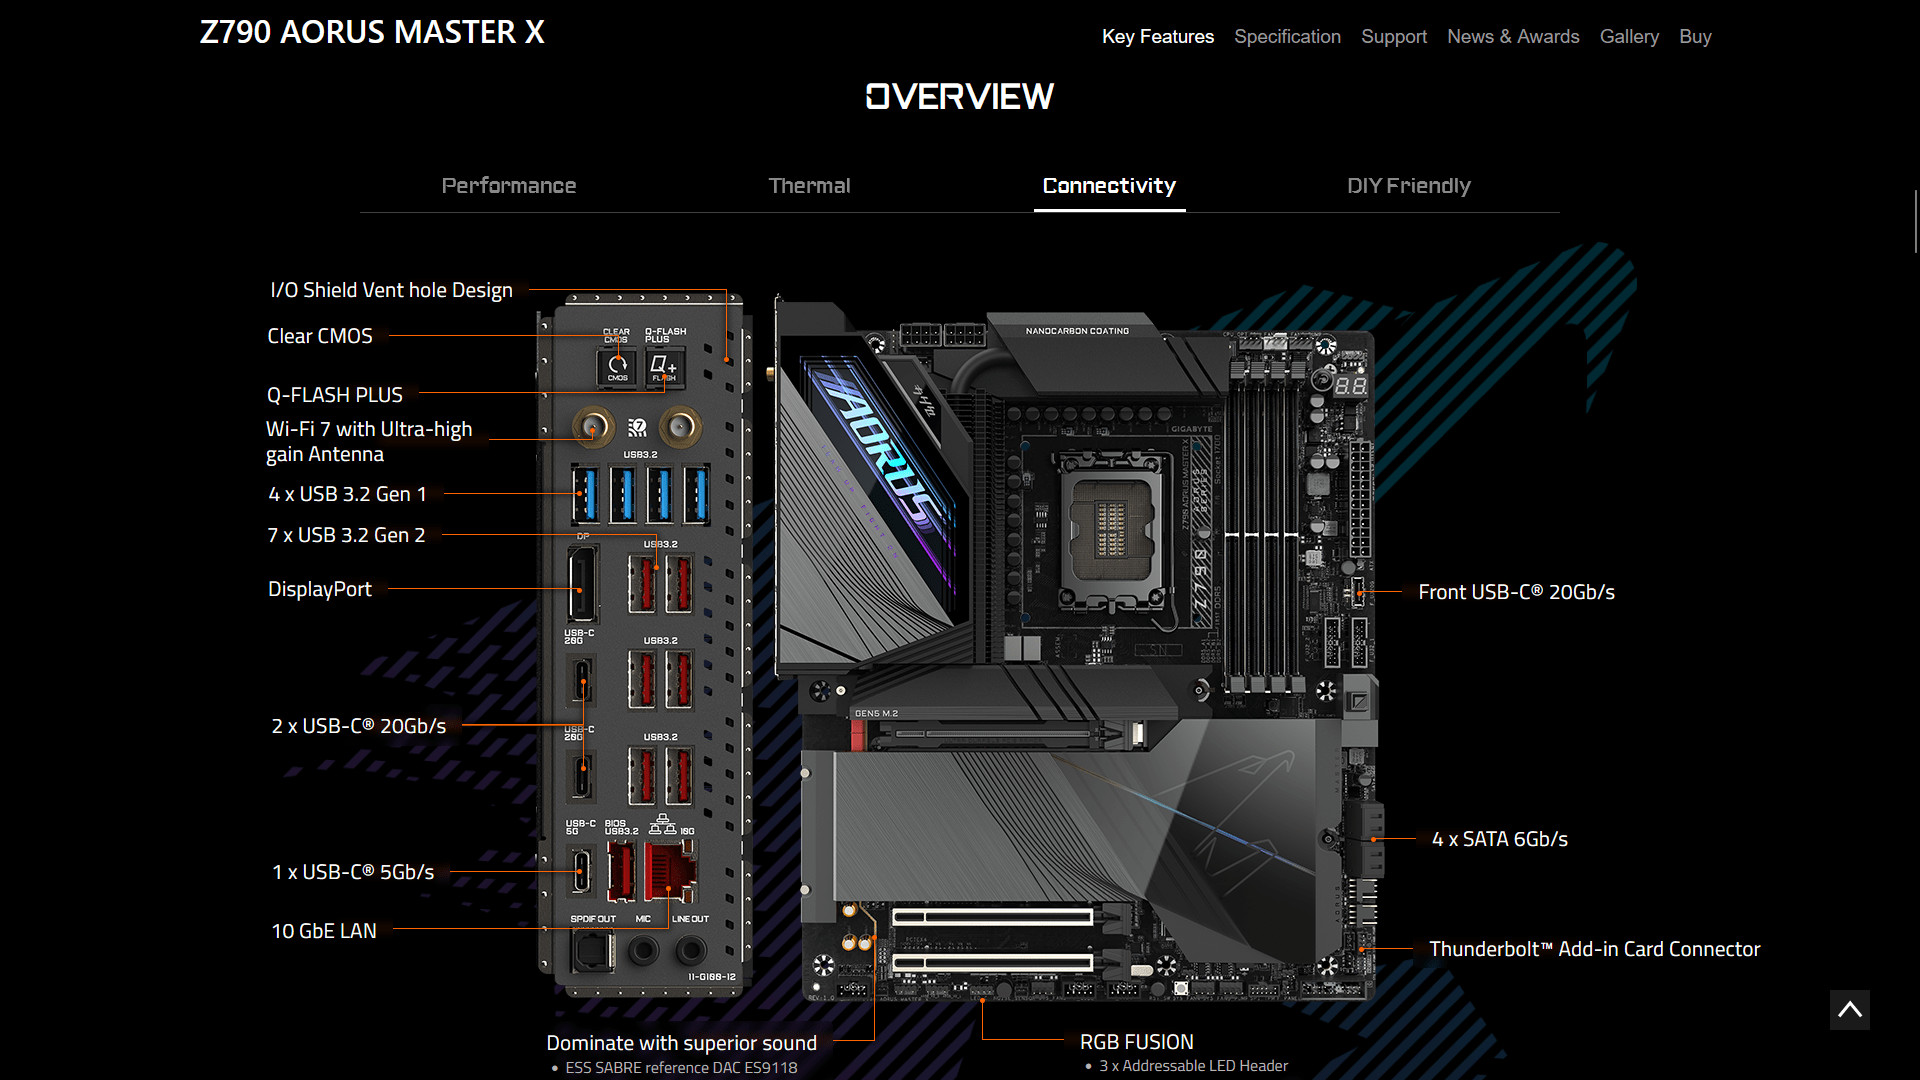
Now, let us try our first overclocking strategy. However, before we get going, make sure to locate the CMOS Clear button.
Pressing the Clear CMOS button will reset all your BIOS settings to default, which is helpful if you want to start your BIOS configuration from scratch. However, it does not delete any of the BIOS profiles previously saved. The Clear CMOS button is located on the rear IO panel.
OC Strategy #1: Unleashed Turbo Boost 2.0 + XMP 3.0
In our first overclocking strategy, we take advantage of unleashing the Turbo Boost 2.0 power limits and Intel XMP 3.0.
Intel Turbo Boost 2.0 Power Limits
Intel Turbo Boost 2.0 Technology allows the processor cores to run faster than the base operating frequency. Turbo Boost is available when the processor works below its rated power, temperature, and current specification limits. The ultimate advantage is opportunistic performance improvements in both multi-threaded and single-threaded workloads.
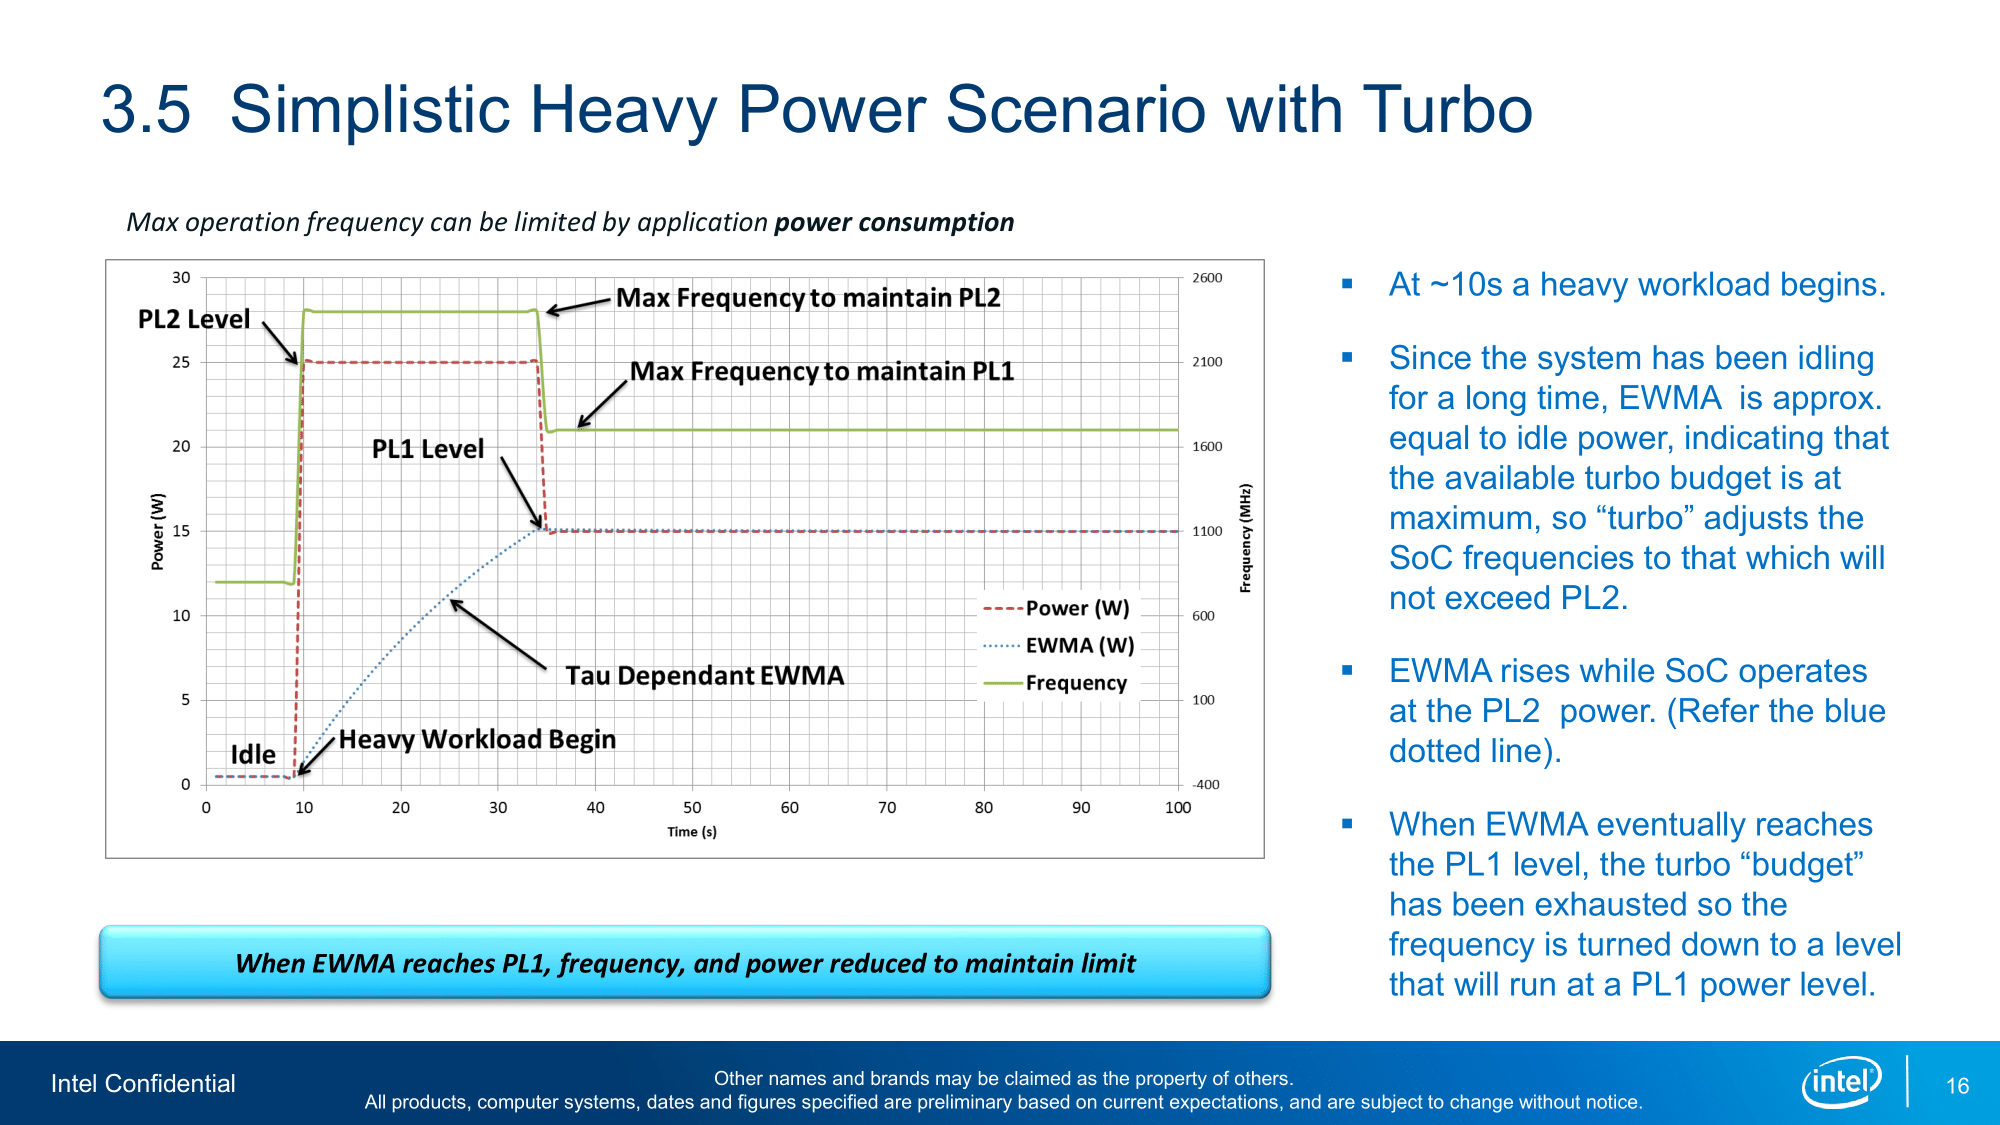
The turbo boost algorithm works according to a proprietary EWMA formula. This stands for Exponentially Weighted Moving Average. There are 3 parameters to consider: PL1, PL2, and Tau.
- Power Limit 1, or PL1, is the threshold the average power will not exceed. Historically, this has always been set equal to Intel’s advertised TDP. PL1 should not be set higher than the thermal solution cooling limits.
- Power Limit 2, or PL2, is the maximum power the processor can use for a limited time.
- Tau, in seconds, is the time window for calculating the average power consumption. The CPU will reduce the CPU frequency if the average power consumed exceeds PL1.
Turbo Boost 2.0 technology is available on Raptor Lake Refresh as it’s the primary performance driver over the base frequency.
Similar to Alder Lake, PL1 is, by default, equal to PL2 for the K-SKU CPUs. This change effectively means that Intel has enabled near-unlimited peak turbo by default! The maximum performance is, therefore, entirely limited by the capabilities of your cooling solution. If your cooling solution is insufficient, the processor will reduce the operating frequency at the maximum allowed temperature or TjMax. For Raptor Lake Refresh CPUs, that’s at 100 degrees Celsius.
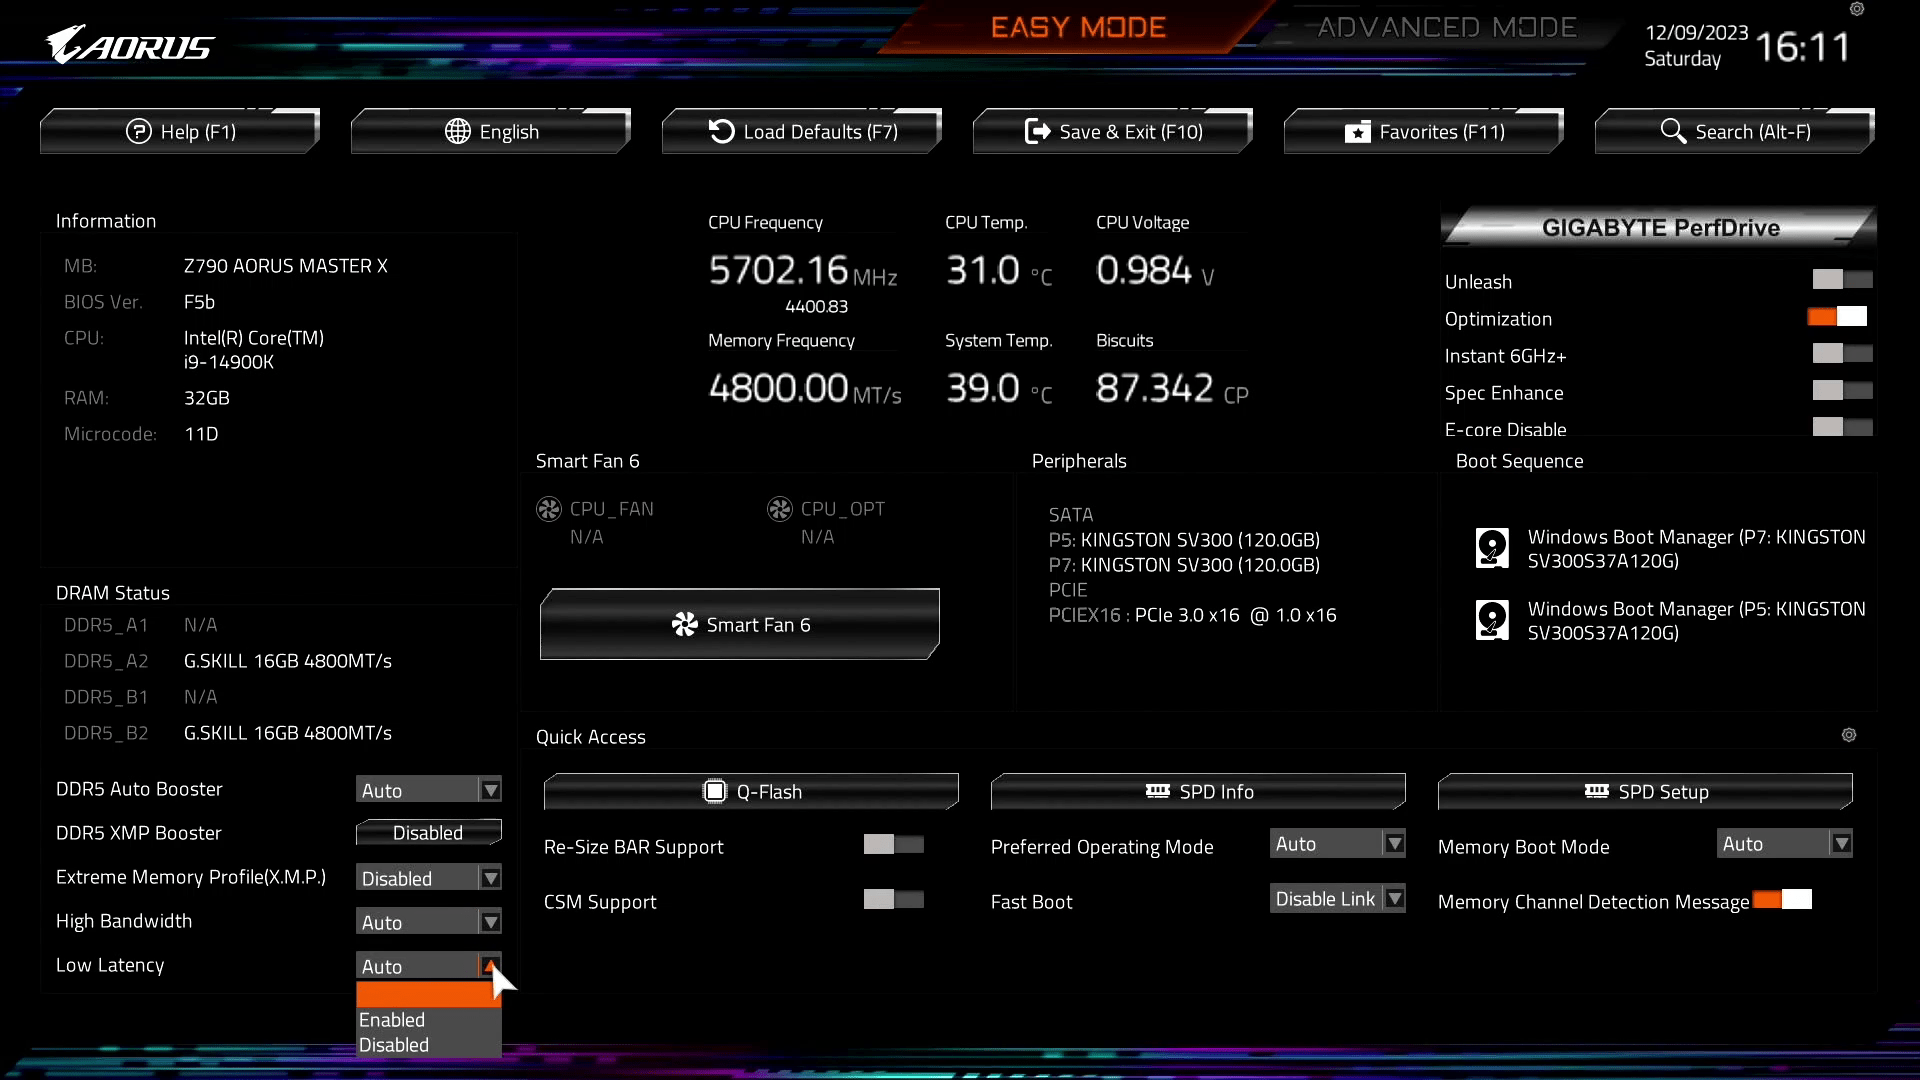
An easy “Unleash” option in GIGABYTE PerfDrive allows you to unlock the Turbo Boost power limits.

Adjusting the power limits is strictly speaking not considered overclocking, as we don’t change the CPU’s thermal, electrical, or frequency parameters. Intel provides the Turbo Boost parameters as guidance to motherboard vendors and system integrators to ensure their designs enable the base performance of the CPU. Better motherboard designs, thermal solutions, and system configurations can facilitate peak performance for longer.
Intel Extreme Memory Profile 3.0
Intel Extreme Memory Profile, or XMP, is an Intel technology that lets you automatically overclock the system memory to improve system performance. It extends the standard JEDEC specification and allows a memory vendor to program different settings onto the memory stick.
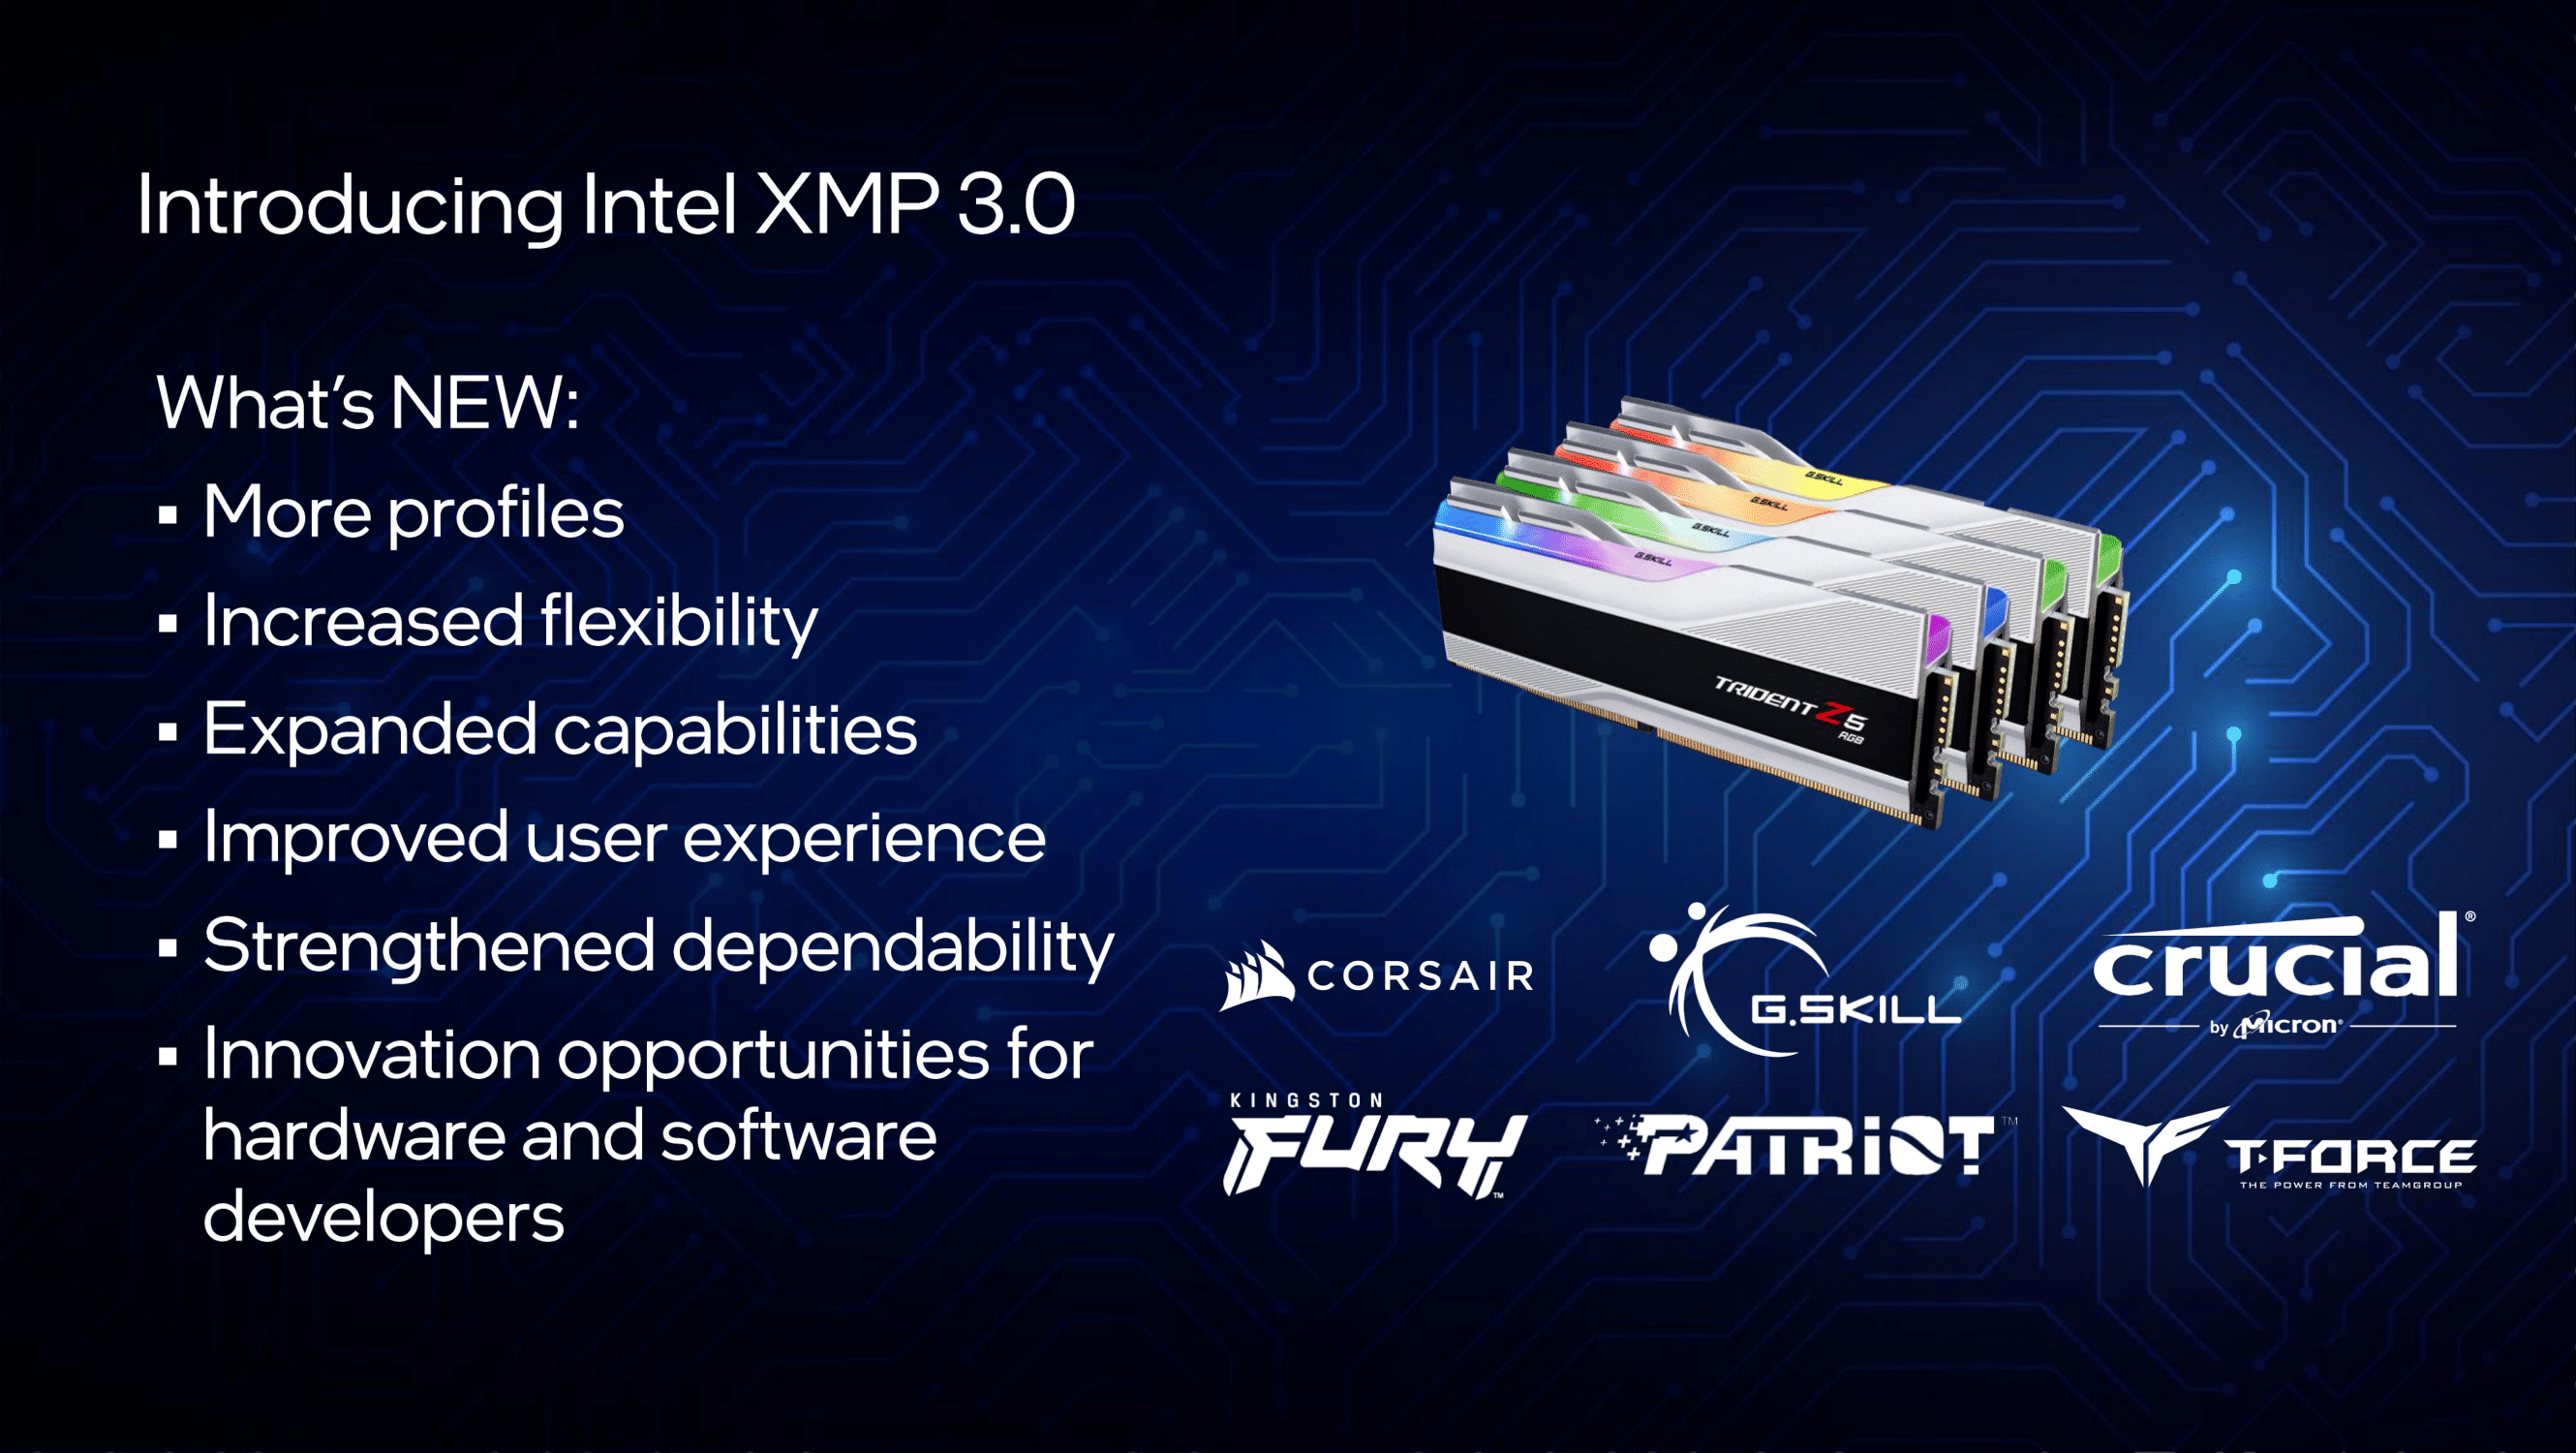
Intel Extreme Memory Profile 3.0 is the new XMP standard for DDR5 memory. It is primarily based on the XMP 2.0 standard for DDR4 but has additional functionality. There’s a lot more to the new XMP 3.0 standard, which is outside the scope of this overclocking guide. Check out my Alder Lake launch content if you want more details about XMP 3.0.
BIOS Settings & Benchmark Results
Upon entering the BIOS
- Switch to Advanced Mode
- In the Tweaker menu
- Set GIGABYTE PerfDrive to Unleash
- Enter the Advanced CPU settings submenu
- Set AVX Settings to User Defined
- Set AVX Optimum to Enabled
- Set AVX Settings to User Defined
- Leave the Advanced CPU Settings submenu
- Set Extreme Memory Profile(X.M.P.) to XMP 1
Then save and exit the BIOS.
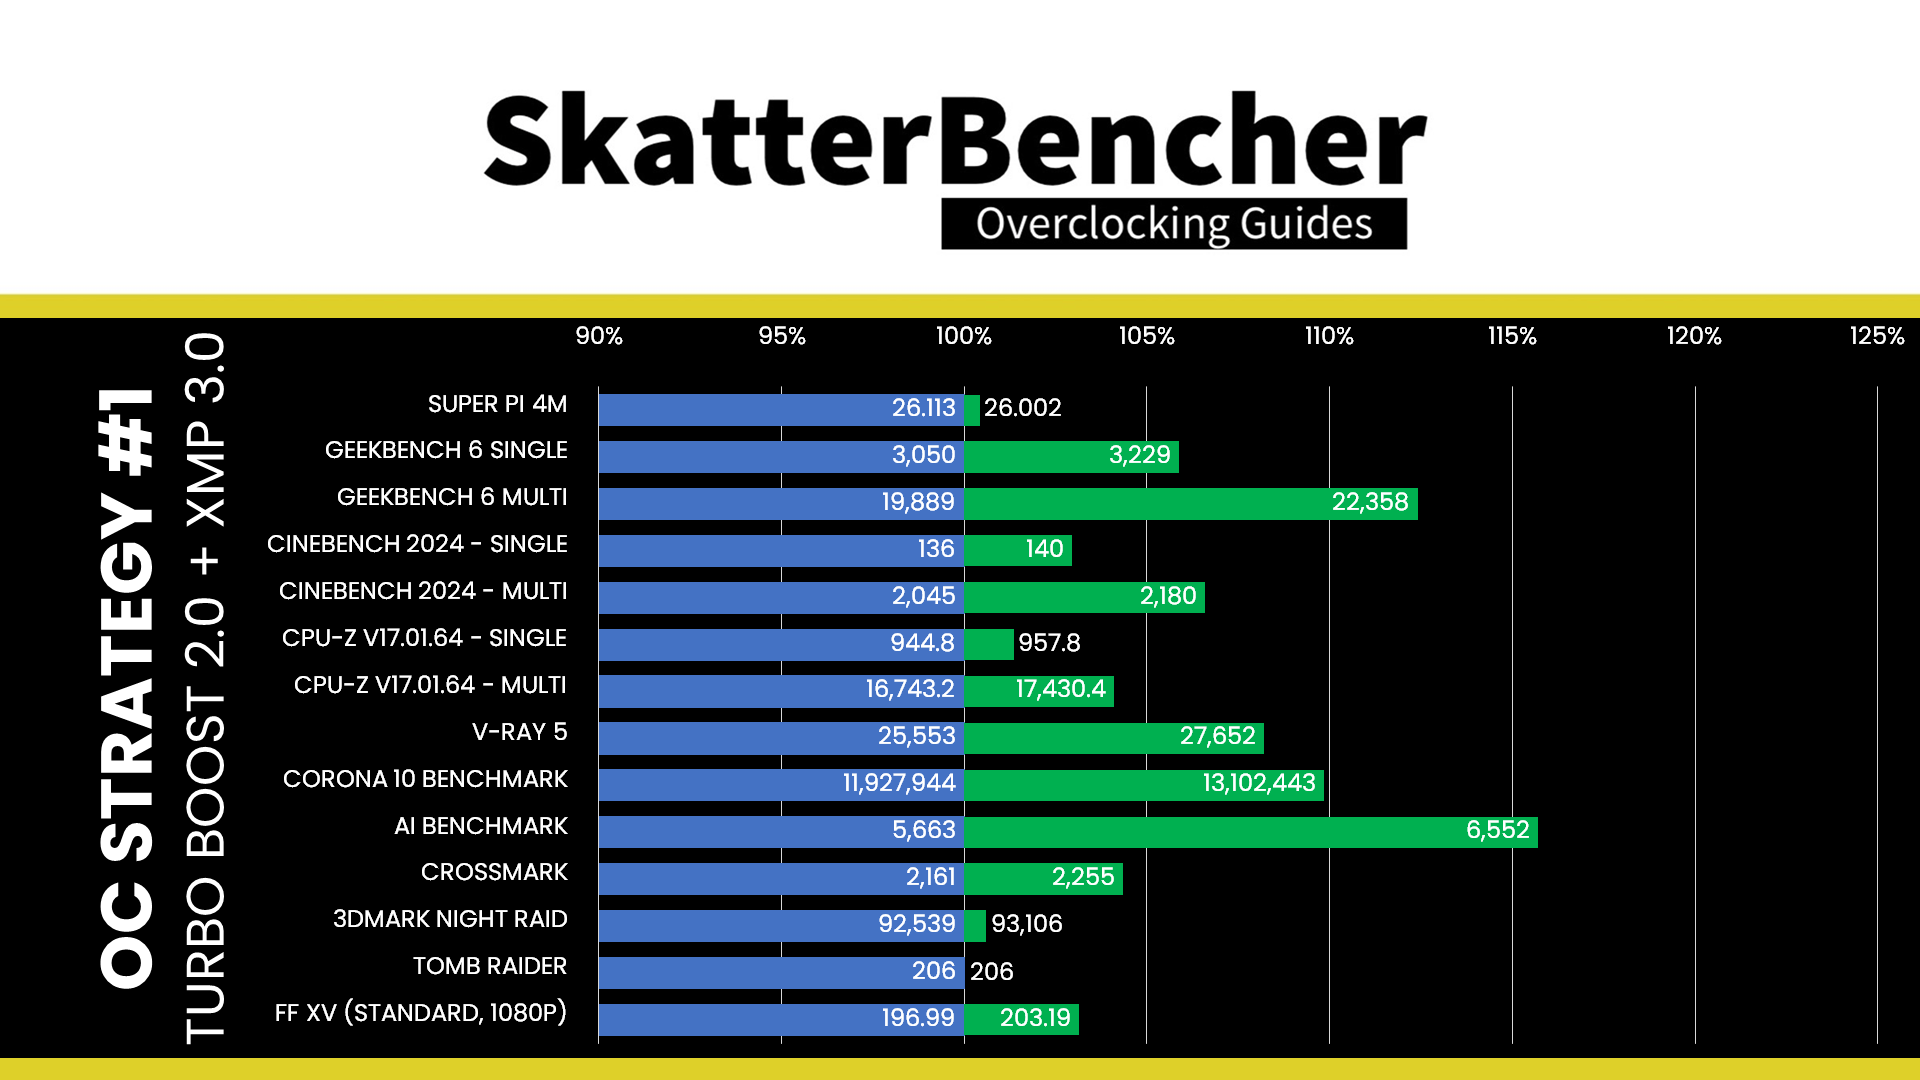
We re-ran the benchmarks and checked the performance increase compared to the default operation.
- SuperPI 4M: +0.43%
- Geekbench 6 (single): +5.87%
- Geekbench 6 (multi): +12.41%
- Cinebench 2024 Single: +2.94%
- Cinebench 2024 Multi: +6.60%
- CPU-Z V17.01.64 Single: +1.38%
- CPU-Z V17.01.64 Multi: +4.10%
- V-Ray 5: +8.21%
- Corona Benchmark: +9.85%
- AI Benchmark: +15.70%
- Crossmark: +4.35%
- 3DMark Night Raid: +0.61%
- Tom Raider: +0.00%
- Final Fantasy XV: +3.15%
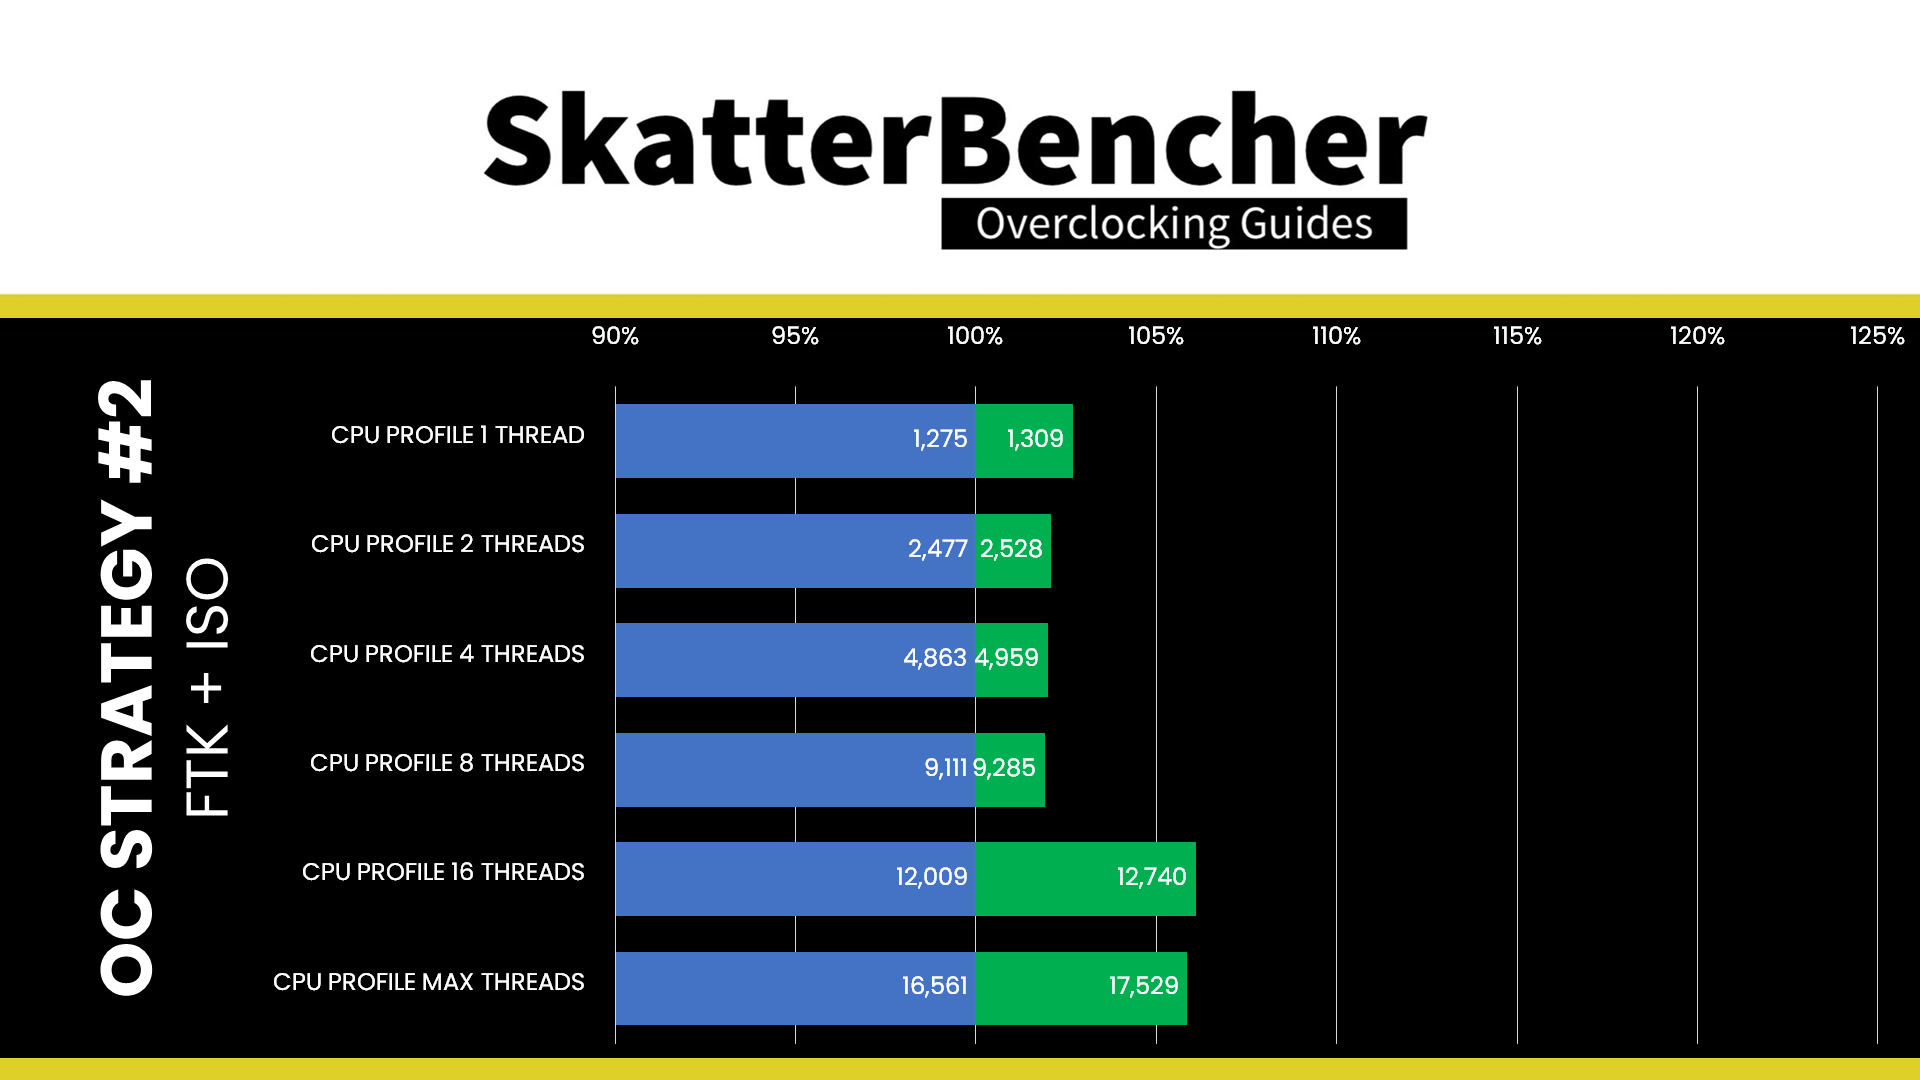
Here are the 3DMark CPU Profile scores:
- CPU Profile 1 Thread: +0.78%
- CPU Profile 2 Threads: +0.89%
- CPU Profile 4 Threads: +0.08%
- CPU Profile 8 Threads: +0.90%
- CPU Profile 16 Threads: +0.37%
- CPU Profile Max Threads: +4.31%

As expected, since we’re not increasing the frequency of the CPU cores, the performance improvement is relatively limited. That said, improving the memory performance by using XMP 3.0 and providing more headroom for power consumption helps improve performance in specific workloads. We see the highest performance improvement of +15.70% in AI Benchmark.
When running the OCCT CPU AVX2 Stability Test, the average CPU P-core effective clock is 5309 MHz, and the average CPU E-core effective clock is 4234 MHz with 1.188 volts. The average CPU temperature is 100 degrees Celsius. The ambient and water temperatures are 28.2 and 32.3 degrees Celsius. The average CPU package power and CPU input power are 376.9 and 398.7 watts.

When running the OCCT CPU SSE Stability Test, the average CPU P-core effective clock is 5478 MHz, and the average CPU E-core effective clock is 4221 MHz with 1.234 volts. The average CPU temperature is 100 degrees Celsius. The ambient and water temperatures are 27.4 and 31.7 degrees Celsius. The average CPU package power and CPU input power are 372.0 and 390.2 watts.

OC Strategy #2: ISO Overclocking + XMP 3.0
In our second overclocking strategy, we use the Intel Speed Optimizer feature integrated into the Foundation Toolkit software.
Foundation Toolkit & Intel Speed Optimizer
I talked a little about the Foundation Toolkit software in another post on this website. To make a long story short, Foundation Toolkit is a CPU silicon customization software co-developed by Matthias from BenchMate and myself. While we have big hopes and dreams for the application, the Foundation Toolkit currently exclusively integrates the Intel® Extreme Tuning Utility (Intel® XTU).
The Foundation toolkit enables precise CPU performance tuning and caters to Intel K-SKU CPU users. Currently, the application is publicly available for anyone to try. However, please be aware that the Foundation software presently offers limited functionality. The toolkit consists of four primary tools:
- Monitoring the system
- Simple overclocking with Intel Speed Optimizer
- Advanced overclocking with the Foundation OC knobs
- Running the Supermassive workload
We use the Intel Speed Optimizer function in this OC Strategy.
Intel Speed Optimizer, or ISO, is a performance-enhancing technology embedded in the Intel Extreme Tuning Utility software. Its primary purpose is to simplify overclocking. If your processor supports ISO, you can enable higher performance by clicking a single button. ISO should stay enabled even after rebooting the system.

Note that you cannot do manual tuning after enabling ISO. If you want to manually tune your CPU, you must disable ISO.
After enabling ISO on this 14900K processors, the following settings have changed:
- +1 Turbo Bin for P-cores and E-cores
- Set Turbo Boost 2.0 PL1 and PL2 to 450W
- Set AVX2 offset to 0
- Enable Overclocking Thermal Velocity Boost
- -1 Ratio Offset for all Turbo Boost scenarios at 80 degrees Celsius
- -1 Ratio Offset for 1- and 2-active P-core scenarios at 90 degrees Celsius
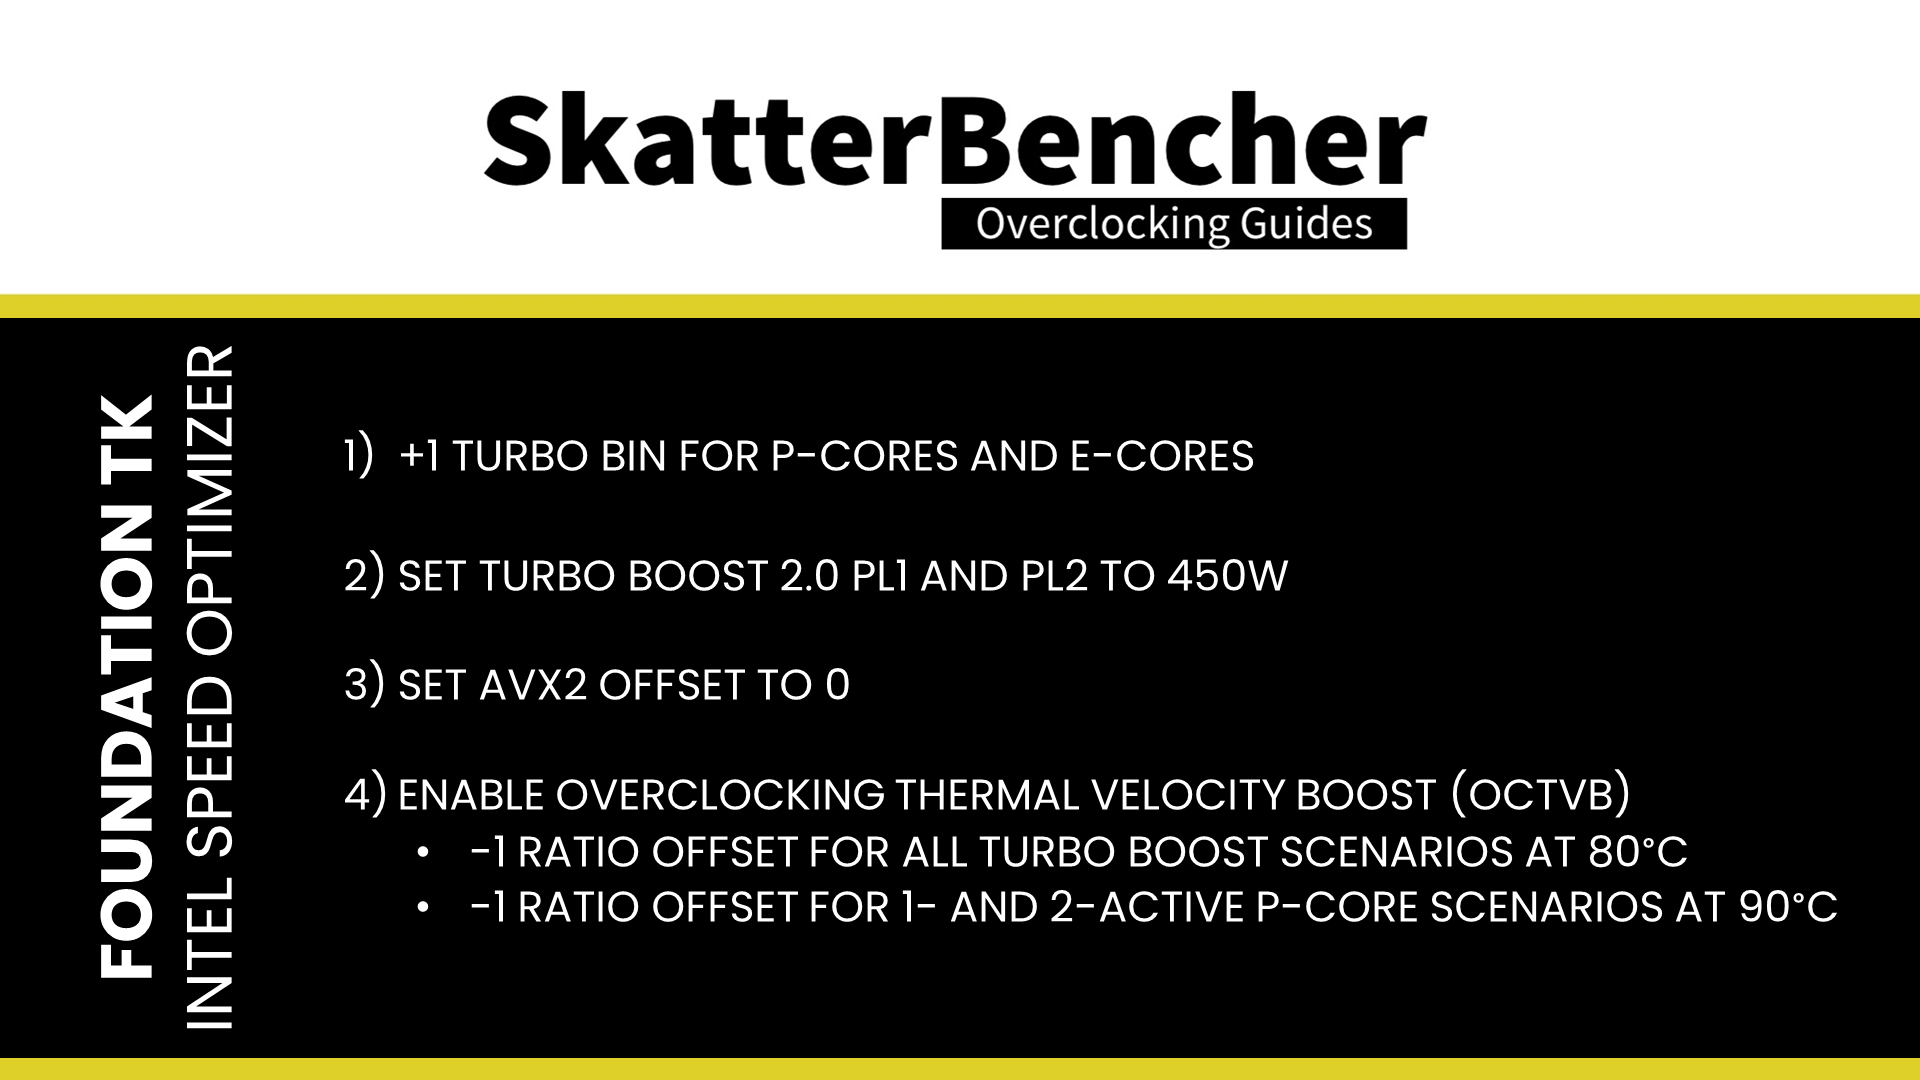
As you can see, ISO relies primarily on enabling higher power limits and slightly boosting the CPU core frequency to improve performance. The OCTVB configuration ensures default CPU performance above 90 degrees Celsius.
BIOS Settings & Benchmark Results
First, go into the BIOS, and
- In Easy Mode
- Set Extreme Memory Profile(X.M.P.) to XMP1
Then save and exit the BIOS, and reboot the system. Upon entering the operating system
- Go to the Foundation Toolkit website
- Make sure to install the software
- Browse to the ISO tab
- Click Enable Optimizer
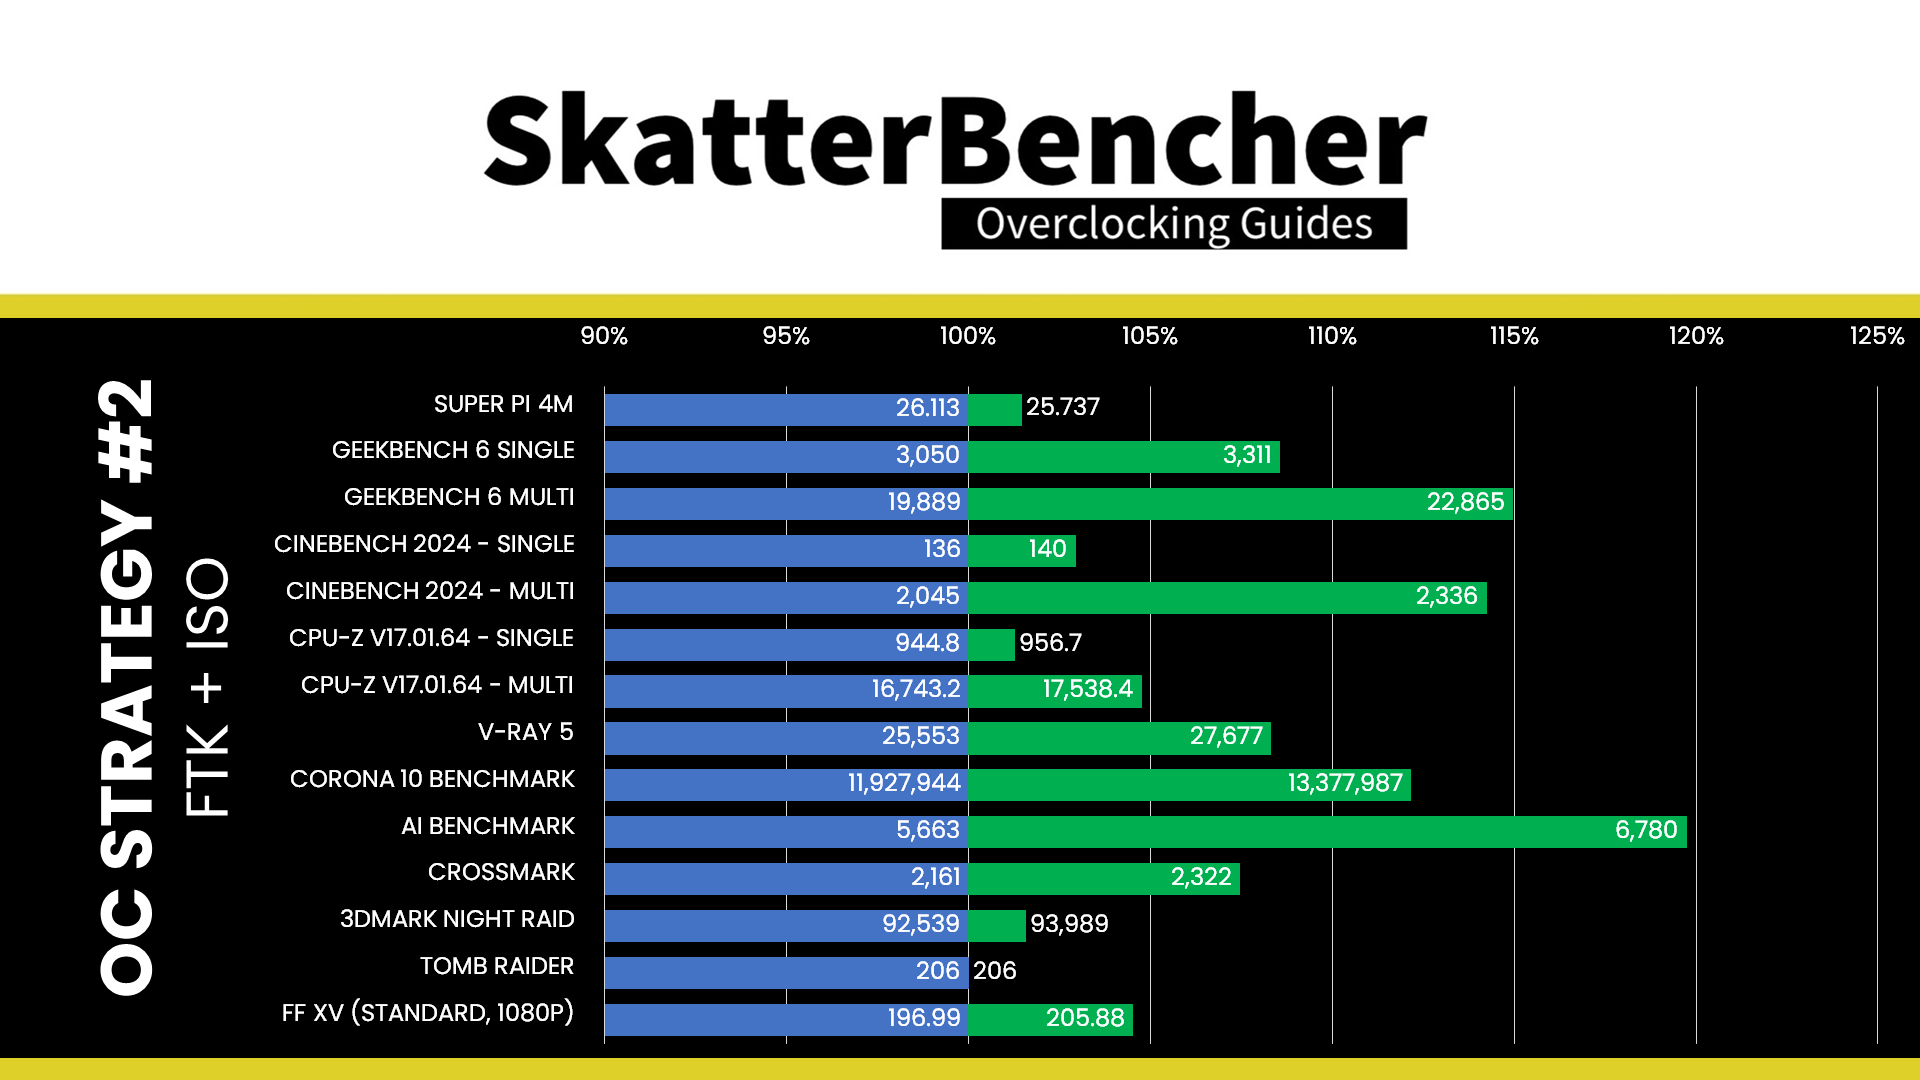
We re-ran the benchmarks and checked the performance increase compared to the default operation.
- SuperPI 4M: +1.46%
- Geekbench 6 (single): +8.56%
- Geekbench 6 (multi): +14.96%
- Cinebench 2024 Single: +2.94%
- Cinebench 2024 Multi: +14.23%
- CPU-Z V17.01.64 Single: +1.26%
- CPU-Z V17.01.64 Multi: +4.75%
- V-Ray 5: +8.31%
- Corona Benchmark: +12.16%
- AI Benchmark: +19.72%
- Crossmark: +7.45%
- 3DMark Night Raid: +1.57%
- Tom Raider: +0.00%
- Final Fantasy XV: +4.51%
Here are the 3DMark CPU Profile scores:
- CPU Profile 1 Thread: +2.67%
- CPU Profile 2 Threads: +2.06%
- CPU Profile 4 Threads: +1.97%
- CPU Profile 8 Threads: +1.91%
- CPU Profile 16 Threads: +6.09%
- CPU Profile Max Threads: +5.85%
The extra bump in frequency helps add a little more performance in both light single-threaded workloads and heavy all-core workloads. We see the highest performance improvement of +19.72% in AI Benchmark.
When running the OCCT CPU AVX2 Stability Test, the average CPU P-core effective clock is 5282 MHz, and the average CPU E-core effective clock is 4226 MHz with 1.187 volts. The average CPU temperature is 100 degrees Celsius. The ambient and water temperatures are 28.6 and 32.6 degrees Celsius. The average CPU package power and CPU input power are 373.8 and 395.8 watts.
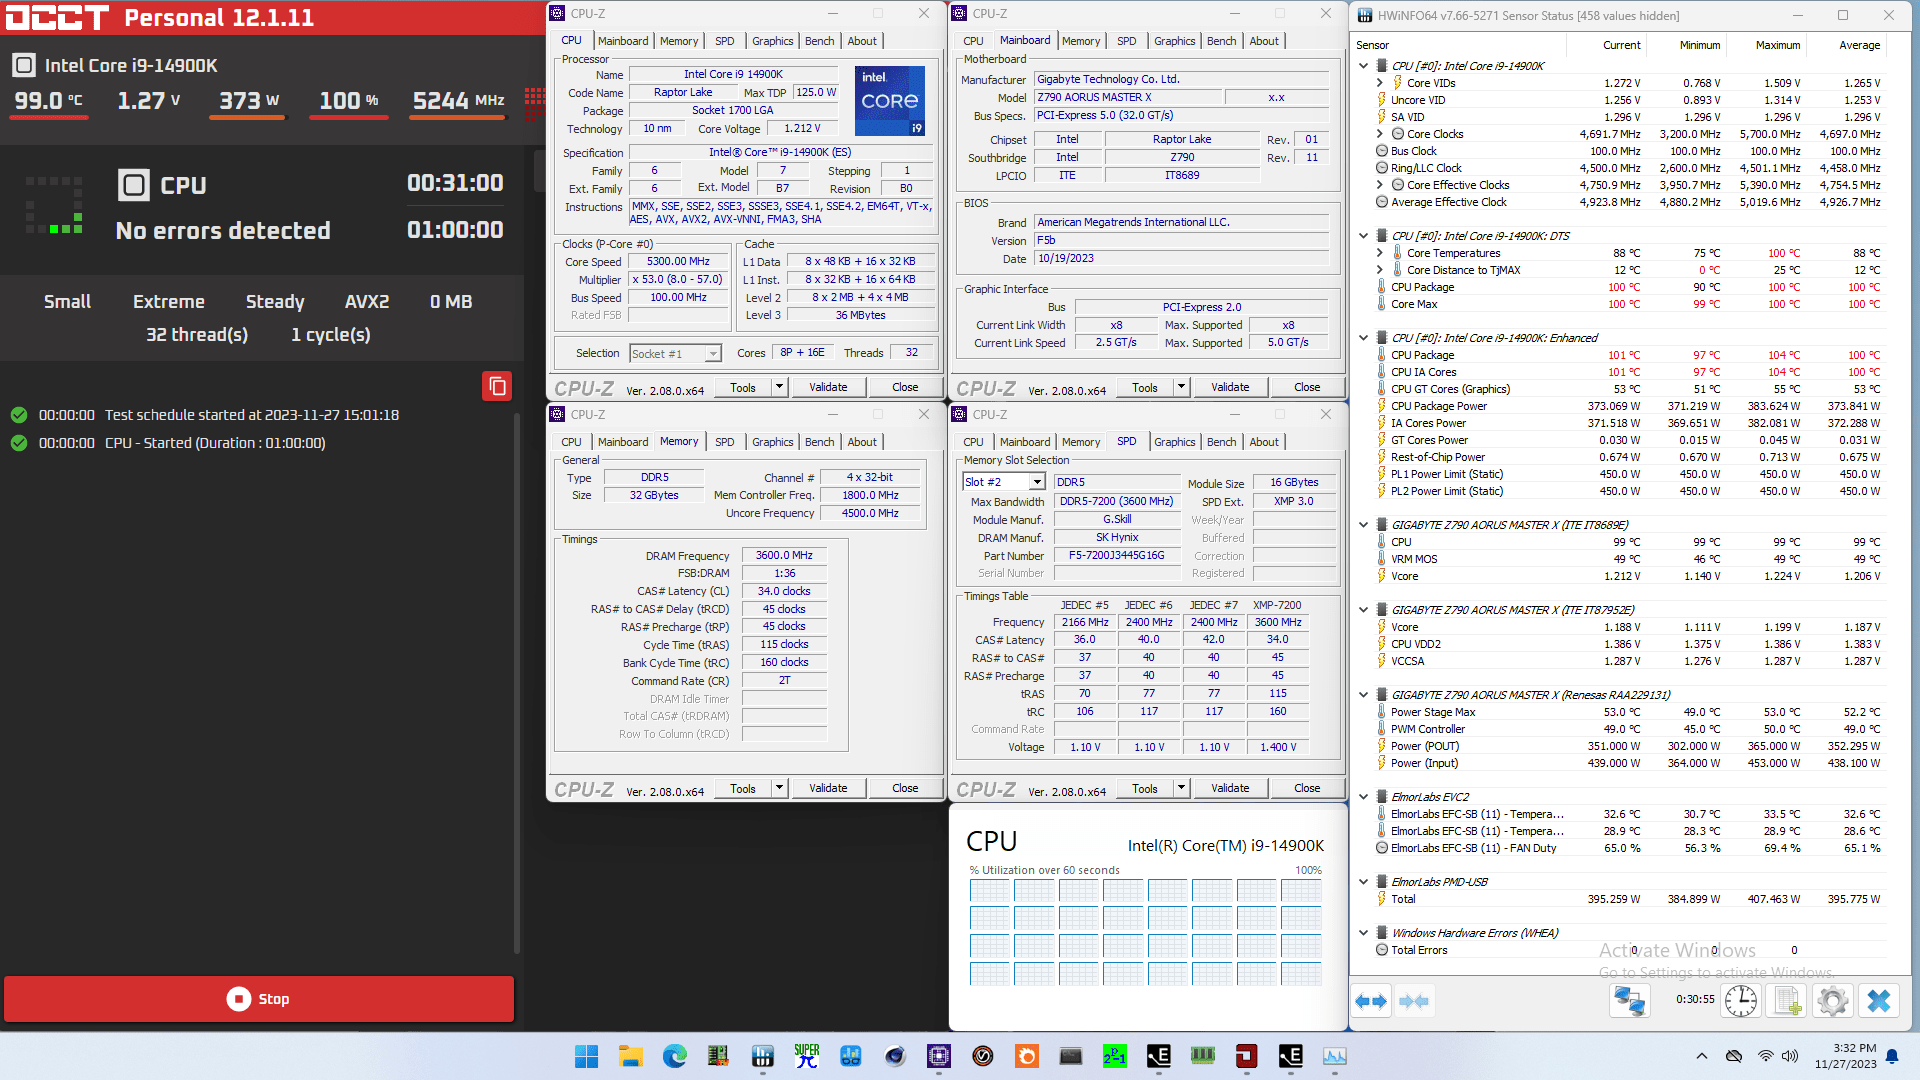
When running the OCCT CPU SSE Stability Test, the average CPU P-core effective clock is 5446 MHz, and the average CPU E-core effective clock is 4292 MHz with 1.227 volts. The average CPU temperature is 100 degrees Celsius. The ambient and water temperatures are 27.9 and 32.1 degrees Celsius. The average CPU package power and CPU input power are 368.3 and 386.4 watts.

OC Strategy #3: Simple Manual Overclock
In our third overclocking strategy, we will pursue a simple manual overclock. The approach is centered around two key actions:
- Trying to increase the CPU core frequency where possible, and
- Trying to undervolt the CPU V/F curve where possible.
In this OC Strategy, I will not dig into too many details and let most of the motherboard auto-rules do the heavy lifting regarding voltage configuration. We will look closer at the voltages in the next OC Strategy.
Intel Turbo Boost 2.0 CPU Ratios
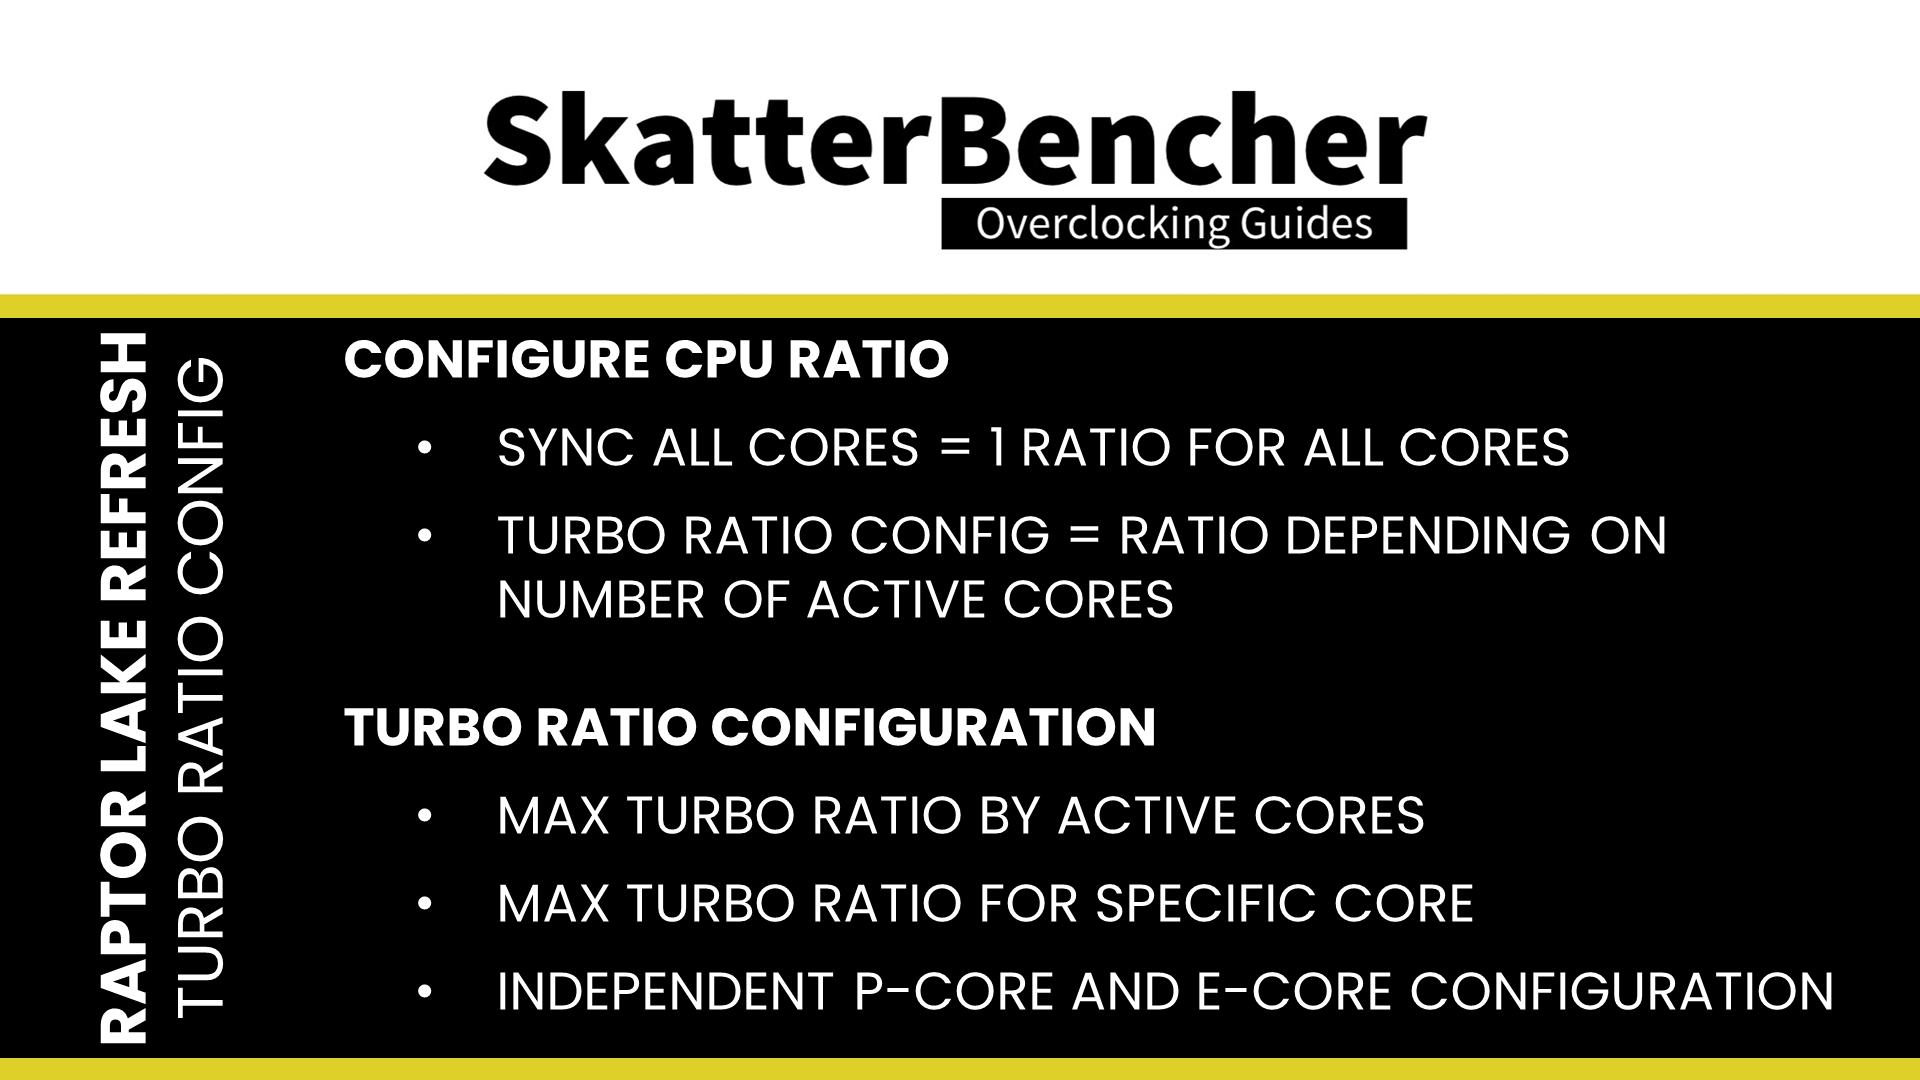
Generally speaking, there are two ways to manually configure the CPU ratio on Intel platforms: sync all cores or use the turbo CPU ratio configuration. Sync All Cores sets a single fixed ratio applied to all cores. This is very much the historical way of Intel CPU overclocking. Turbo Ratio configuration allows us to modify the default Intel frequency specification and configure an overclock for various scenarios.
Before we go any further, there are three critical elements of understanding any Turbo Ratio configuration:
- You can configure the maximum allowed CPU core ratio for any number of active cores
- You can configure the maximum allowed CPU core ratio for a given CPU core
- The turbo ratio configuration for P-core and E-cores is independent.
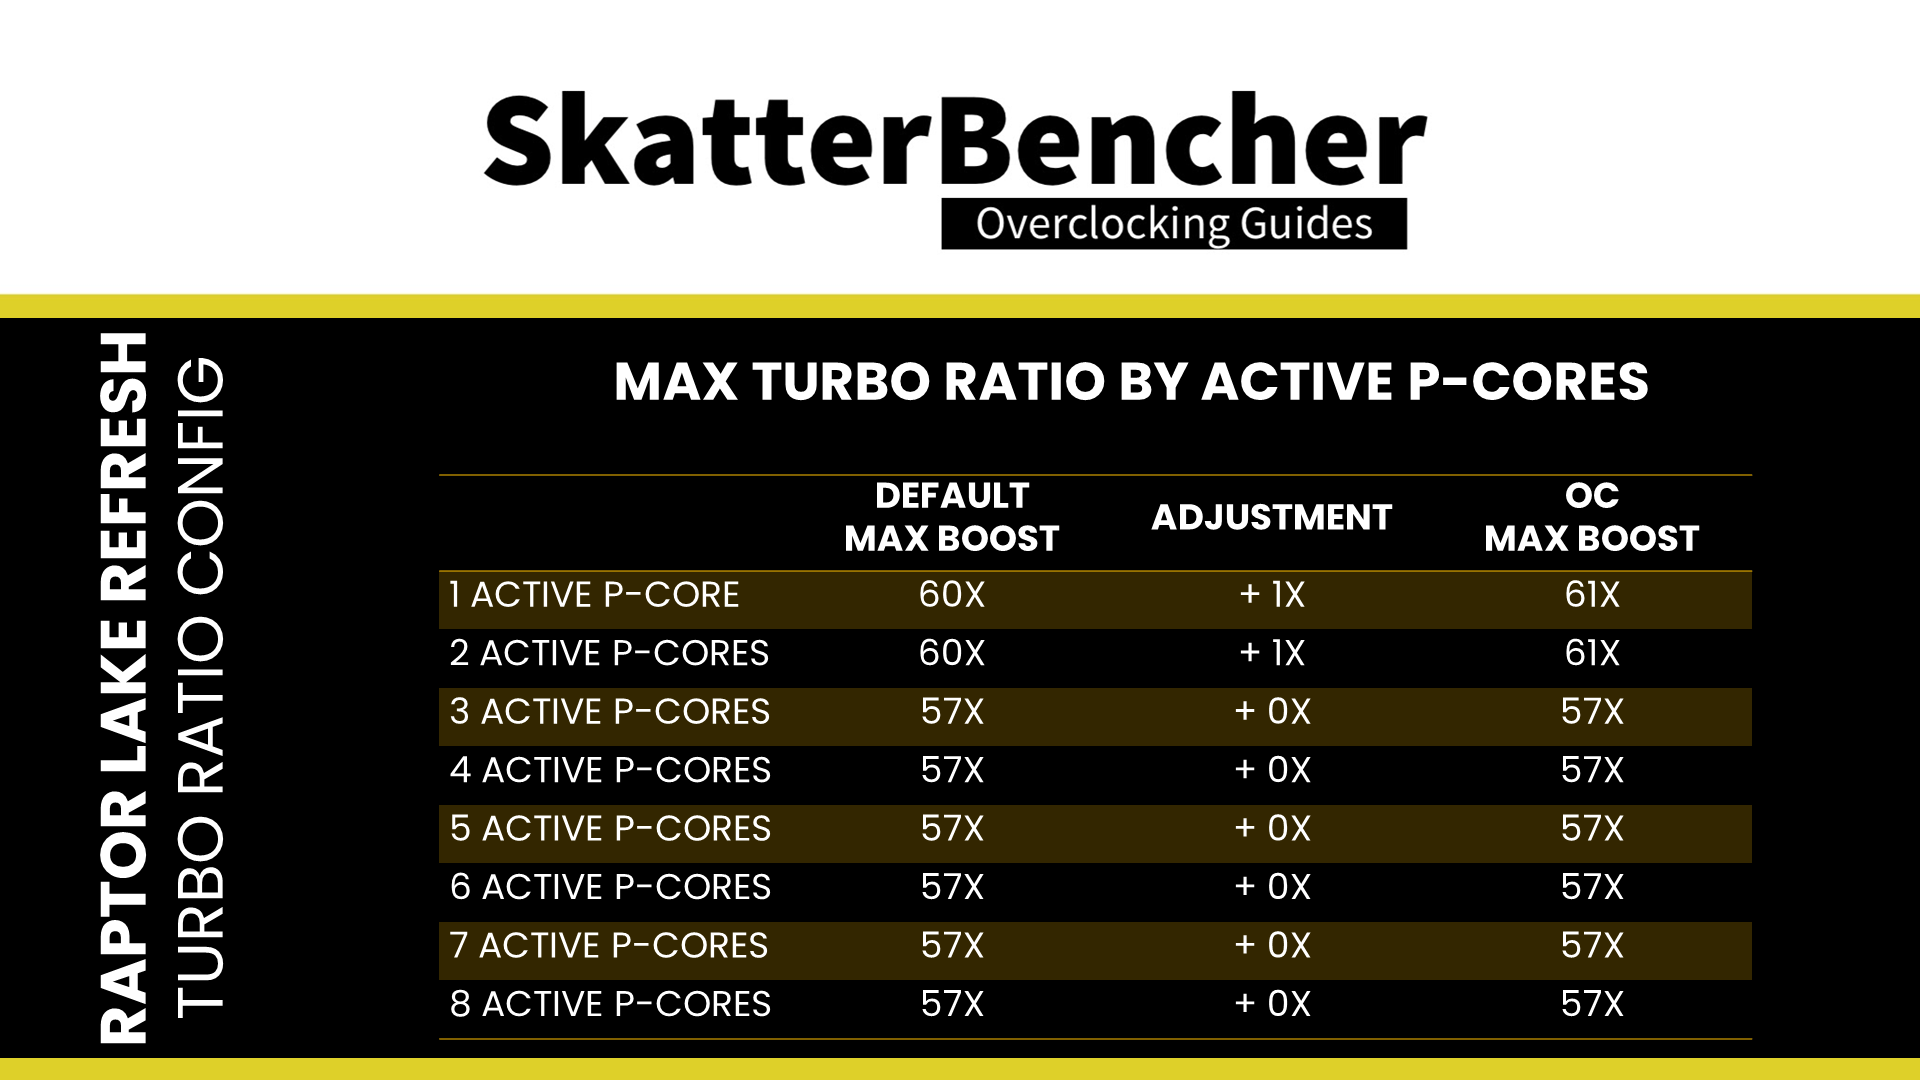
To explain the first point, let’s take the default configuration of the 14900K. The 14900K has a total of 8 P-cores. Therefore, we can configure the maximum allowed P-core ratio for when 1 P-core is active, when 2 P-cores are active, all the way up to when 8 P-cores are active. The standard configuration allows every P-Core to boost to 5.7 GHz when all cores are active.
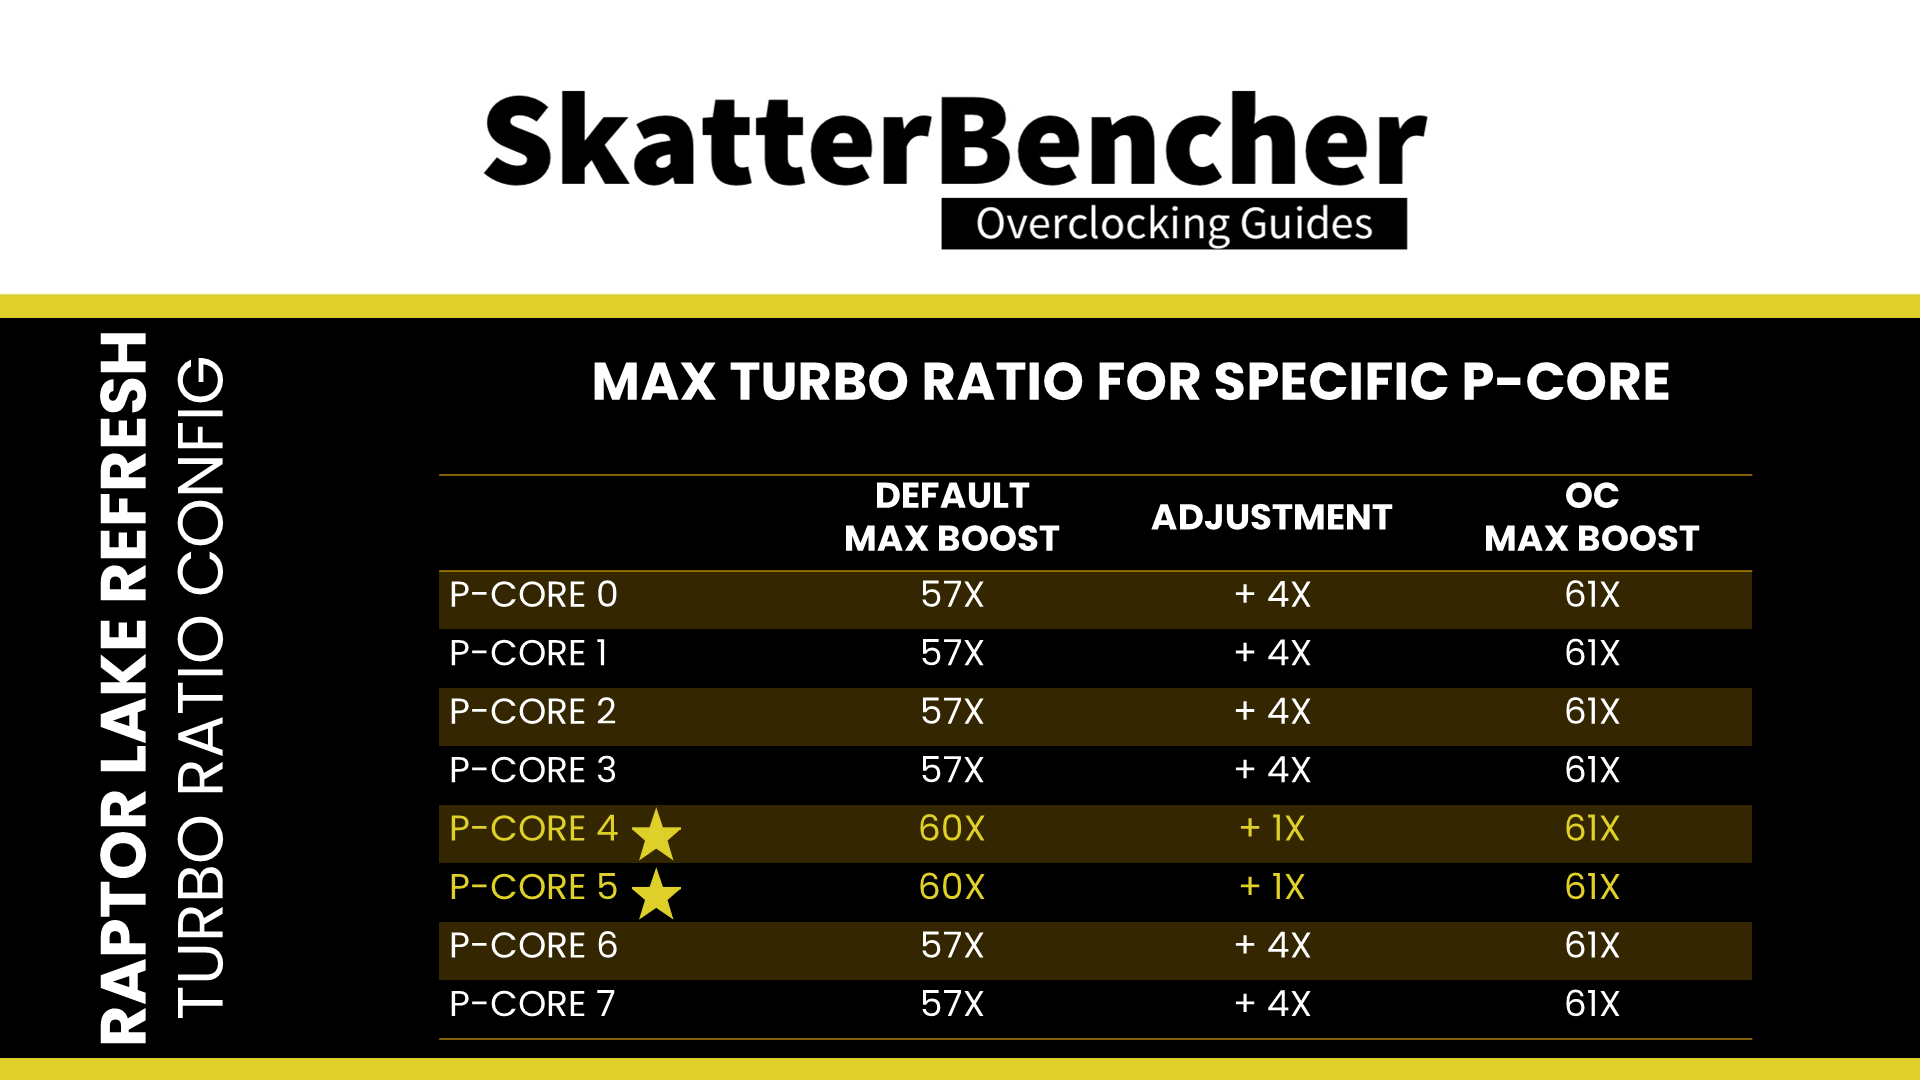
In our overclock, we adjust the Turbo Ratio configuration to boost
- to 6.1 GHz when up to 6 P-cores are active,
- to 5.7 GHz when up to 8 P-cores are active.
To explain the second point, let’s consider the 14900K default specification again. While the 14900K has 8 identical P-cores, two of those cores are called the favored cores. The maximum allowed frequency for the favored cores is 6.0 GHz, whereas the others are limited to 5.7 GHz.
Often, we use the Per Core Ratio limit to prevent the weaker cores from boosting to the highest frequency. In this strategy, we let all cores boost to the maximum 6.1 GHz, so I’ll cover the Per Core Ratio Limit function in the next overclocking strategy.
To explain the third point, again, let’s refer to the 14900K specification. The CPU has a total of eight P-cores and sixteen E-cores. While the P-cores can boost up to 6.0 GHz, the E-cores can only boost up to 4.4 GHz.
The P-core rules for the maximum allowed frequency can also be applied to the E-cores. However, with one major caveat: the E-core CPU ratio can only be controlled in groups of 4 E-cores. So, for the 14900K, since it has sixteen E-cores in total, we can configure the maximum allowed core ratio for four groups of four E-cores. However, we can still configure the maximum allowed frequency for 1 active E-core up to 16 active E-cores.
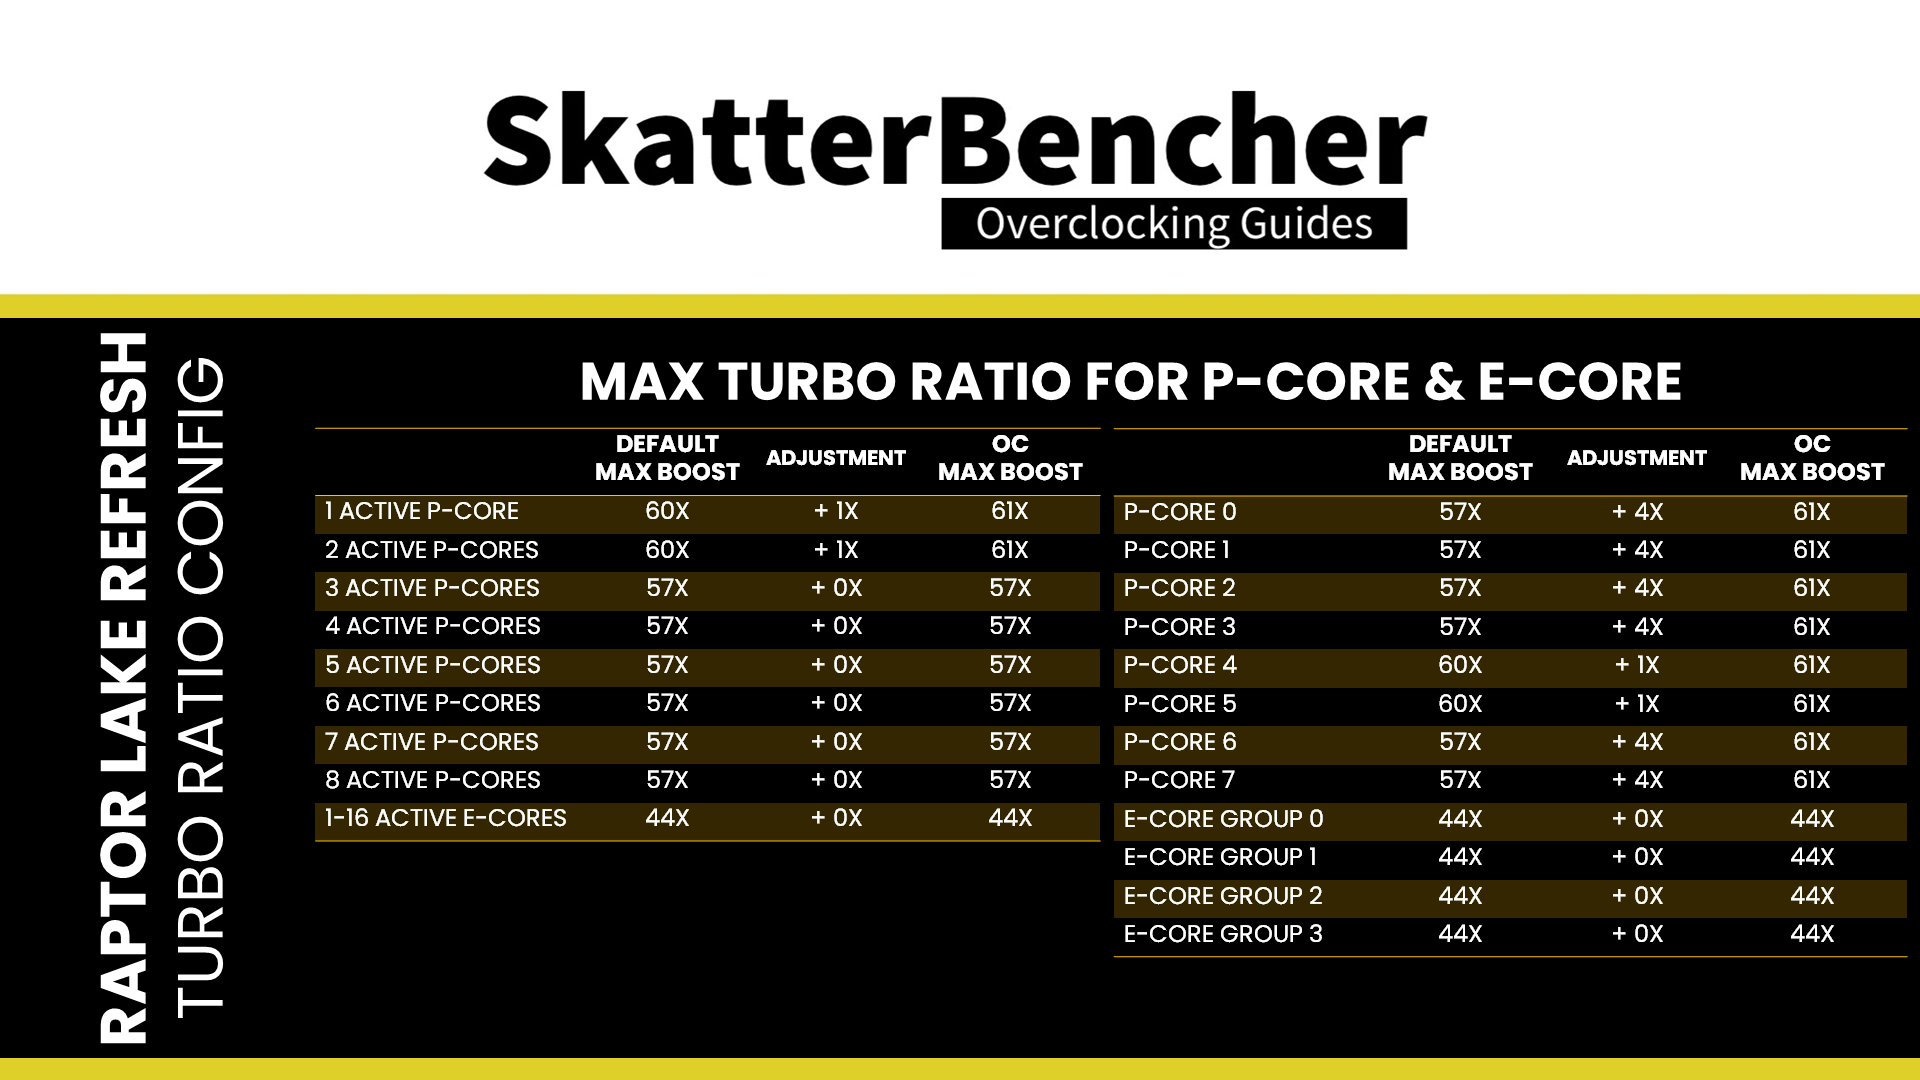
In this OC Strategy, we don’t touch the E-core frequency.
Intel Advanced Voltage Offset
As we’ve seen in the previous overclocking strategies, once we open up the Turbo Boost 2.0 Power Limits, the 14900K quickly shoots up to the TjMax of 100 degrees Celsius in an all-core load. So, as many enthusiasts know, Undervolting is a preferred method of squeezing more performance out of the system.
When we undervolt a CPU, we program it to use less voltage for a given frequency. That yields a lower temperature, which opens up the opportunity to boost to a higher frequency. There are many ways to undervolt your Core i9-14900K. I will discuss this at length in the next OC Strategy. I will introduce the Intel Advanced Voltage Offset tool for this OC Strategy.
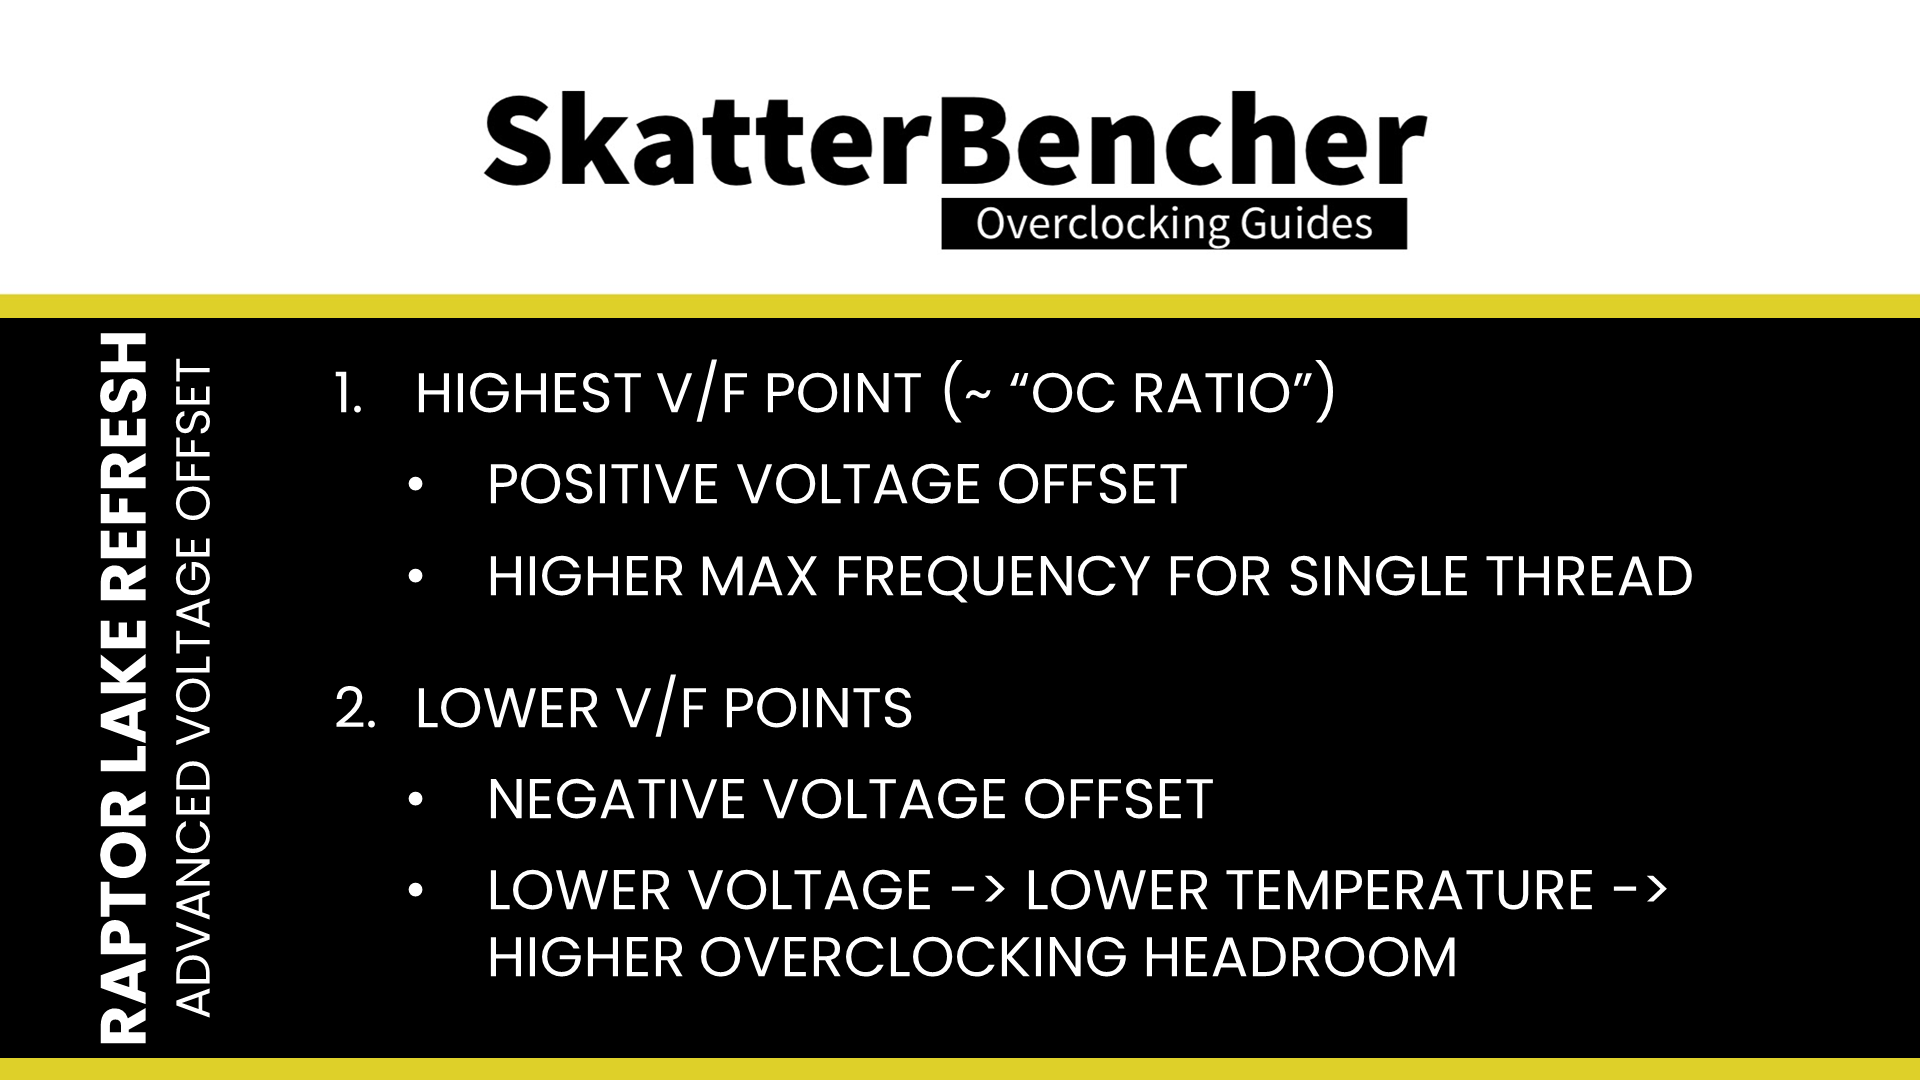
Advanced voltage offset, better known as the V/F Points, is an extension of the Adaptive Voltage as it exposes some of the points of the factory-fused V/F curve to the end-user and allows for manual adjustment of these points. Overclockers commonly use the Advanced Voltage Offset function in two ways.
- First, you configure a positive voltage offset for the highest V/f point, which helps achieve a higher single-threaded boost frequency.
- Second, you configure a negative voltage offset for the lower V/f points. That helps achieve lower voltage for all-core boost, which results in a lower temperature in all-core boost, and thus potential additional overclocking headroom.
On Raptor Lake Refresh, the CPU P-cores have 15 distinct voltage-frequency points. However, only points one to eleven are used. Furthermore, some points can be copies of other points. On the 14900K, the V/F points are as follows:
- V/F Point 1: 8X
- V/F Point 2: 14X
- V/F Point 3: 24X
- V/F Point 4: 34X
- V/F Point 5: 43X
- V/F Point 6: 51X
- V/F Point 7: 56X
- V/F Point 8: 58X
- V/F Point 9: 60X
- V/F Point 10: 60X
- V/F Point 11: 60X
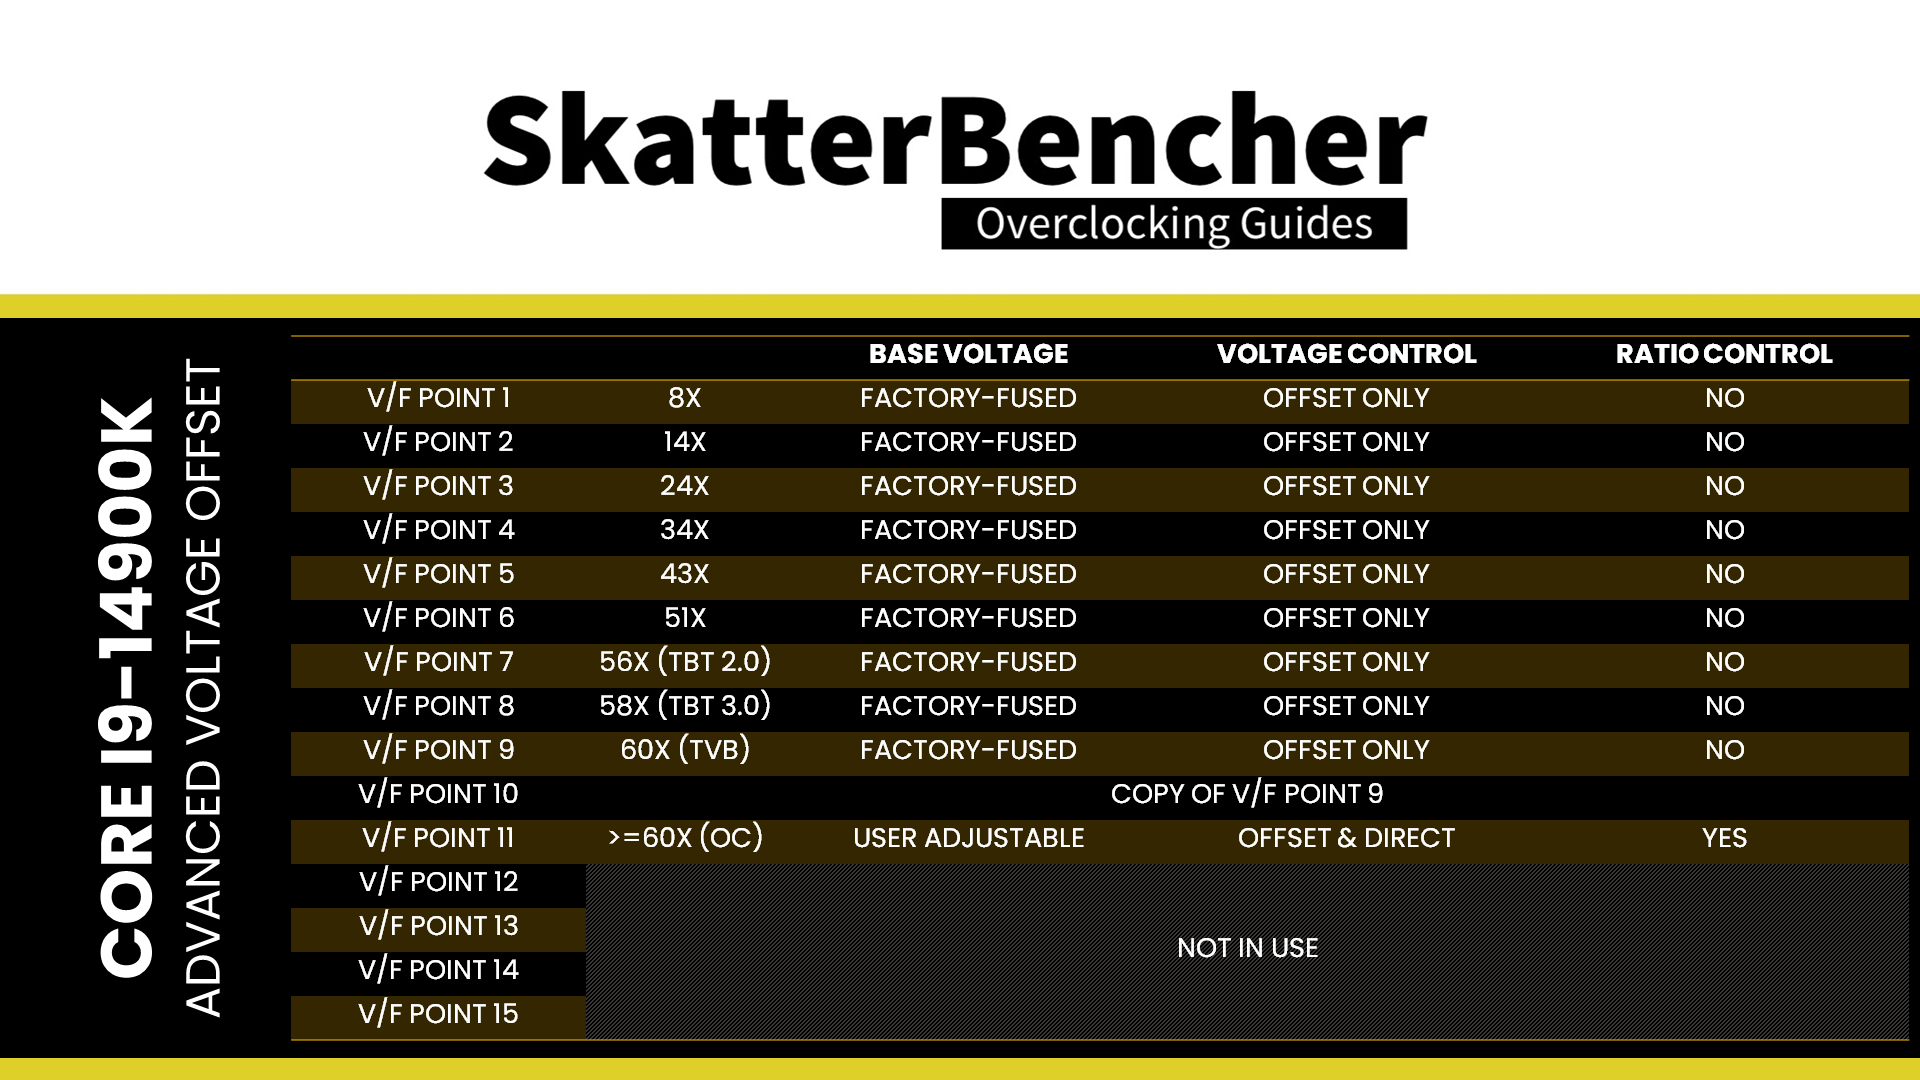
To undervolt the CPU in all-core workloads, we have to adjust V/F Points 6, 7, and 8, as these control the voltage for ratios between 51X and 57X, where we end up in an all-core AVX2 and SSE workload.
The V/F Point configuration is a matter of trial and error for most users. Still, there is a systematic element to it. Let’s say you want to lower the CPU voltage at 5.4 GHz (so, when using 54X). We know the voltage for 54X is interpolated between V/F Points 6 and 7. So, we can lower the voltage for 54X by reducing V/F Point 6 (which also affects the voltage for ratios between 43X and 51X) or by lowering V/F Point 7 (which also affects the voltage for ratios between 56X and 58X).
I set a negative voltage offset for V/F Points 5, 6, 7, and 8 in this OC Strategy. Thus, we undervolt the CPU for frequencies between 3.4 GHz and 6 GHz.
Intel Thermal Velocity Boost Voltage Optimizations
Whenever you venture into manual overclocking an Intel CPU, it’s highly recommended to disable the Thermal Velocity Boost Voltage Optimizations. Especially if you plan to manually adjust the voltages.
Thermal Velocity Boost is an Intel technology that exploits the fact that CPUs need less voltage to run a specific frequency when the operating temperature is lower. The CPU automatically adjusts the voltage according to the operating temperature when this setting is enabled.
Here, you can see an example with the Core i9-13900K processor when Thermal Velocity Boost Voltage Optimizations are enabled. The difference in operating voltage at 40 degrees Celsius and 100 degrees Celsius is about 50 mV.
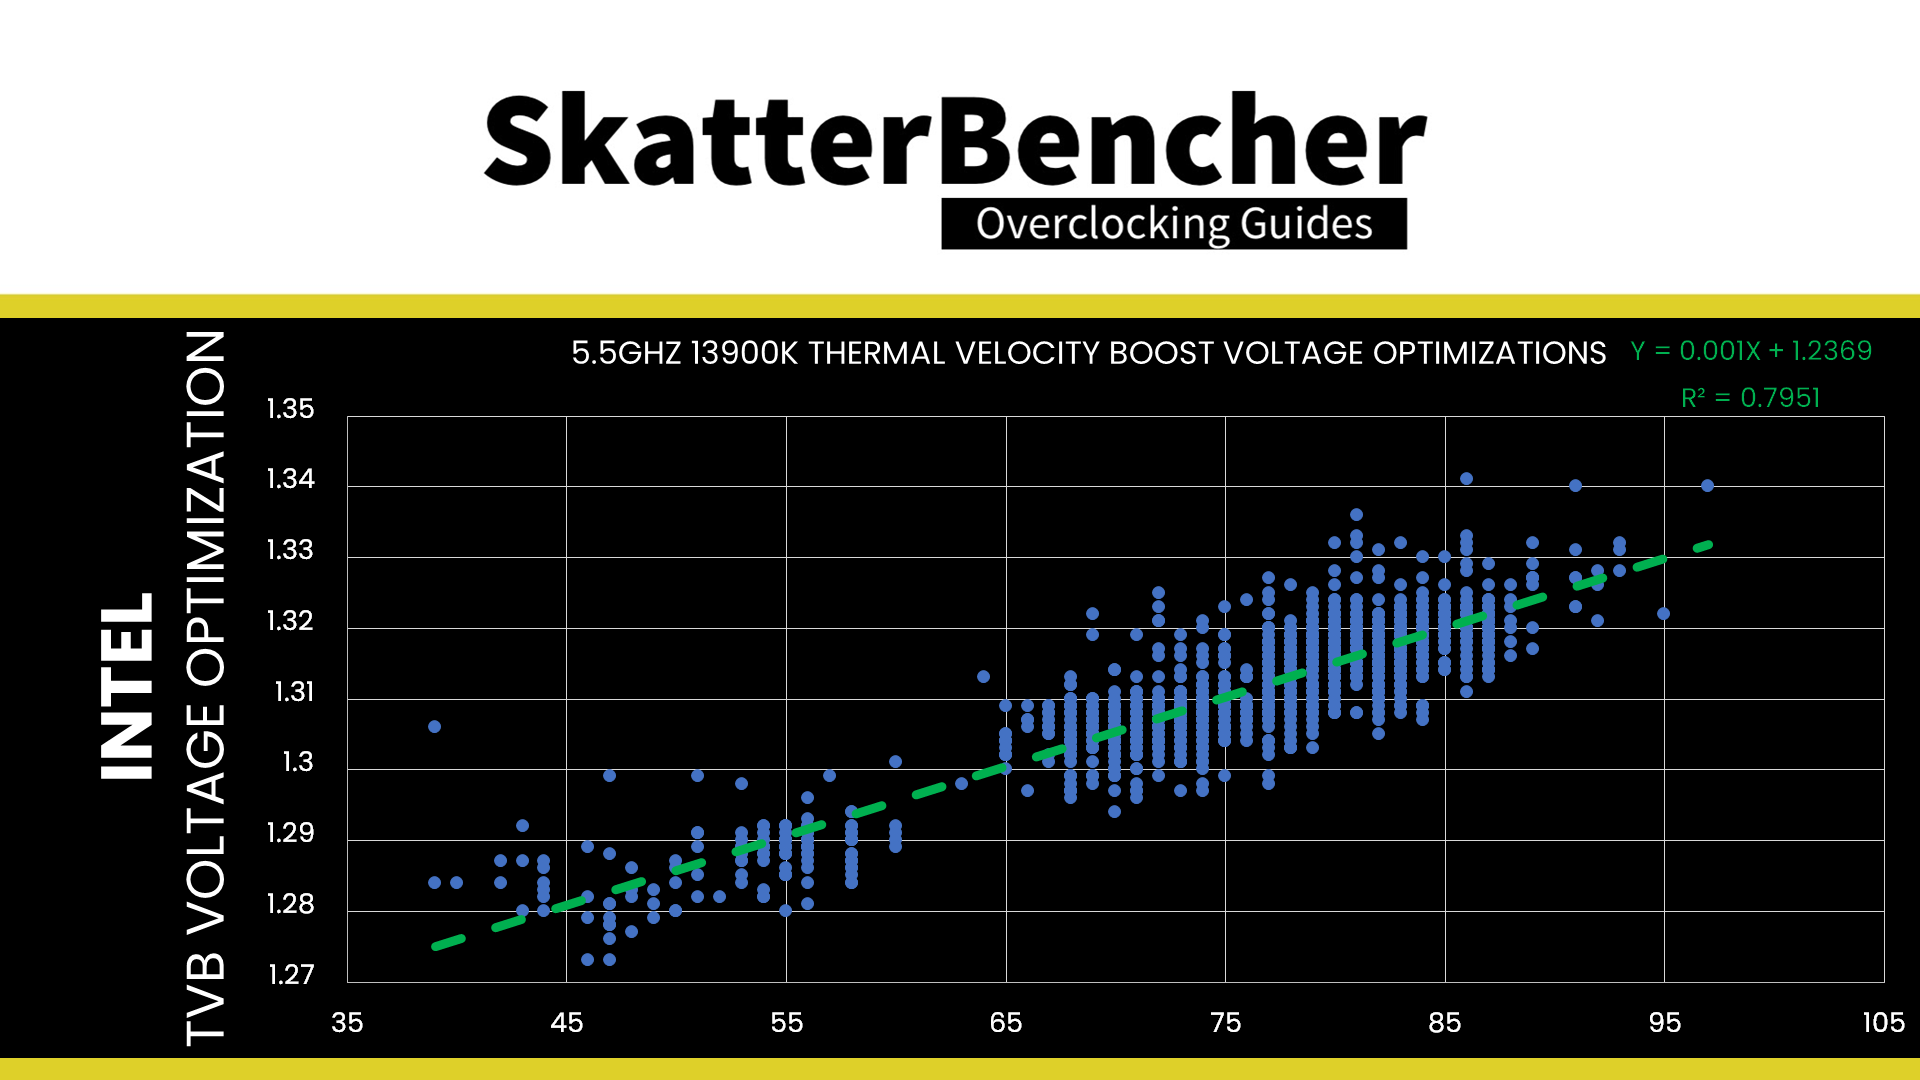
Suppose you don’t disable the voltage optimizations. In that case, you might find the CPU stable at a given frequency when the temperature is 100 degrees Celsius under heavy load yet fails when the temperature is 40 degrees Celsius while idling.
GIGABYTE High Bandwidth & Low Latency
A last quick setting I want to discuss before moving on to the BIOS settings is the High Bandwidth and Low Latency memory options. I used these before in previous guides, and they seem to provide additional performance benefits, but GIGABYTE is pretty tight-lipped on what it does. I assume it’s adjusting specific memory parameters.
Enabling the settings may cause instability, but it’s up to you to see if your memory is stable when enabled. In my case, I enable the High Bandwidth and Low Latency options and see a positive performance impact in benchmarks like Geekbench 6 and AI Benchmark.
BIOS Settings & Benchmark Results
Upon entering the BIOS
- Switch to Advanced Mode
- In the Tweaker menu
- Set GIGABYTE PerfDrive to Unleash
- Enter the Advanced CPU settings submenu
- Set Voltage Reduction Initiated TVB to Disabled
- Set AVX Settings to user Defined
- Set AVX Optimum to Enabled
- Set Active Turbo Ratios to Manual
- Set Turbo Ratio (1 P-Core Active) to (6 P-Core Active) to 61
- Set Turbo Ratio (7 P-Core Active) and (8 P-Core Active) to 57
- Set Turbo Per Core Limit Control to Manual
- Set Turbo P-Core 0 to 7 Ratio Limit to 61
- Leave the Advanced CPU Settings submenu
- Set High Bandwidth to Enabled
- Set Low Latency to Enabled
- Set Extreme Memory Profile(X.M.P.) to XMP 1
- Set Vcore Voltage Mode to Adaptive Vcore
- Set VF Offset Mode to Selection
- Set VF Point 5 Offset to -0.015V
- Set VF Point 6 Offset to -0.050V
- Set VF Point 7 Offset to -0.050V
- Set VF Point 8 Offset to -0.035V
- Set VF Offset Mode to Selection
Then save and exit the BIOS.
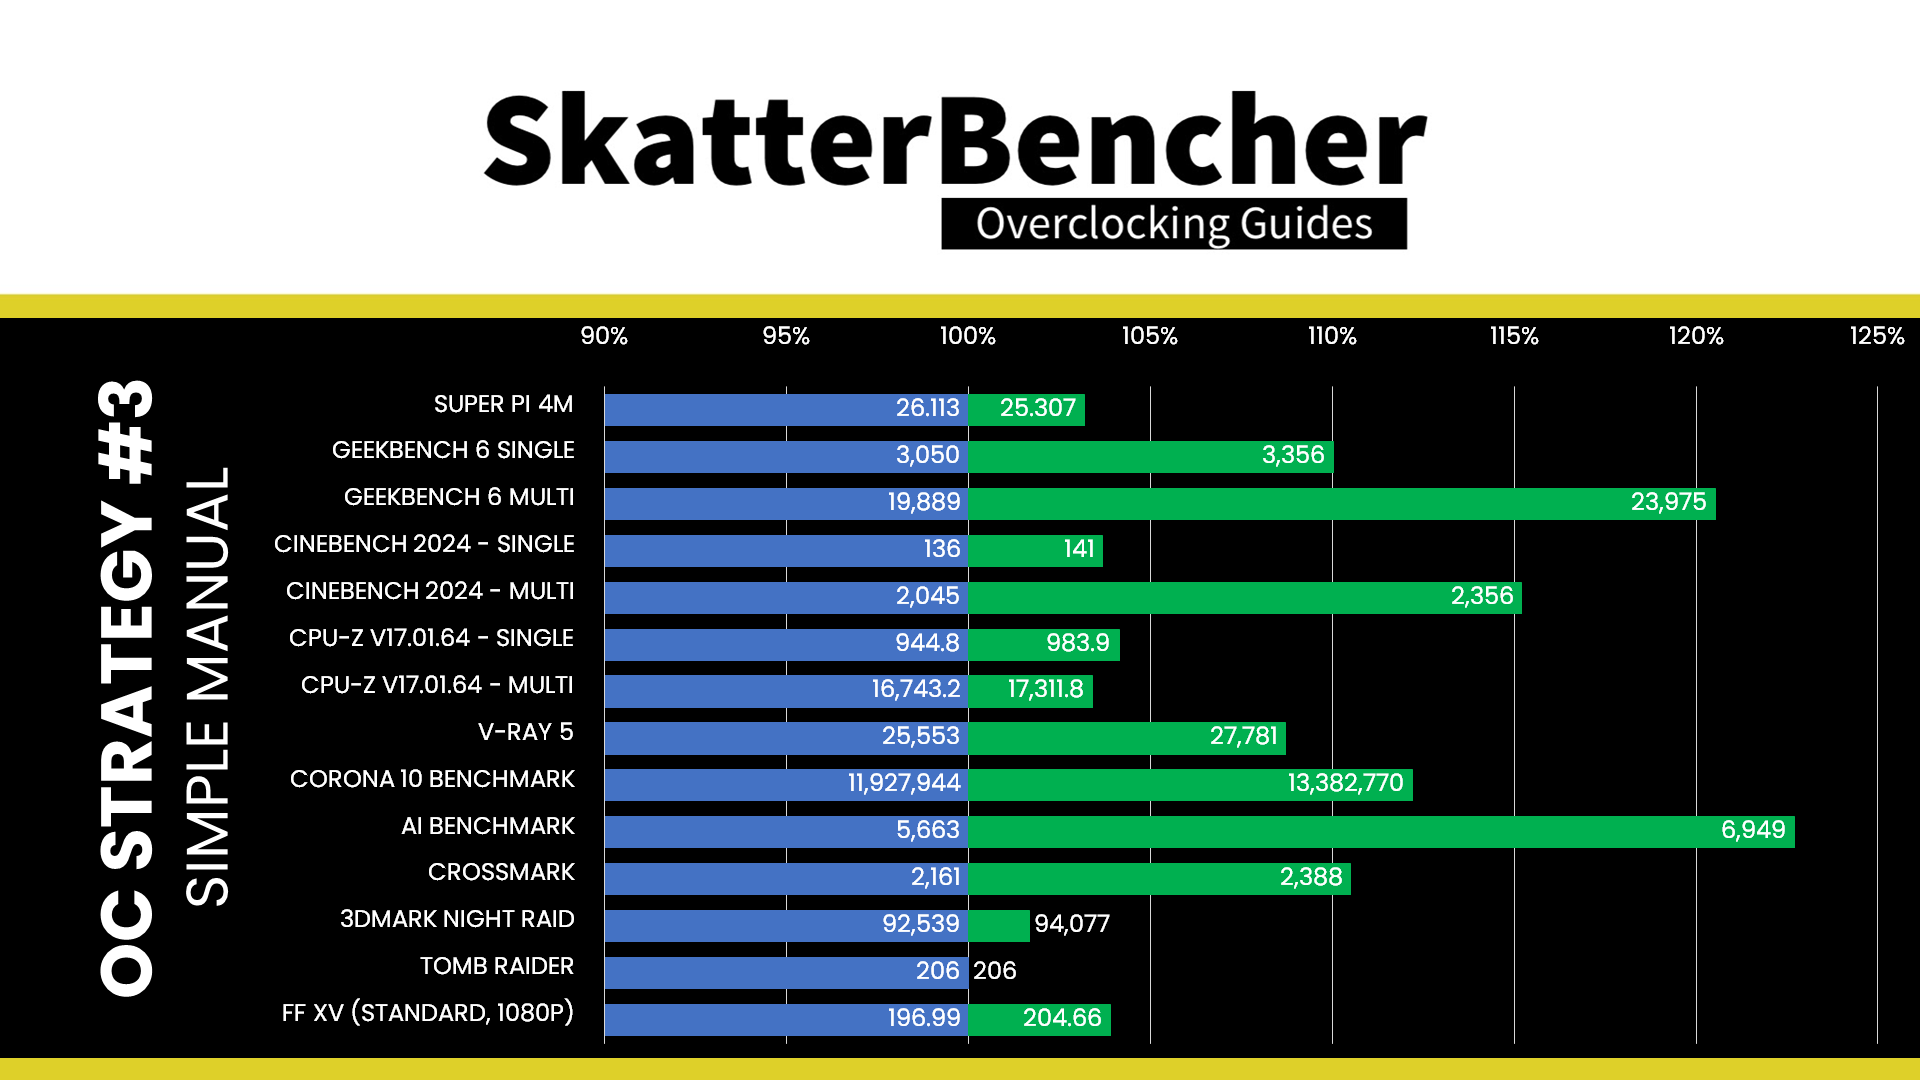
We re-ran the benchmarks and checked the performance increase compared to the default operation.
- SuperPI 4M: +3.18%
- Geekbench 6 (single): +10.03%
- Geekbench 6 (multi): +20.54%
- Cinebench 2024 Single: +3.68%
- Cinebench 2024 Multi: +15.21%
- CPU-Z V17.01.64 Single: +4.14%
- CPU-Z V17.01.64 Multi: +3.40%
- V-Ray 5: +8.72%
- Corona Benchmark: +12.20%
- AI Benchmark: +22.71%
- Crossmark: +10.50%
- 3DMark Night Raid: +1.66%
- Tom Raider: +0.00%
- Final Fantasy XV: +3.89%
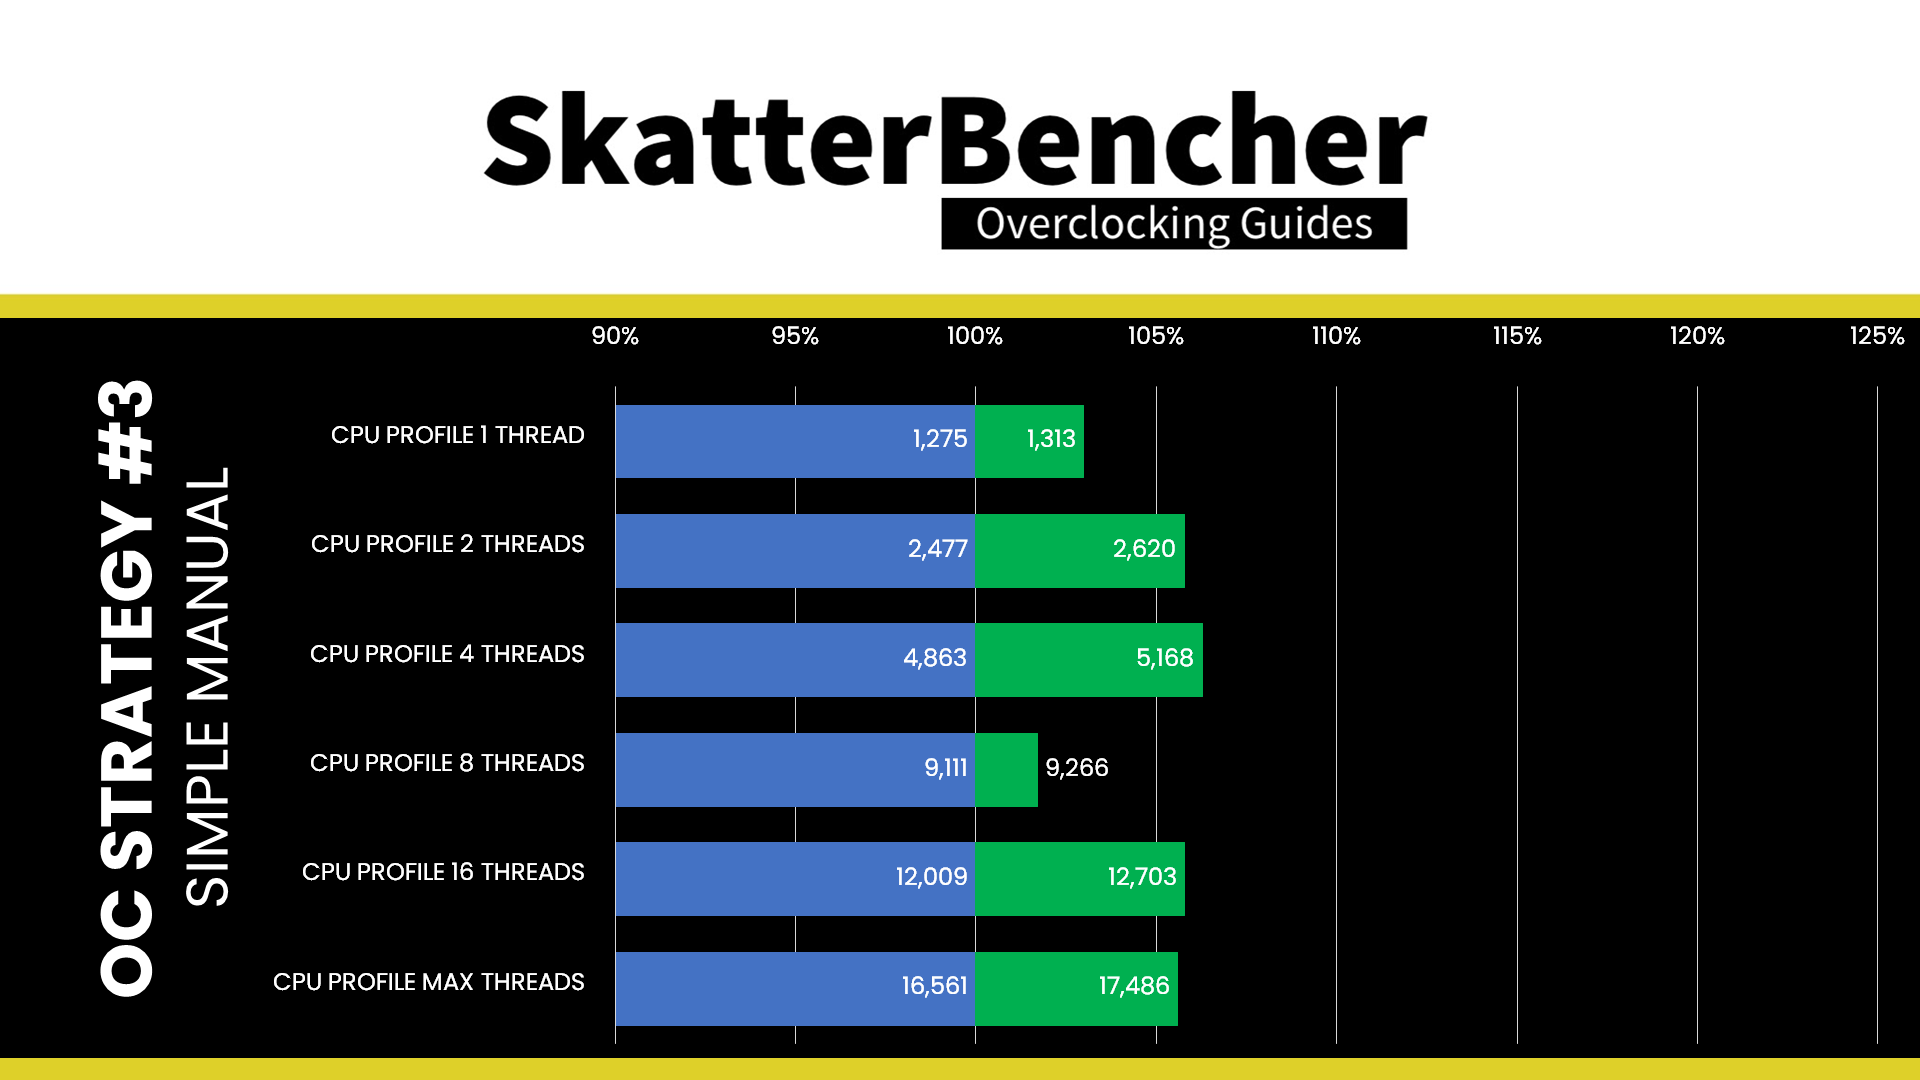
Here are the 3DMark CPU Profile scores:
- CPU Profile 1 Thread: +2.98%
- CPU Profile 2 Threads: +5.77%
- CPU Profile 4 Threads: +6.27%
- CPU Profile 8 Threads: +1.70%
- CPU Profile 16 Threads: +5.78%
- CPU Profile Max Threads: +5.59%
We’re not pushing the operating frequency much higher than the base specification. Still, thanks to undervolting, there are some improvements in all-core and heavy workloads. We get a maximum performance improvement of +22.71% in AI Benchmark.
When running the OCCT CPU AVX2 Stability Test, the average CPU P-core effective clock is 5344 MHz, and the average CPU E-core effective clock is 4283 MHz with 1.183 volts. The average CPU temperature is 100 degrees Celsius. The ambient and water temperatures are 28.6 and 32.7 degrees Celsius. The average CPU package power and CPU input power are 373.8 and 395.5 watts.

When running the OCCT CPU SSE Stability Test, the average CPU P-core effective clock is 5582 MHz, and the average CPU E-core effective clock is 4211 MHz with 1.220 volts. The average CPU temperature is 100 degrees Celsius. The ambient and water temperatures are 28.0 and 32.2 degrees Celsius. The average CPU package power and CPU input power are 365.7 and 383.6 watts.

OC Strategy #4: Advanced Manual Overclocking
I pursue an advanced manual overclock in the fourth and final overclocking strategy. The main focus of the OC Strategy is to improve the voltage configuration and set it up for more precise overclocking control. Once the voltage configuration is set up, we’ll see if we can also squeeze more frequency.
To help you better understand the various changes I make in the BIOS, I want to first talk about how the CPU core voltage is managed on the Core i9-14900K processor. Once we understand how that works, it’ll become much more apparent why I set specific settings.
Let’s begin with the basics and discuss the Raptor Lake Refresh voltage topology.
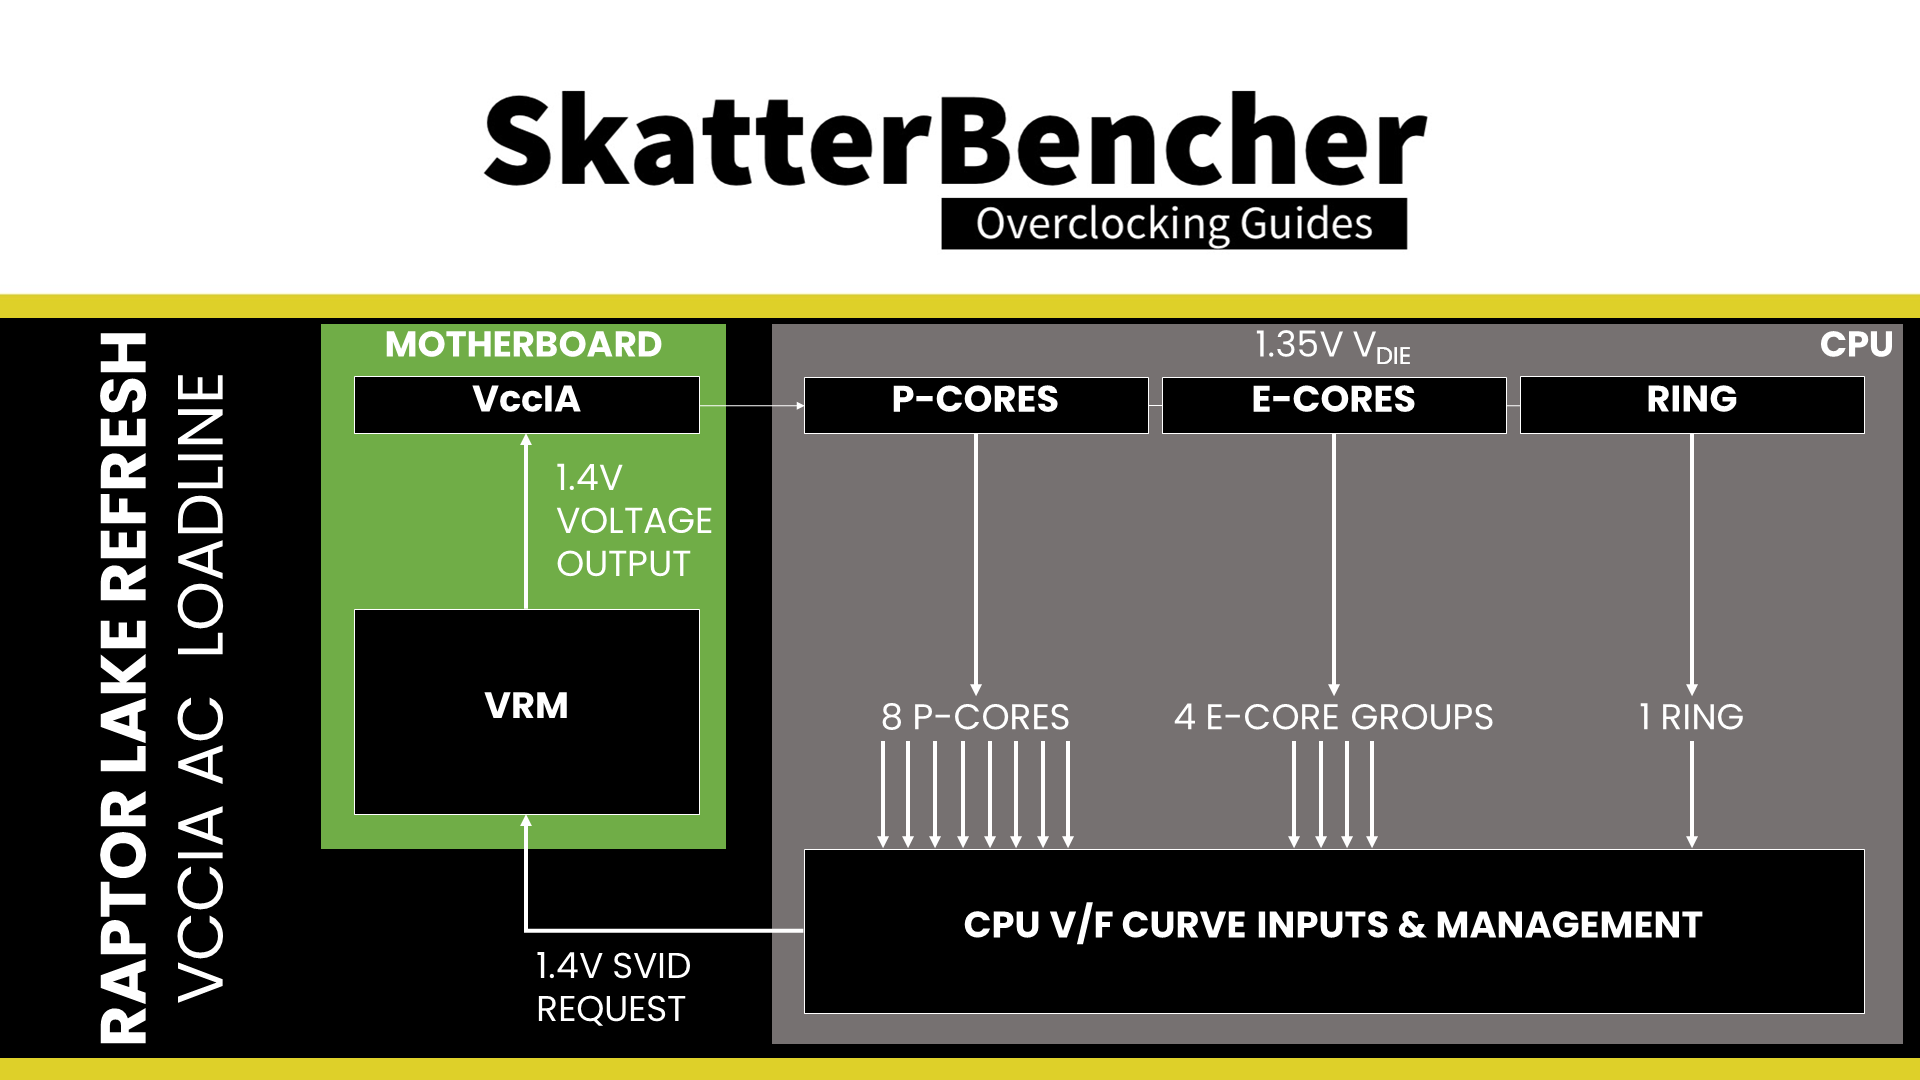
VccIA Voltage Rail
On Raptor Lake Refresh, the VccIA voltage rail drives the voltage for the CPU cores, P-core and E-core, and the Ring. That means a single voltage is used for all these parts of the CPU.
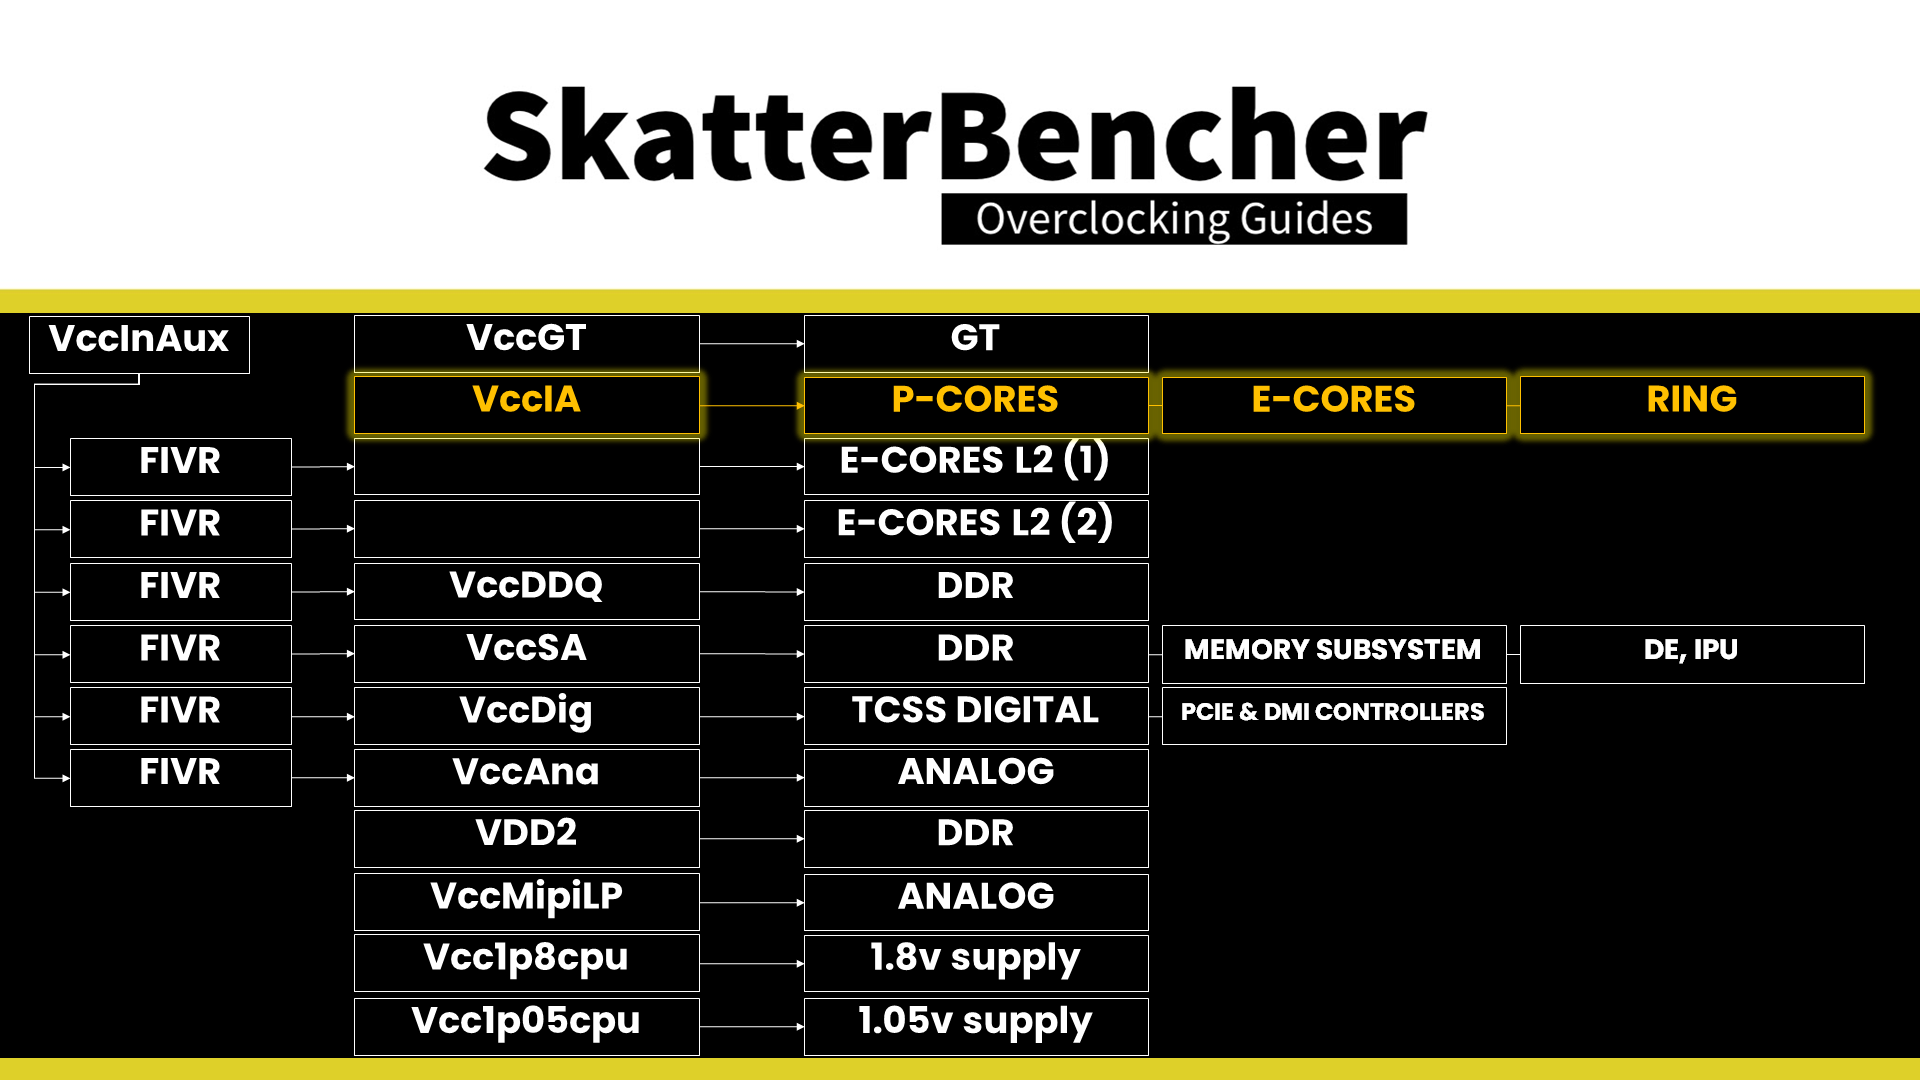
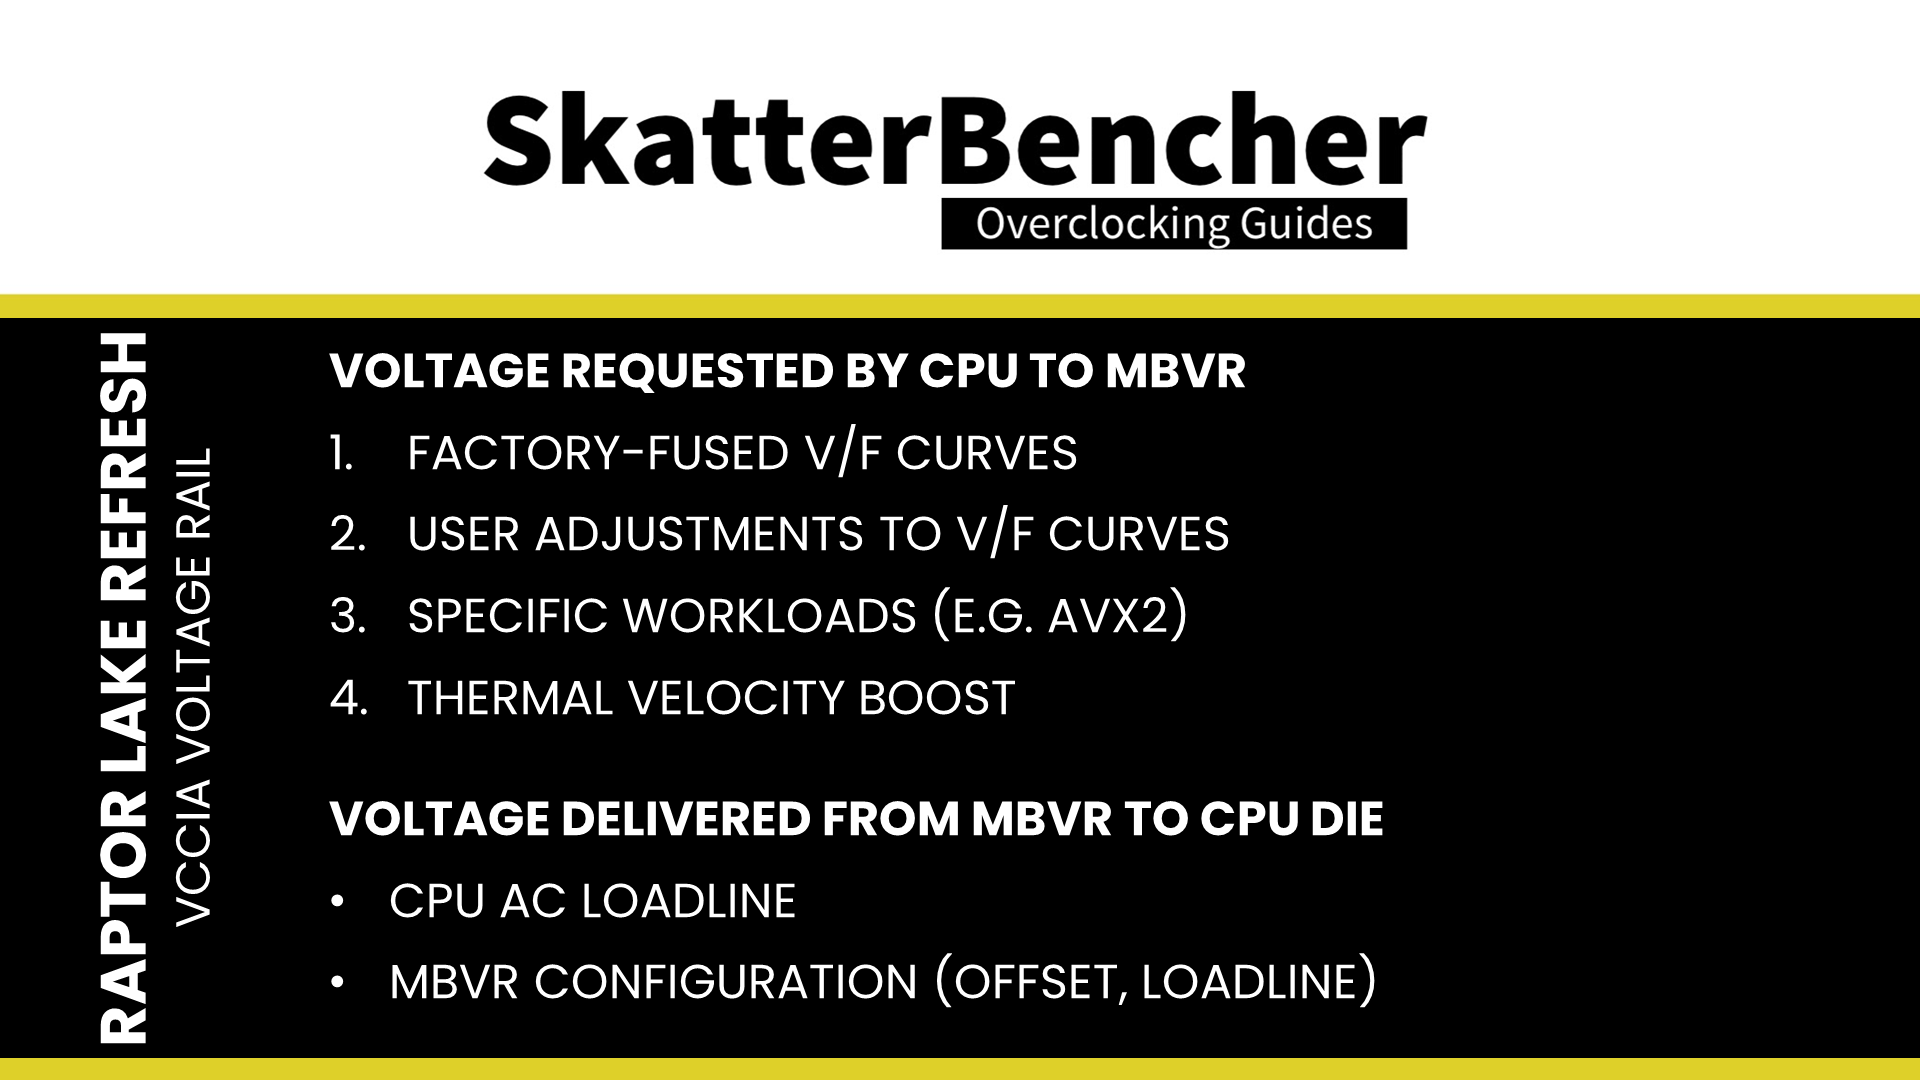
How that voltage is configured is straightforward yet complex. Six main elements impact the voltage of this VccIA voltage rail. We can split these elements into two groups: those that affect the voltage requested by the CPU to the motherboard voltage regulator and those that impact the voltage delivery from the motherboard voltage regulator to the CPU die.
- Voltage Request
- The factory-fused voltage-frequency curves,
- Any user adjustments to the V/F curves,
- Specific types of workloads, such as AVX
- Thermal velocity boost technology.
- Voltage Delivery
- The AC loadline,
- The VRM configuration, including offset and loadine,
In the coming sections, I will explain how each of these aspects can impact the voltage of your CPU.
VccIA Voltage Request
Let’s first look at all the different elements affecting what voltage the CPU requests from the motherboard voltage regulator.
V/F Curves
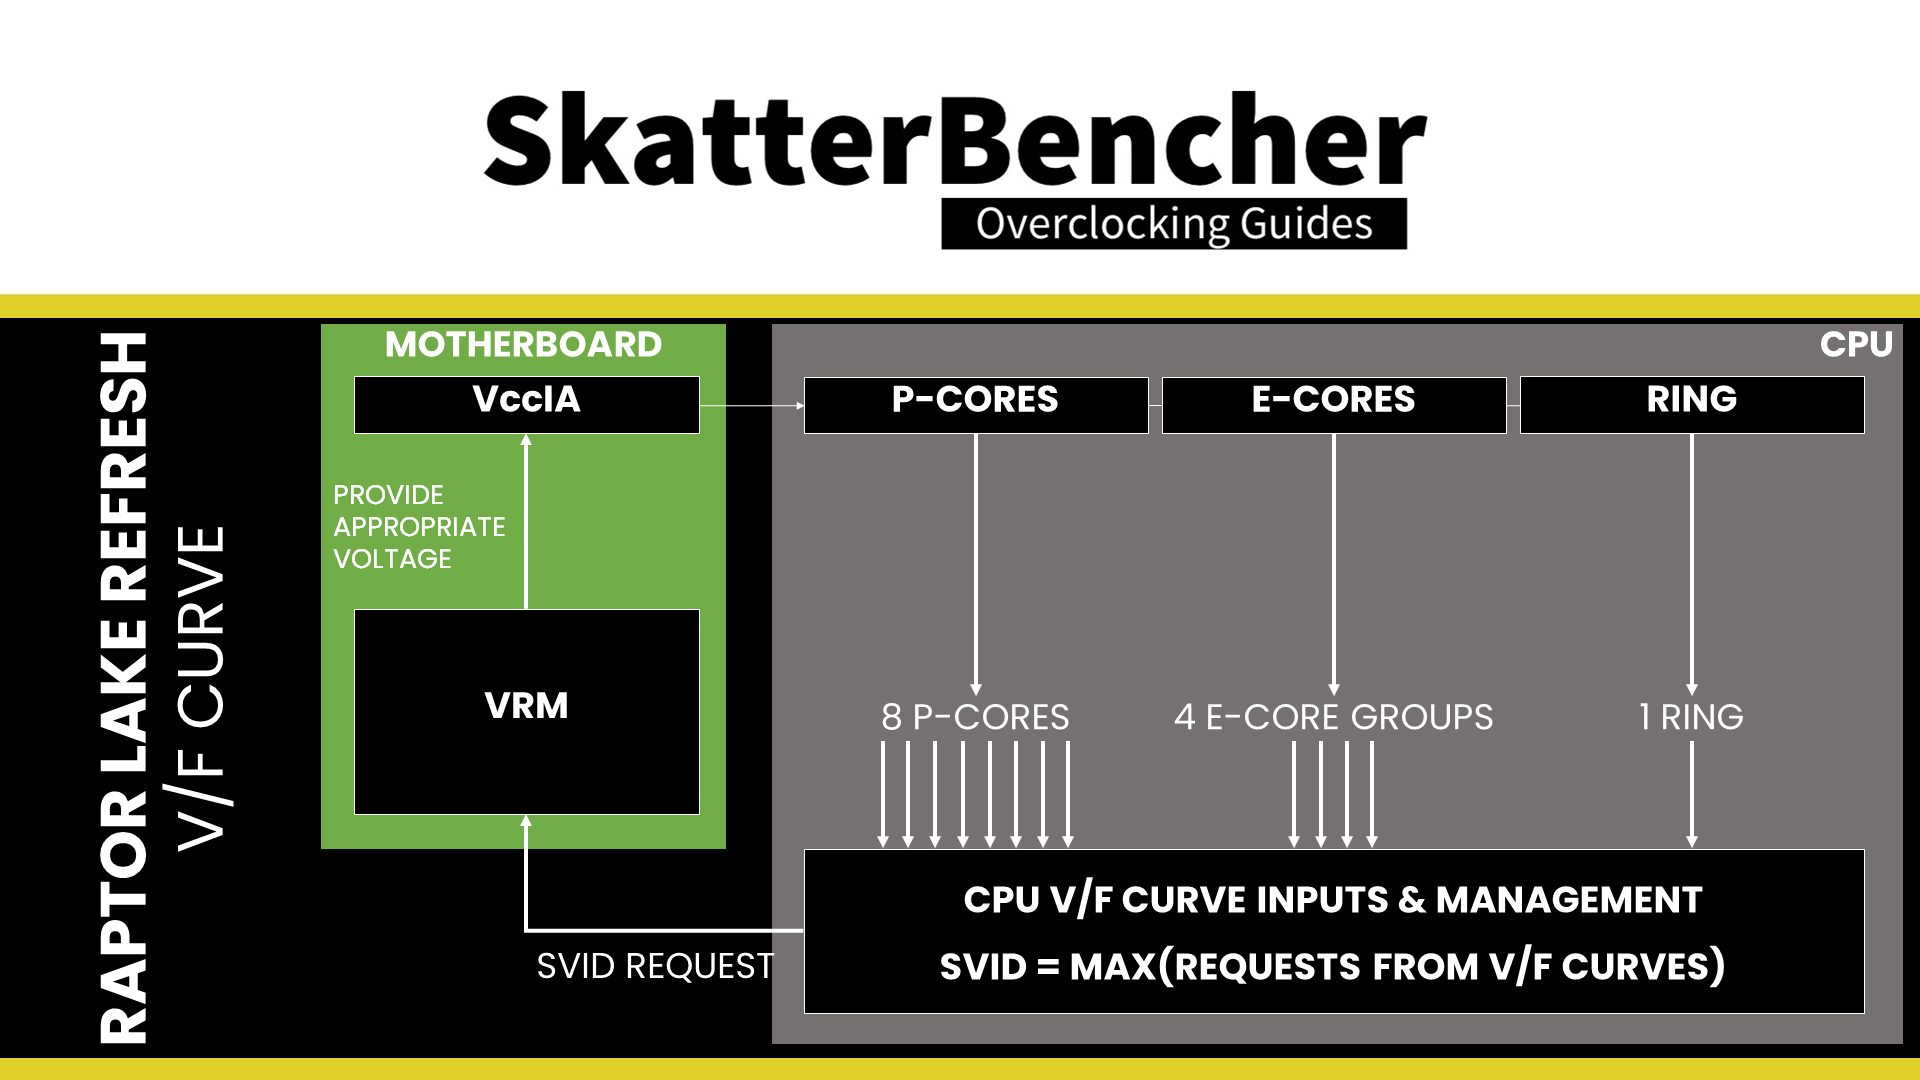
An Intel CPU relies on many factory-fused voltage-frequency or V/F curves to regulate its dynamic compute performance behavior. A V/F curve describes the relationship between an operating frequency and the voltage required for that frequency. A lot of parts inside your CPU have a V/f curve, including those relevant to the VccIA voltage rail:
- Each of the 8 P-cores
- Each of the 4 E-core groups of 4 cores
- The Ring
In the case of the Core i9-14900K, the VccIA voltage rail is affected by no less than 13 different voltage-frequency curves. Based on these V/F curves, to get a specific voltage provided via the VccIA voltage rail, the CPU issues an SVID request to the voltage controller. The VID requested is the highest among all the requested voltages according to every V/F curve affecting the voltage rail.
Let’s take an example:
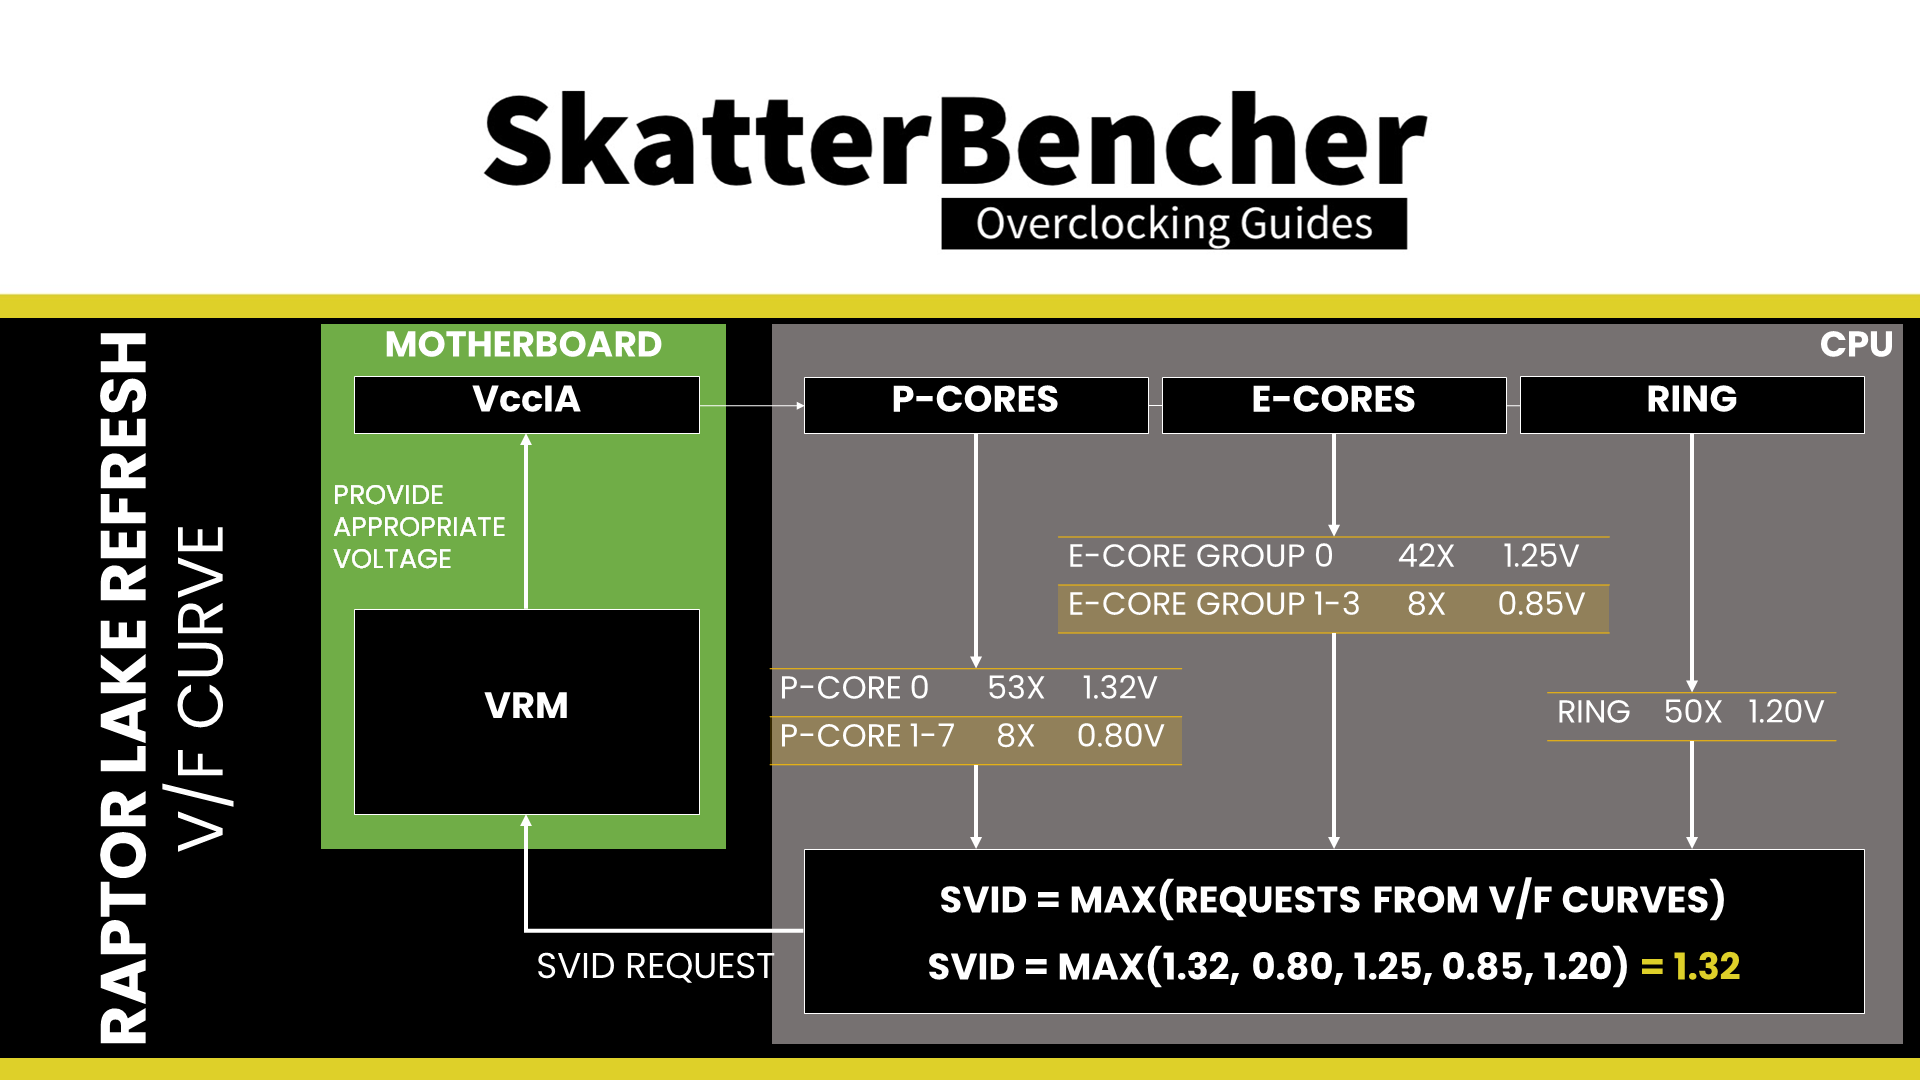
Voltage Overrides (Static, Adaptive)
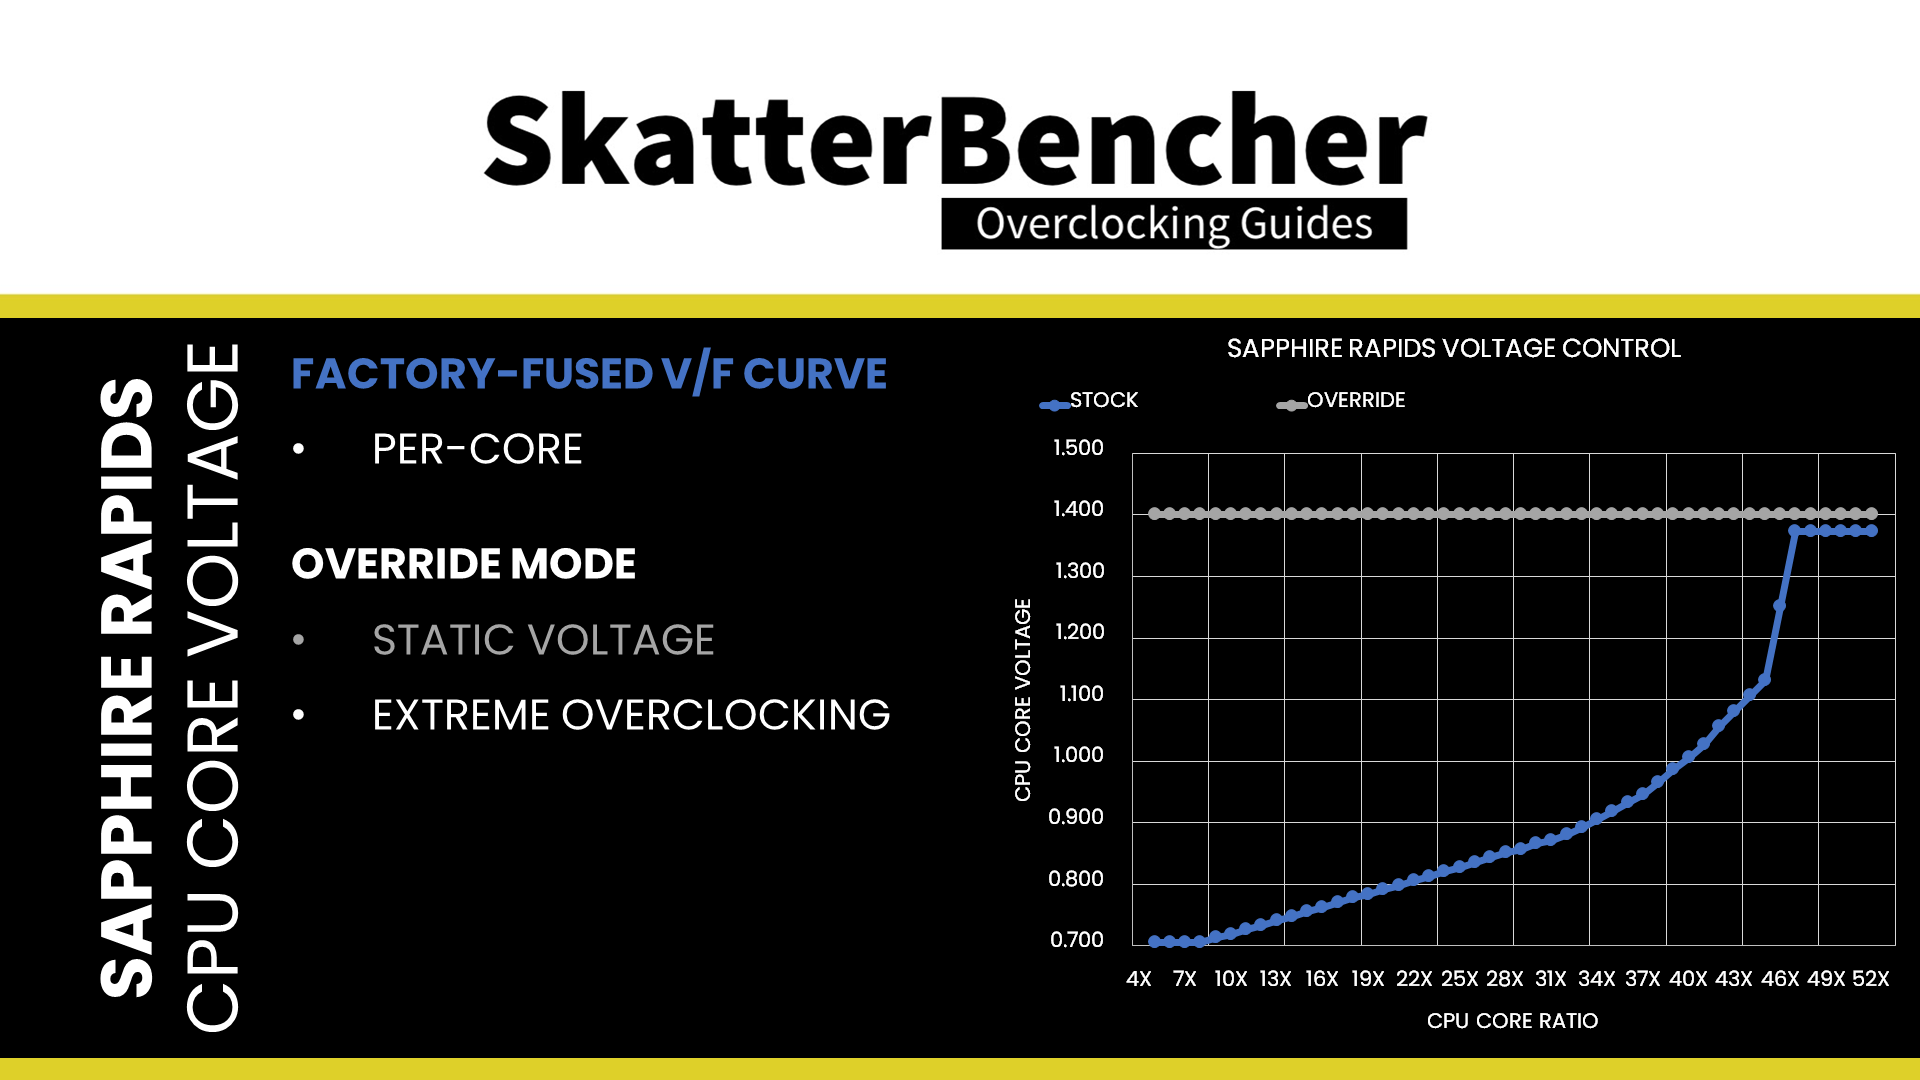
Intel offers multiple ways for the end-user to adjust the SVID request from the CPU to the motherboard voltage regulator. Let’s focus on the CPU P-cores first. The two main methods to adjust the CPU core voltage are override and adaptive mode.
- Override mode specifies a single static voltage across all ratios. It is mainly used for extreme overclocking where stability at high frequencies is the only consideration.
- Adaptive mode is the standard mode of operation, which relies on the factory-fused voltage-frequency curves we discussed before.

We can configure override and adaptive modes directly to the CPU power management unit. We can specify a target voltage and a voltage offset for each mode. Of course, using both a target and an offset doesn’t make much sense for override mode – if you set 1.35V with a +50mV offset, you could just set 1.40V. But it can be helpful in adaptive mode as you can offset the entire V/F curve by up to 500mV in both directions.
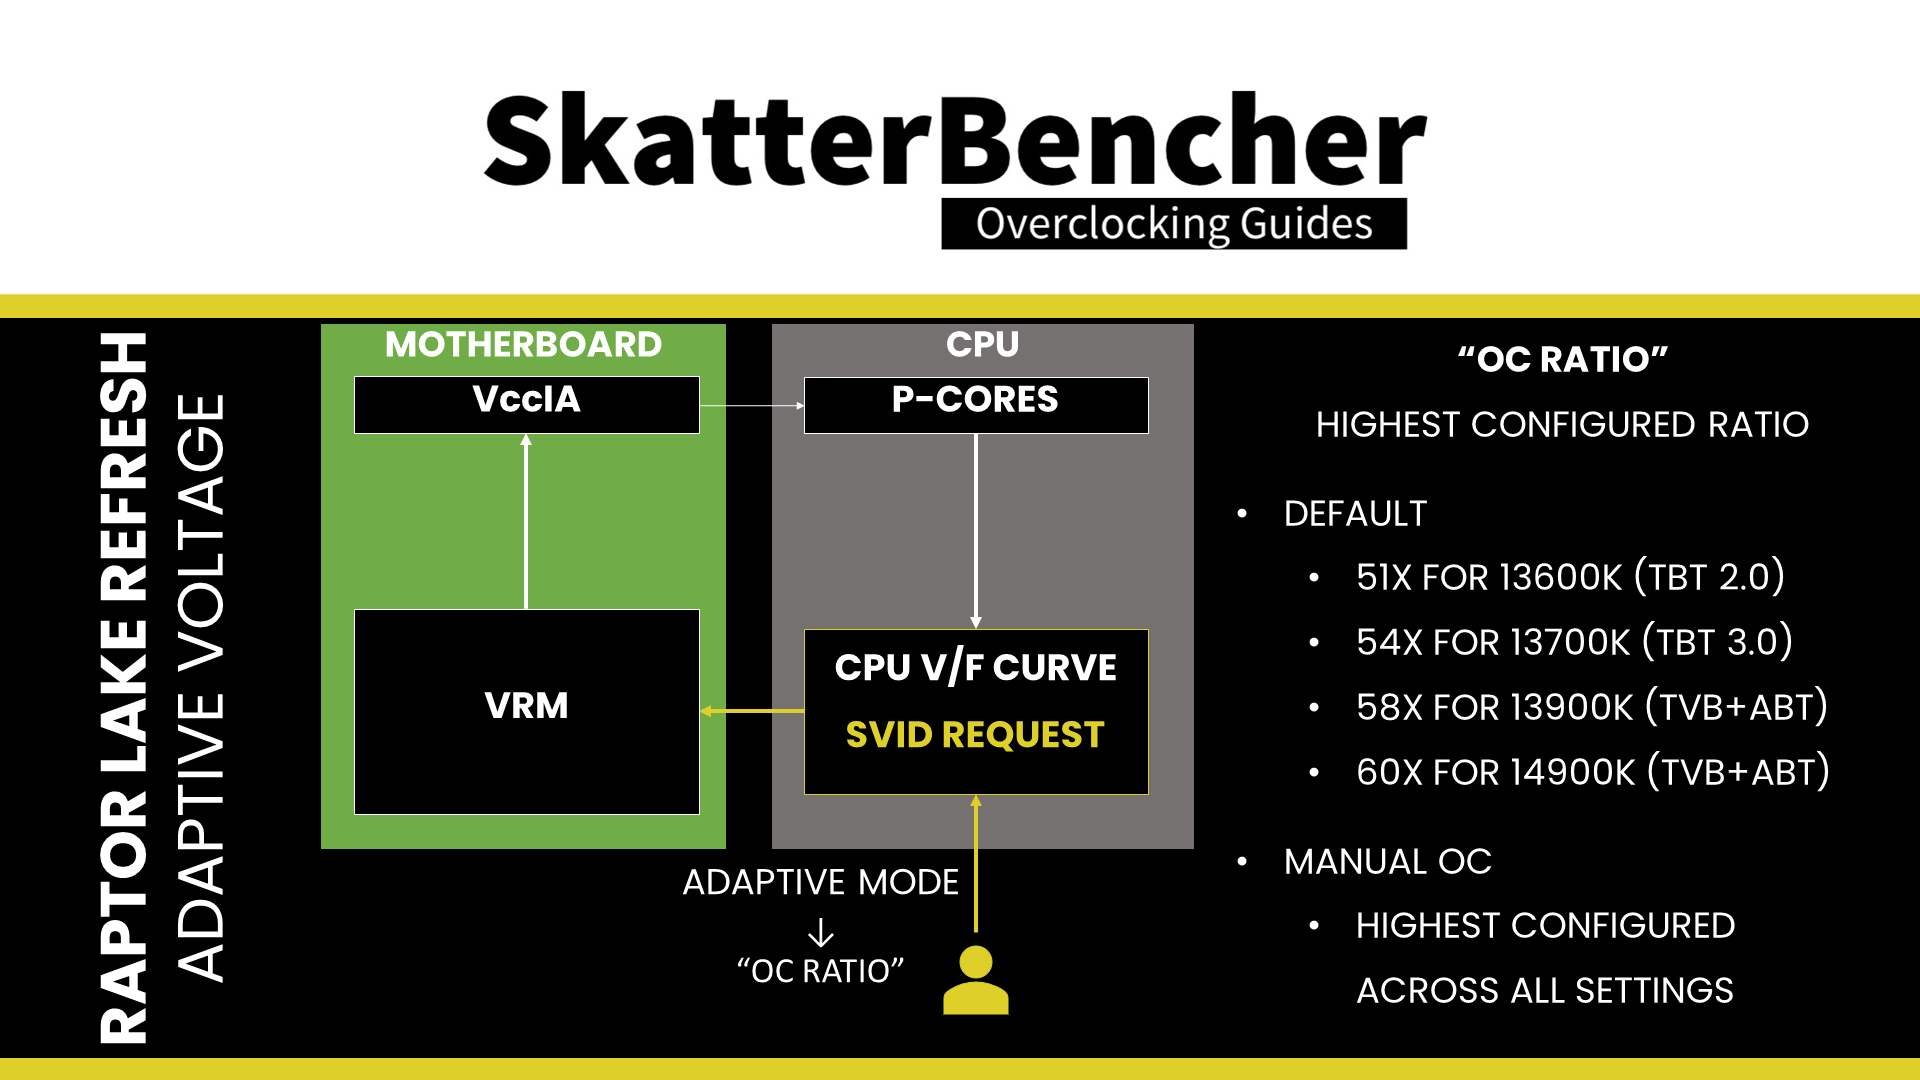
When we set an adaptive voltage for a core, this voltage is mapped against the “OC Ratio.” The “OC Ratio” is the highest ratio configured for the CPU across all settings and cores. When you leave everything at default, the default maximum turbo ratio determines the OC ratio. In the case of the 14900K, that ratio would be 60X. The “OC Ratio” equals the highest configured ratio if you overclock.
There are three rules you have to know about adaptive voltage mode.
A) the voltage set for a given ratio n must be higher than or equal to the voltage set for ratio n-1.
Suppose our 14900K runs 60X at 1.43V. Setting the adaptive voltage, mapped to 60X, lower than 1.43V, is pointless in that case. 60X always runs at 1.43V or higher. Usually, BIOSes allow you to configure lower values. However, the CPU’s internal mechanisms override your configuration if it doesn’t follow the rules.
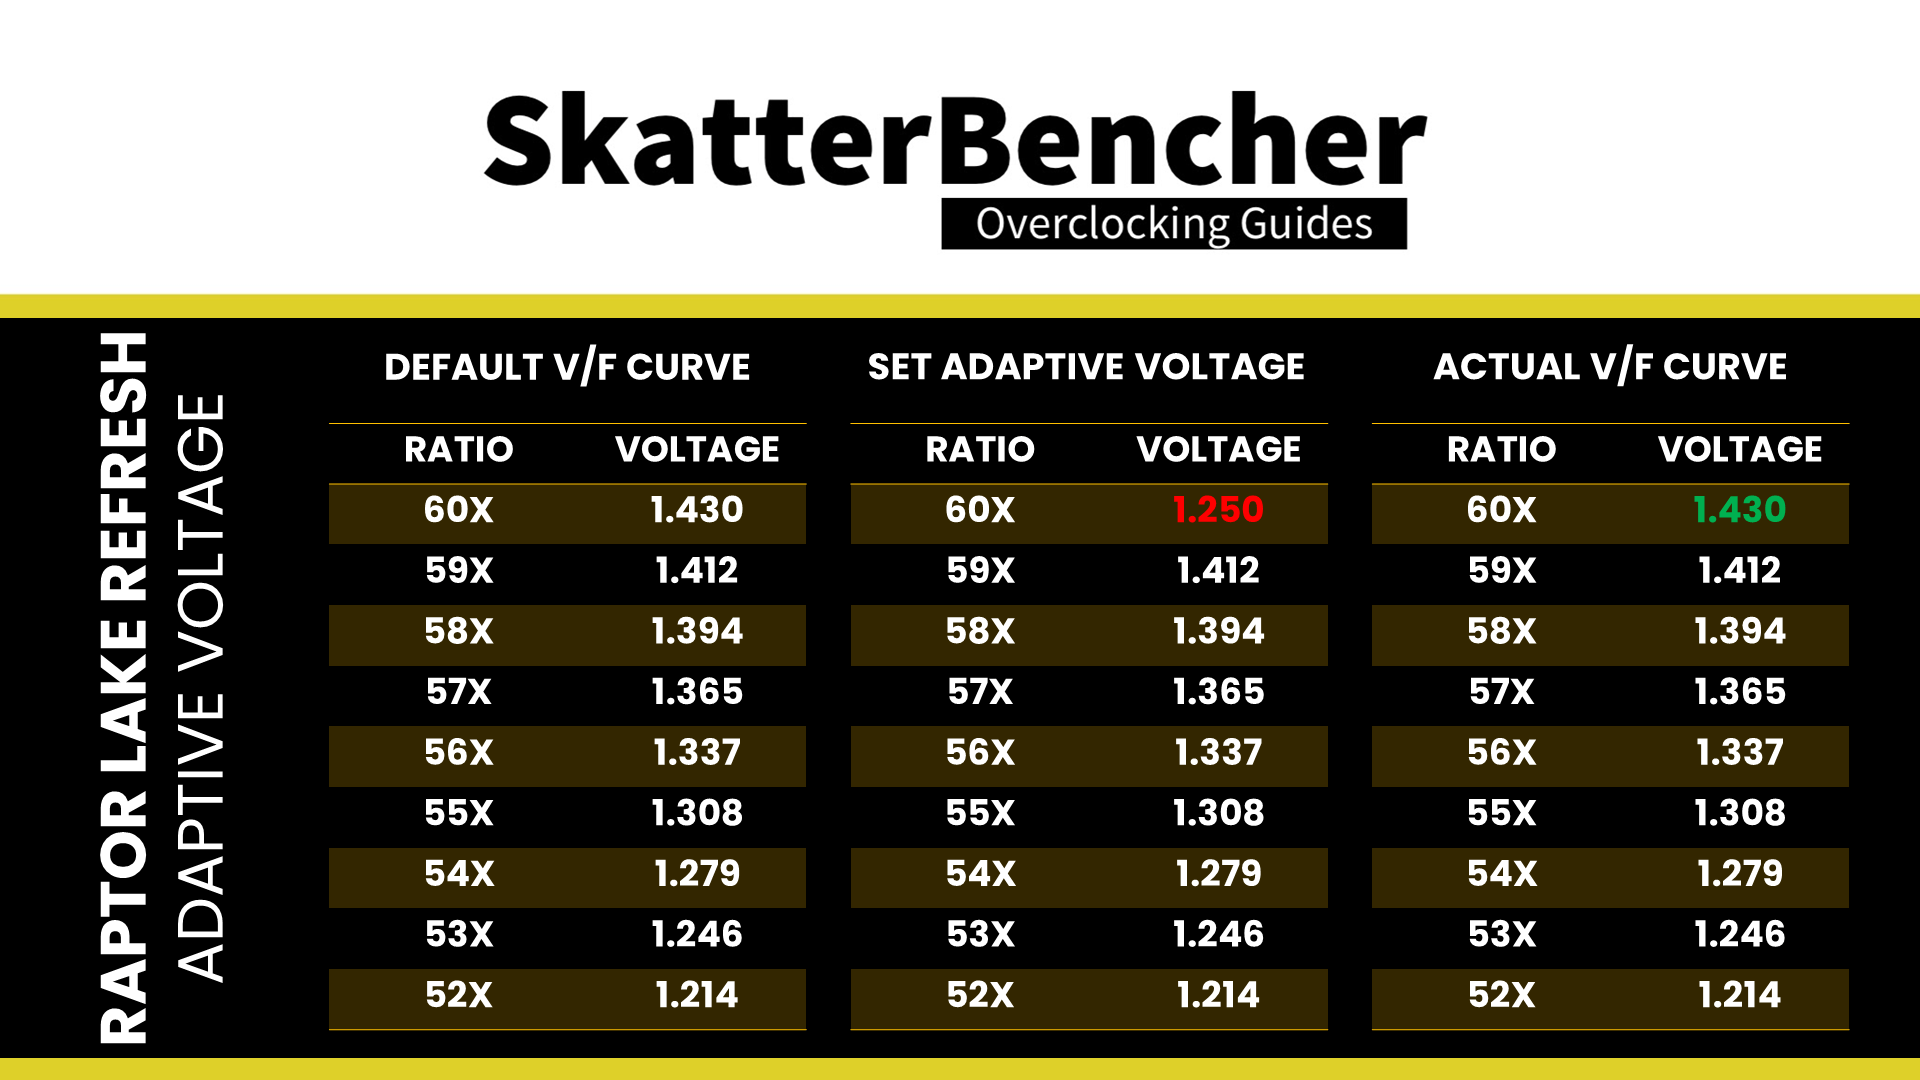
B) the adaptive voltage configured for any ratio below the maximum default turbo ratio is ignored.
Take the same example of the 14900K, specified to run 60x at 1.43V. Suppose you try to configure all cores to 55x and set 1.25V. In that case, the CPU ignores this because it has its own factory-fused target voltage for all ratios up to 60X and uses this voltage. You can only change the voltage of the OC Ratio, which, as mentioned before, on the 14900K, is 60X and up.

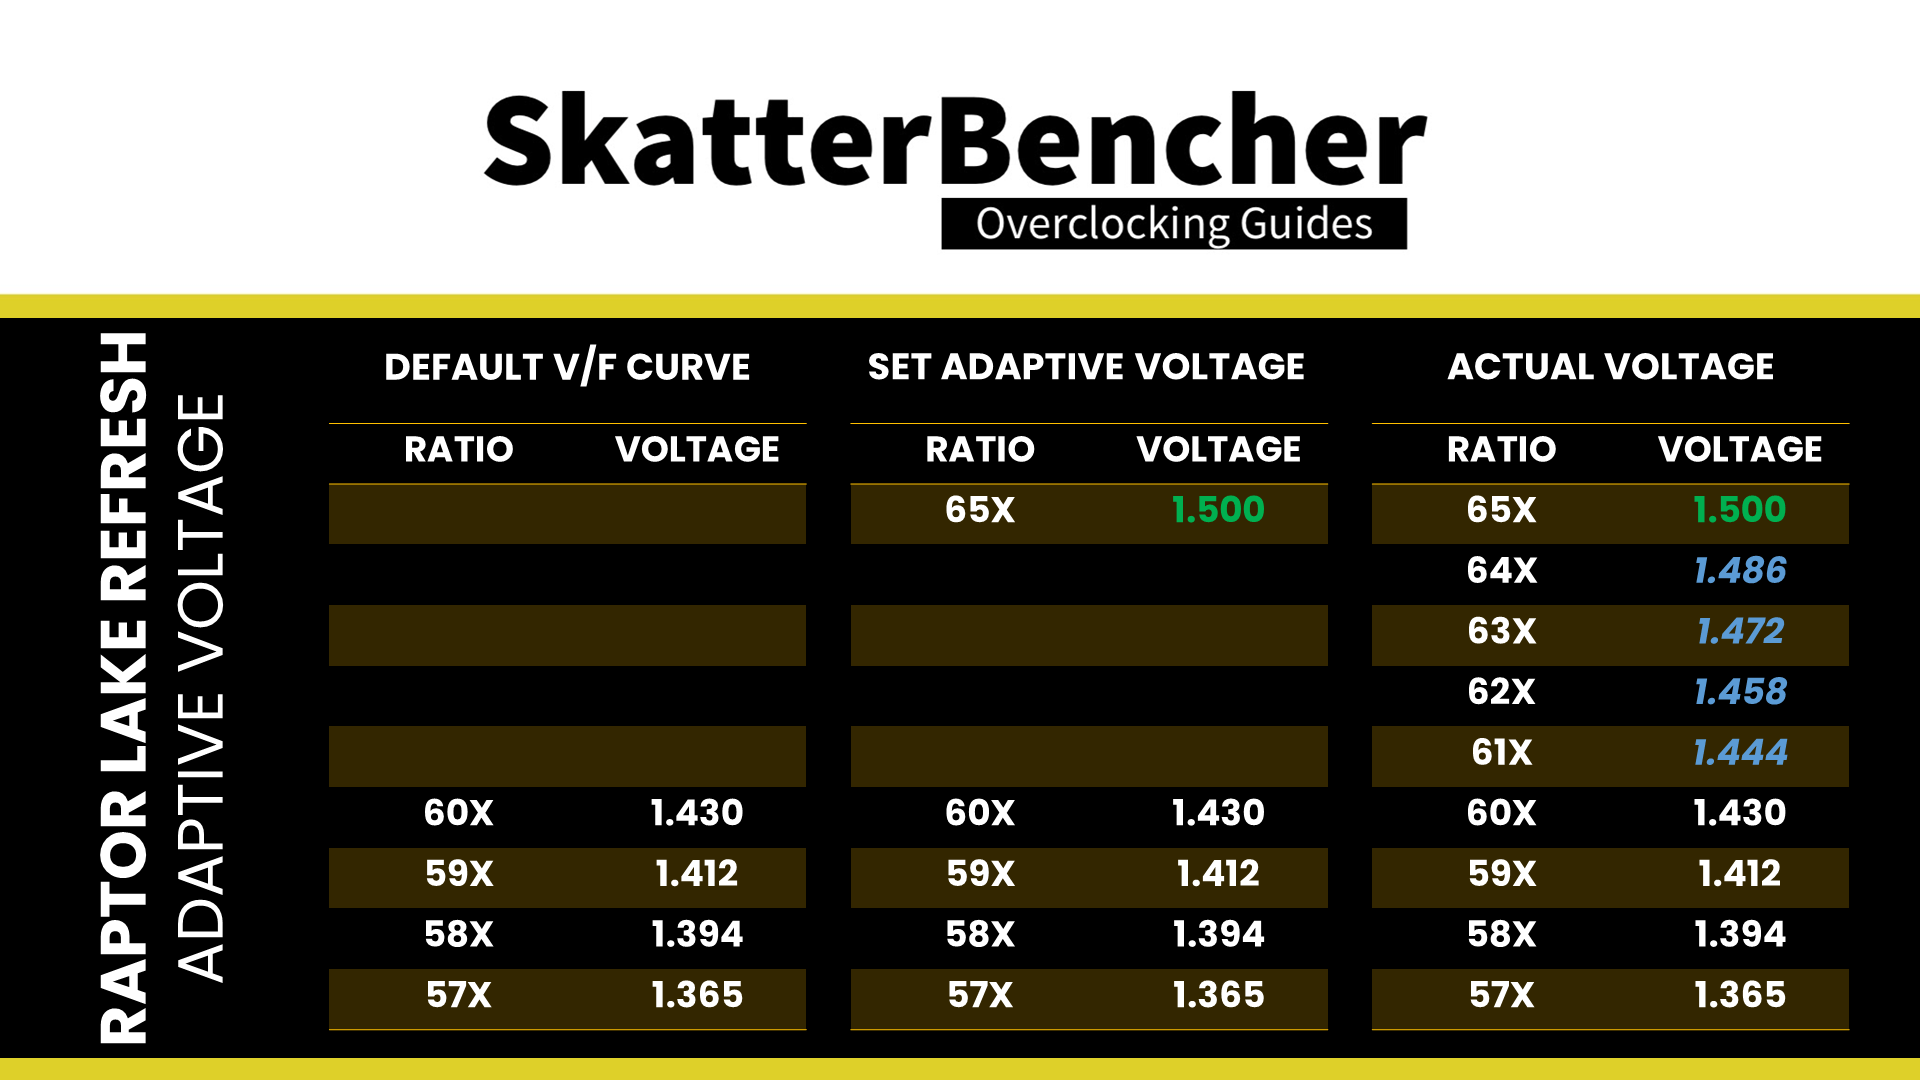
C) for ratios between the OC Ratio and the next highest factory-fused V/f point, the voltage is interpolated between the set adaptive voltage and the factory-fused voltage.
Returning to our example of our 14900K specified to run 60X at 1.43V, let’s say we manually configure the OC ratio to be 65X at 1.50V. The target voltage for ratios 61X, 62X, 63X, and 64X is now interpolated between 1.43V and 1.50V.
Modern CPUs like the 14900K have many more tools to adjust the CPU’s factory-fused voltage-frequency curve. These tools include:
- Per P-core Voltage (override & adaptive, target & offset)
- Per E-core Group Voltage (override & adaptive, target & offset)
- Ring Voltage (override & adaptive, target & offset)
- P-core Advanced Voltage Offset (V/F points)
- Ring Advanced Voltage Offset (V/F points)
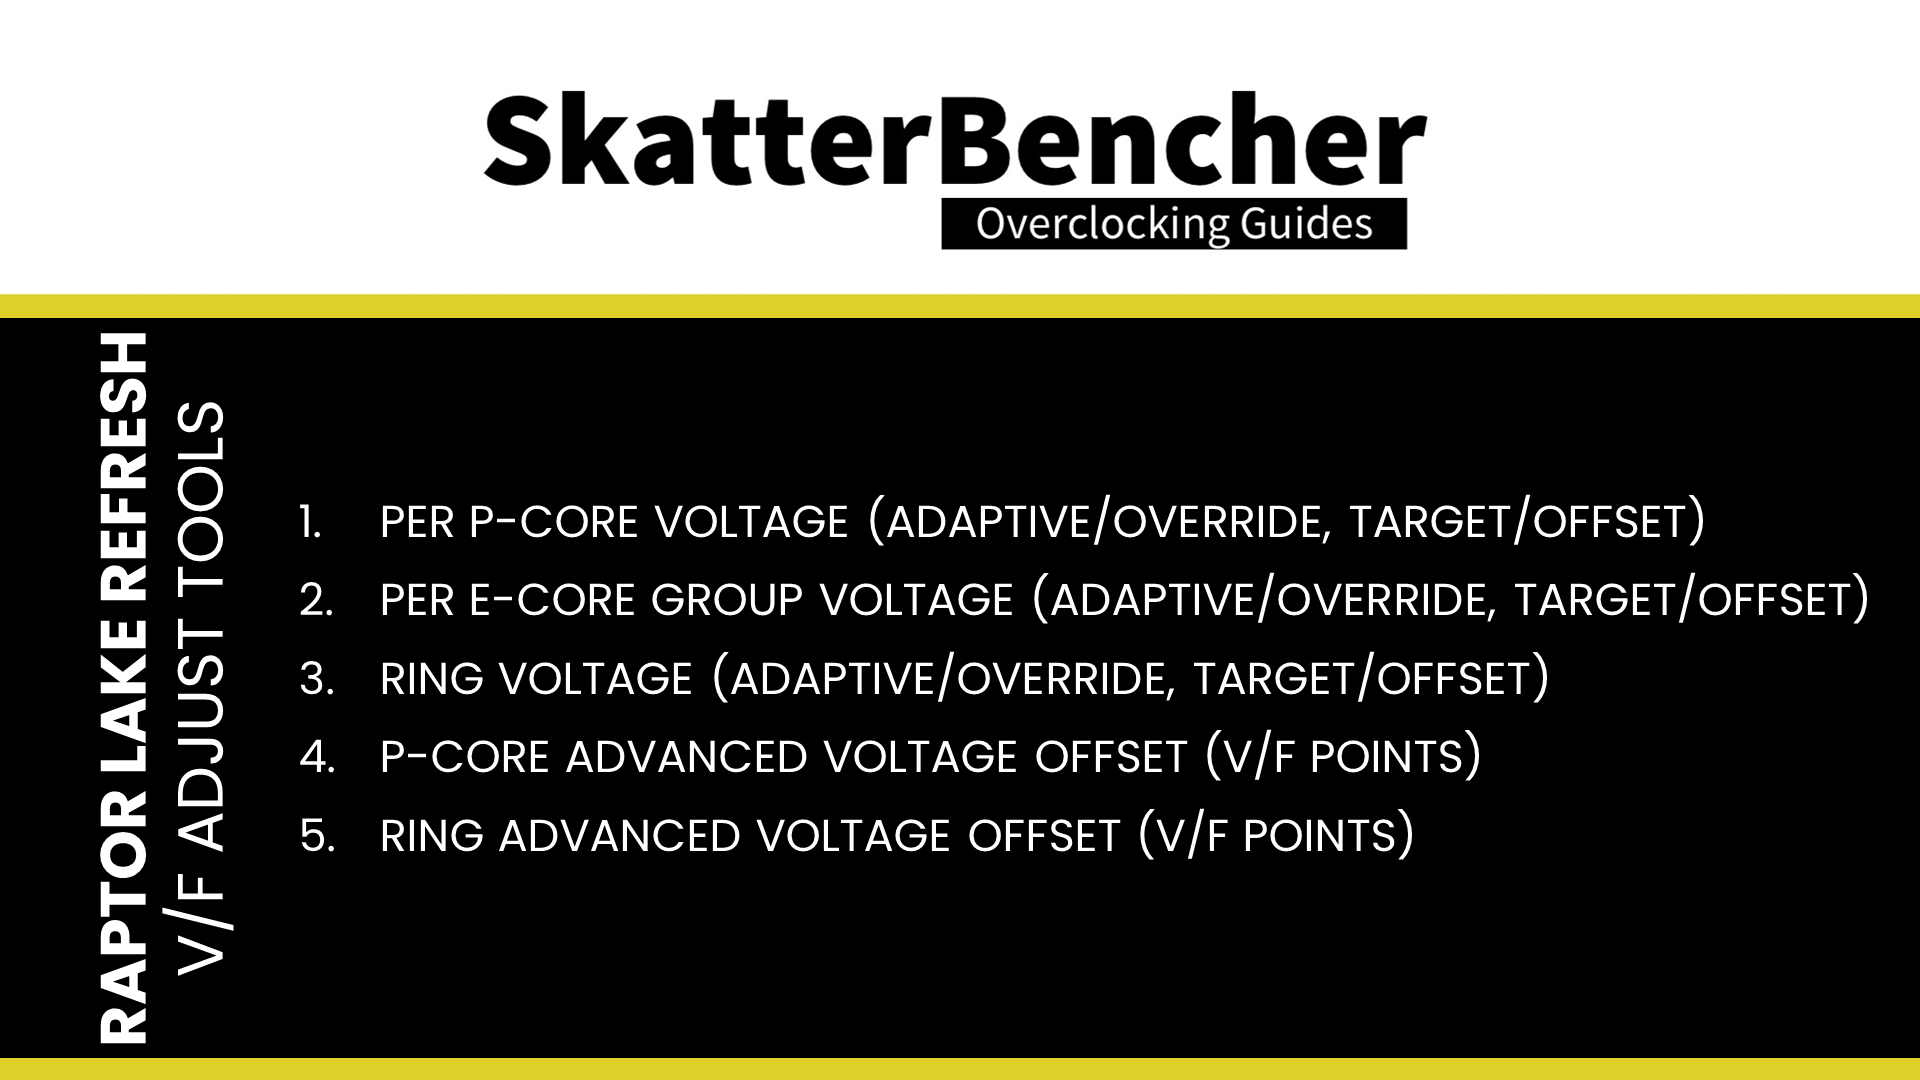
The critical thing to remember about all these options is that, ultimately, all these options determine the SVID request from the CPU to the motherboard voltage regulator, which sets the voltage for the VccIA voltage rail.
AVX Voltage Guardband & Guardband Scale Factor
Specific types of workloads can also affect the SVID voltage request from the CPU to the voltage controller. A prime example is the AVX voltage guardbands that prevent the voltage from dropping too low in case the workload uses AVX instructions. The Guardband effectively serves as upper and lower limits to the voltage request.
Since Rocket Lake, end-users can make minor adjustments to the AVX Guardband by using the AVX Guardband Scale Factor. Unfortunately, I can’t comment more on this tool’s effectiveness as I haven’t dug too deep into this technology.
Note that I’m not talking about the AVX Ratio Offset tool, which reduces the CPU ratio when AVX instructions are used. We’ll talk about those later in the guide.
Intel Thermal Velocity Boost Voltage Optimizations
As discussed earlier in the blog post, Thermal Velocity Boost is an Intel technology that exploits the fact that CPUs need less voltage to run a specific frequency when the operating temperature is lower. When this setting is enabled, the CPU automatically adjusts the voltage according to the operating temperature by adjusting the CPU SVID request to the voltage regulator.
VccIA Voltage Delivery
The critical point of the SVID voltage request from the CPU to the voltage regulator is that the effective voltage at the CPU die is equal to the requested voltage. However, as overclockers and enthusiasts know very well, that’s not always the case. That’s because there are a lot of electrical components between the voltage regulator and the CPU die.
Two main elements will affect the voltage delivered to the CPU die: the AC loadline and motherboard voltage regulator (MBVR) configuration.
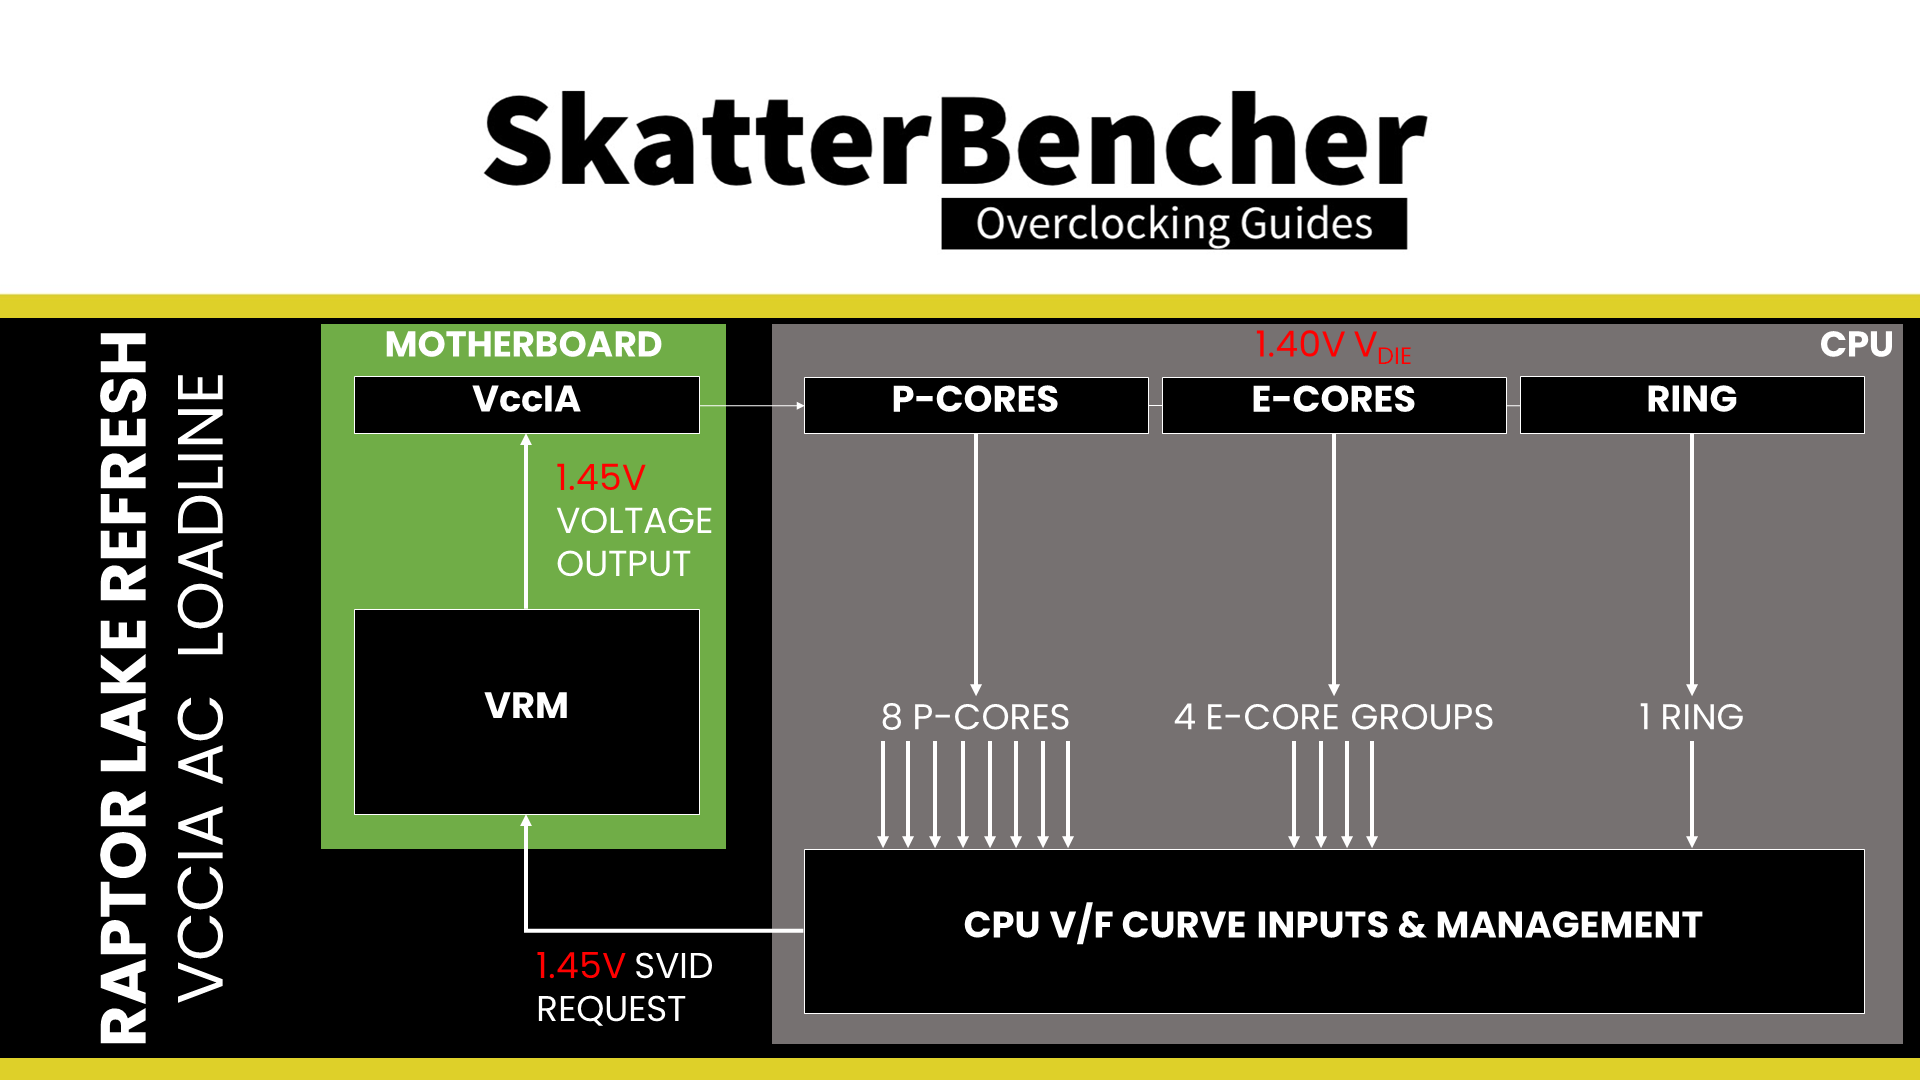
Intel AC Loadline
The AC loadline configuration option is designed for motherboard engineers to bring the electrical impedance of the motherboard design into the voltage-frequency curve equation. Electrical impedance is the opposition to alternating current and is affected by the VRM components, the PCB layout, and quality.
Electrical impedance can significantly affect the effective voltage at the CPU die. Therefore, there may be a significant difference between the requested and effective voltage. We can define the AC loadline parameters to account for this difference. Adjusting the AC loadline offsets the requested voltage to account for any electrical impedance. A higher AC LL setting will yield a higher effective voltage.
For example, suppose we know that a 1.4V voltage output by the voltage controller, as requested by the CPU, results in an effective voltage of 1.35V at the CPU die due to electrical impedance. In that case, we can configure the AC loadline such that the CPU requests 1.45V instead, making up for the difference.
An option tightly related to the AC loadline is the DC loadline. We must first discuss the motherboard voltage regulator configuration to understand its purpose.
Motherboard Voltage Regulator Configuration
The motherboard voltage regulator, or MBVR, is a crucial component of the power delivery to the CPU cores. Nowadays, voltage regulators are complicated microcontrollers that have a wide variety of configuration options on their own. But we can limit ourselves to two main options for our guide: voltage override and the loadline.
I can be short about the voltage override: most voltage regulators allow you to override the requested voltage with a static voltage or offset. Usually, you find these options hidden in the BIOS. However, some high-end or overclocking-focused motherboards may still expose the options.
The VR loadline is essential for the Vdroop and the voltage under and overshoot.
Vdroop is the decrease in voltage when the CPU goes from idle to load based on the electrical current. You want your CPU to be stable in all scenarios, so knowing the lowest voltage the CPU runs at is very important. After all, if the voltage is too low, the overclock won’t be stable.
Undershoot and its counterpart, overshoot, are brief voltage spikes when the CPU switches from idle to load or from load to idle. These spikes cannot be measured easily and usually require an expensive oscilloscope to detect. I highly recommend the ElmorLabs article titled VRM Load-Line Visualized to see a great picture of undershoot and overshoot in action.
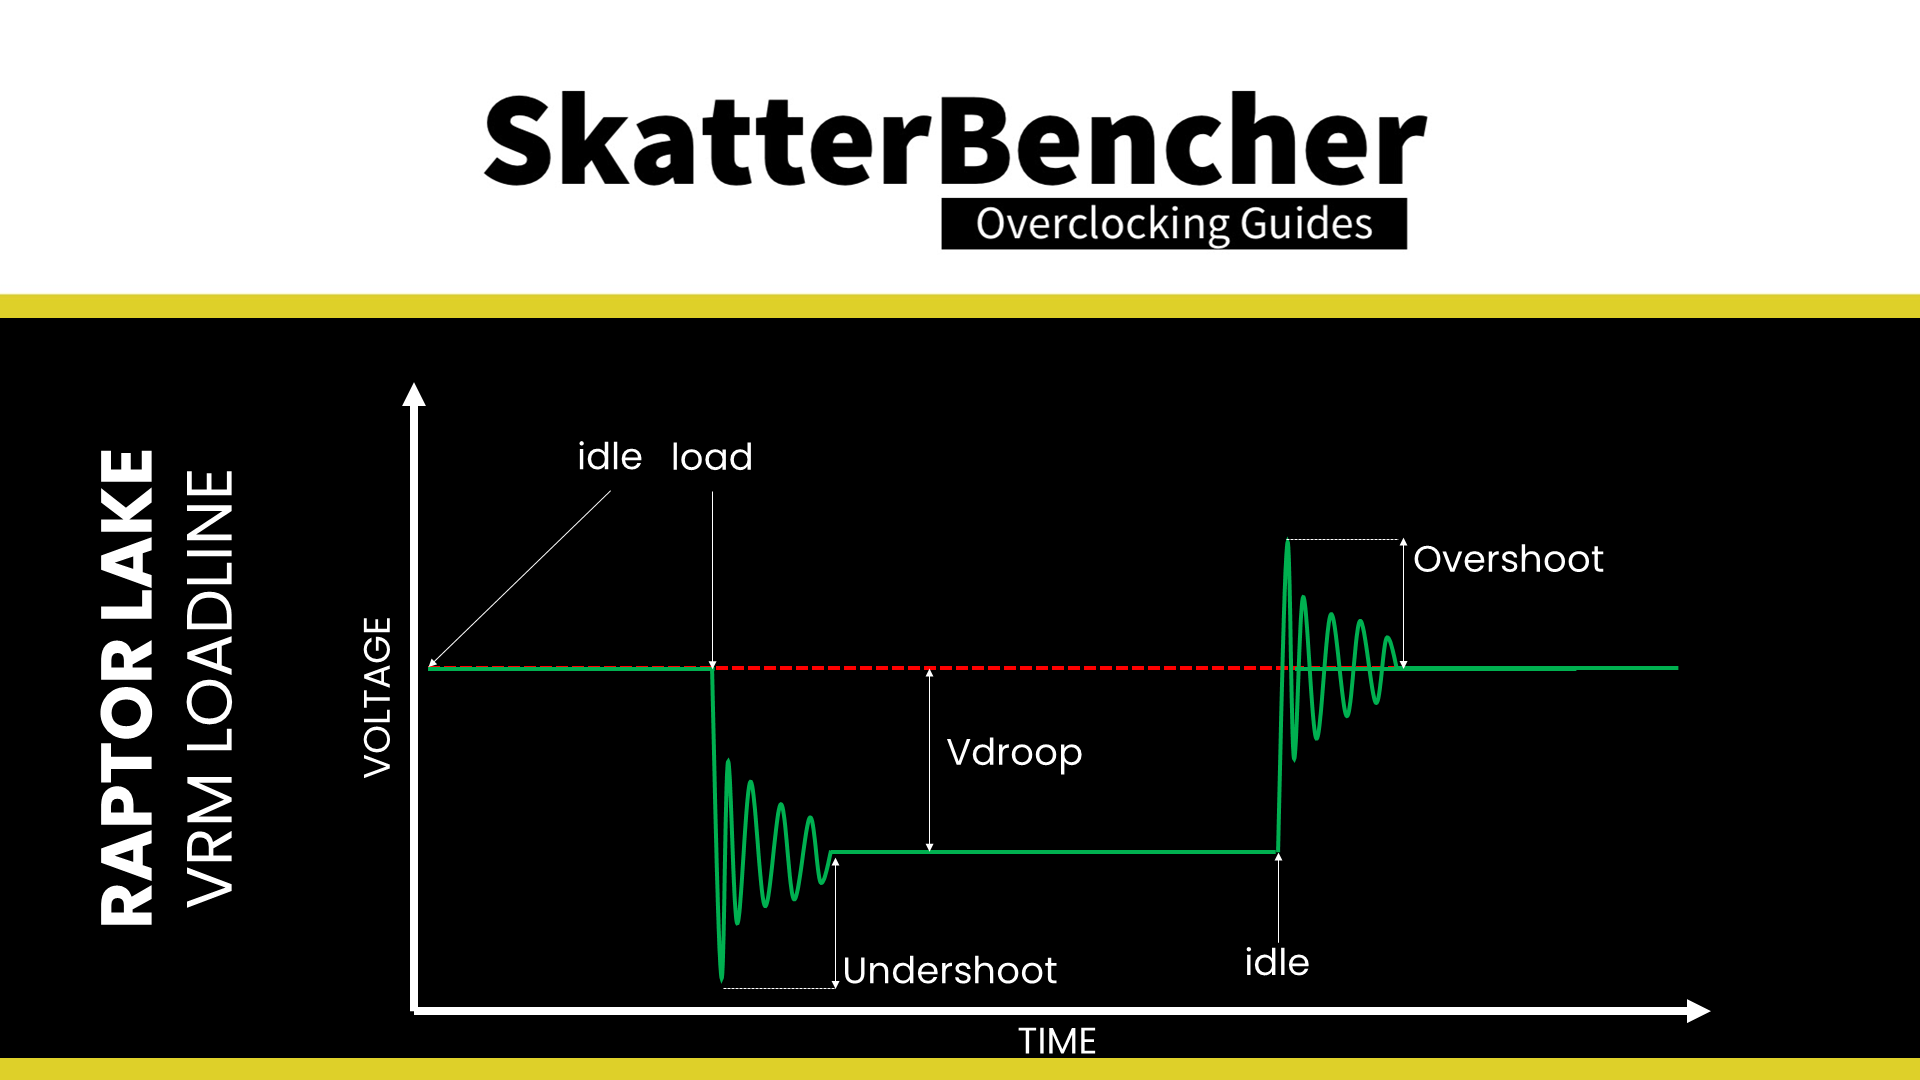
While undershoot and overshoot are temporary spikes, an undershoot that’s too low can cause instability.
Overclockers and enthusiasts use the VR loadline to decrease the effective voltage in all core, heavy workloads. Note that in the BIOS, we often get a selection of 6 to 8 options for the loadline configuration. Still, the voltage regulators offer a much higher degree of configurability, sometimes allowing you to set the loadline to the specific mOHM. The presets you find in your motherboard shouldn’t be compared to those of other boards and sometimes not even across different BIOS versions.
Intel DC Loadline
A final tool we must briefly discuss is the DC loadline. The long story short is that the Intel CPU relies, in part, on the SVID voltage request information to calculate power consumption. If the requested voltage deviates too much from the effective voltage, this may result in differing power readings.
For example, suppose the voltage-frequency point is 1.4V, but we’ve configured the AC loadline to 1.45V. If we don’t tell the CPU that a 1.45V VID request results in a 1.4V effective core voltage, then the CPU assumes the effective voltage is 1.45V. That skews any power management metrics that rely on the VID information.
By adjusting the DC loadline to account for the expected difference in voltage between the requested VID and the effective voltage, we ensure the CPU power management unit has the correct information to do its power calculations. Typically, the DC loadline setting is the last option you adjust to match the CPU VID reading to the effective voltage at the CPU die. Some motherboards may also have auto-rules that configure the DC loadline for you.
VccIA Voltage Summary
So, after having said all this, what’s the next step? Consider this board’s default configuration used in OC Strategies #2 and #3.
The main difference between the motherboard stock configuration and OC Strategy #3 is that we disable the Thermal Velocity Boost Voltage Optimizations. We do this because we want to undervolt the CPU. By disabling the voltage optimizations, we get a much higher voltage at the top end of the voltage frequency curve, especially in idle, where the CPU temperature is far below the TjMax. That is despite not touching the voltage for that V/F Point.
In addition, using the negative V/F Point offset can reduce the voltage used in demanding all-core workloads.
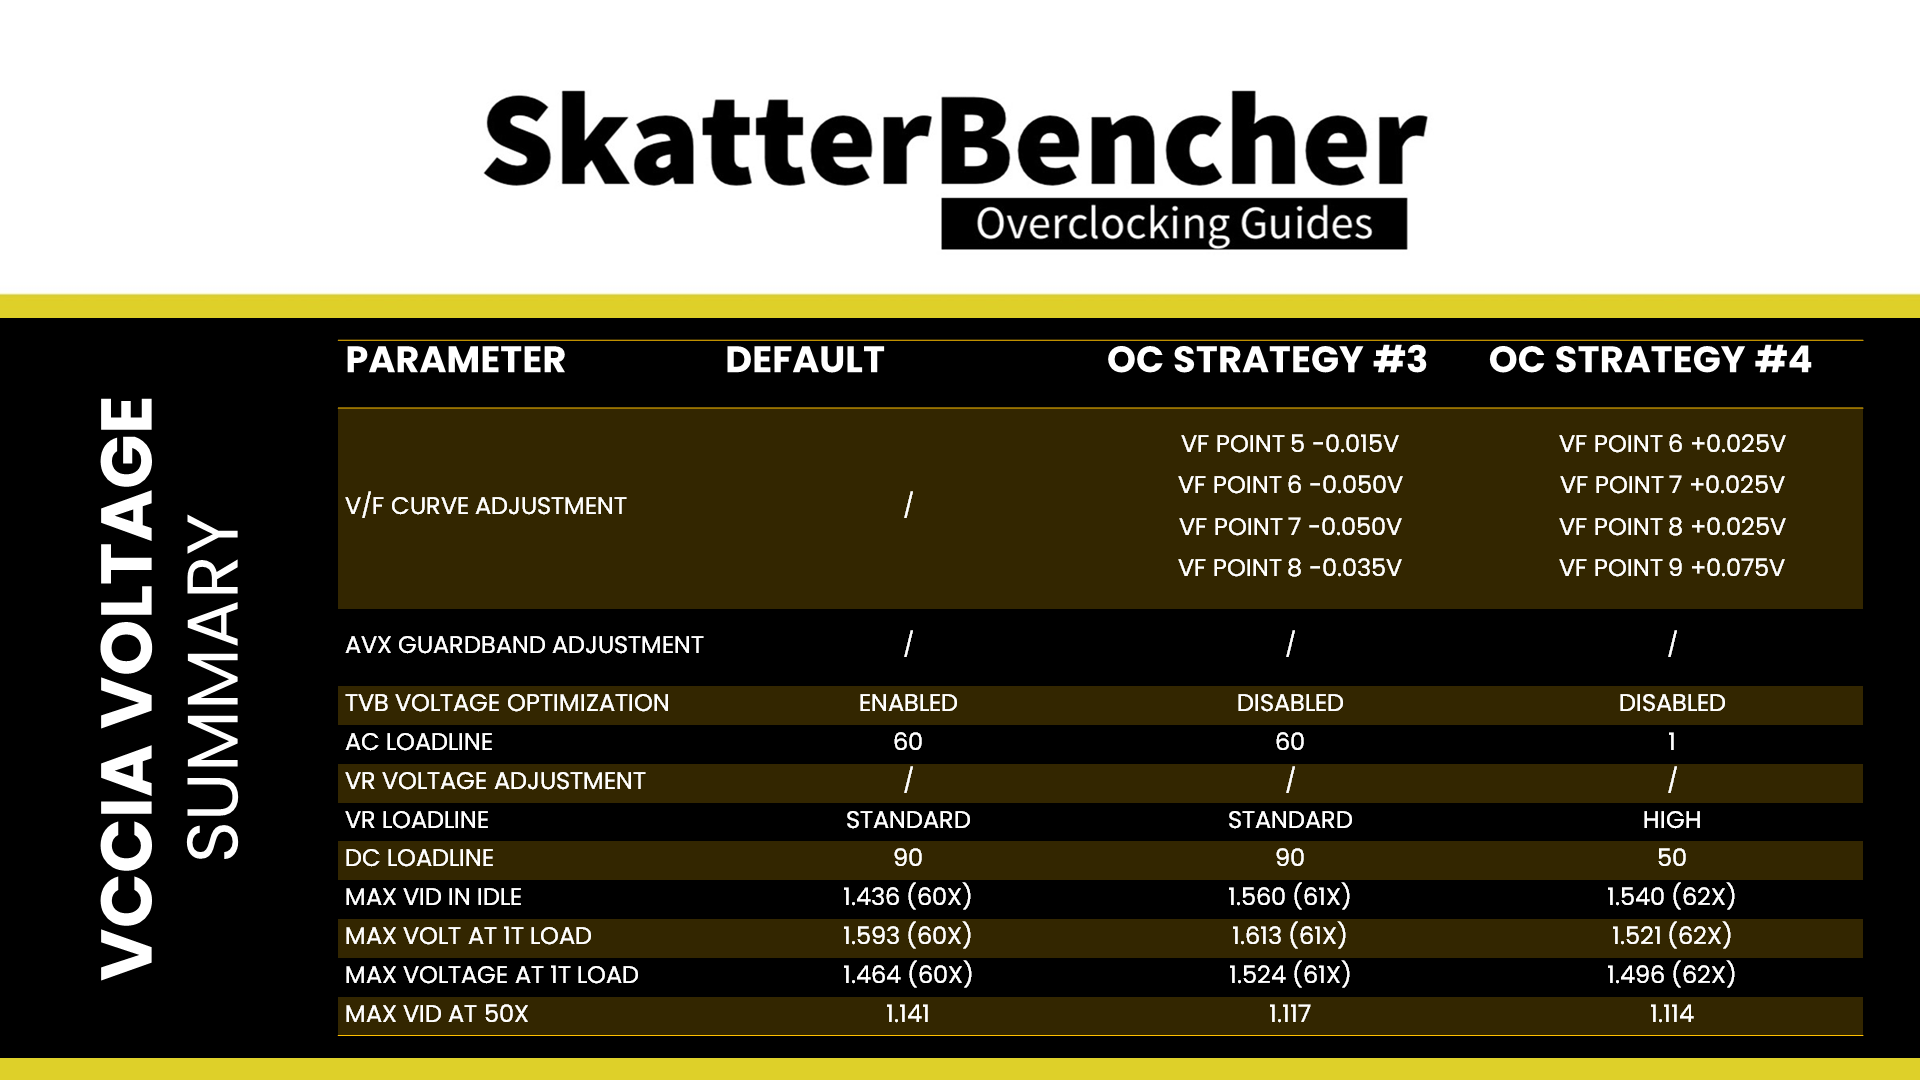
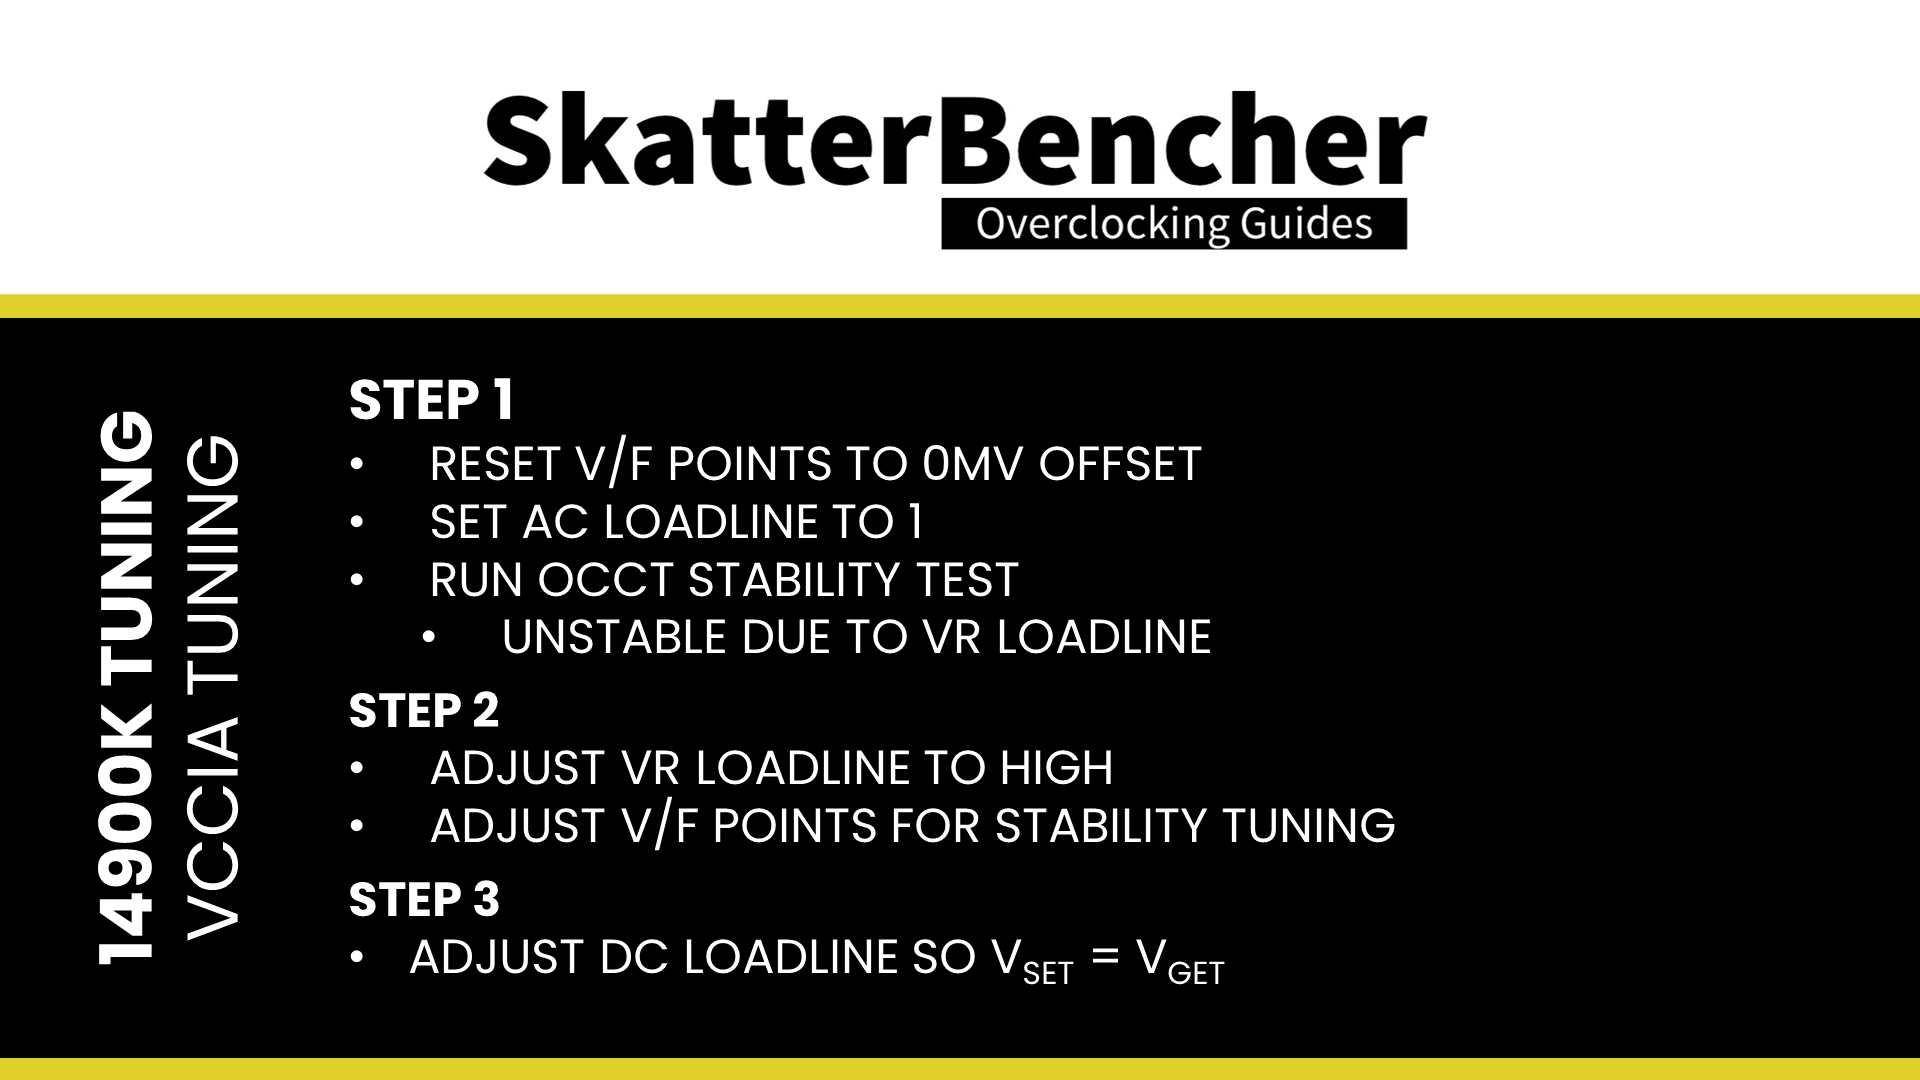
For the fourth overclocking strategy, I reset the V/F Points to their default value of 0 and set the AC loadline to 1. Then, I check the stability of the OCCT all-core workload. Of course, the system is unstable because the VR loadline is set too aggressively. This drops the effective voltage under a heavy workload too much.
Adjusting the VR loadline to High from Standard gives us a more reasonable voltage under an all-core load. It’s still not entirely stable with our overclock, so I use the V/F Points again to increase the voltage for better stability.
As a last step, I also adjust the DC loadline value so that the CPU VID matches the CPU core voltage.
The result is that we have a lower maximum voltage at the top end of the voltage-frequency curve and, at the same time, still have a low voltage in all-core workloads. As you’ll see, this configuration yields an extra +60 MHz in our OCCT all-core stress test.
Intel Per Core Ratio Limit
Intel Per Core Ratio Limit allows you to set a maximum CPU Core Ratio for every P-core and E-core group separately. This enables two crucial new avenues for CPU overclocking.
- First, it allows users to individually overclock each core and find the maximum stable frequency.
- Second, it allows users to set an aggressive by core usage overclock while constraining the worst cores.
When we set a Per Core Ratio Limit, counter-intuitively, this Ratio doesn’t act as a core-specific OC Ratio but as a means to limit what parts of the V/F curve can be used. Let’s say we have a CPU that can run up to 64X.at 1.60V. If we set the ratio limit for a core to 62X, the CPU core will boost to 6.2 GHz at a voltage interpolated between 64X at 1.60V and the next lower factory-fused V/F point.

In this OC Strategy, we use the Per Core Ratio Limit function to get six of the eight P-cores to 6.2 GHz, whereas the other two remain at a maximum of 6.1 GHz.
AVX Ratio Offset
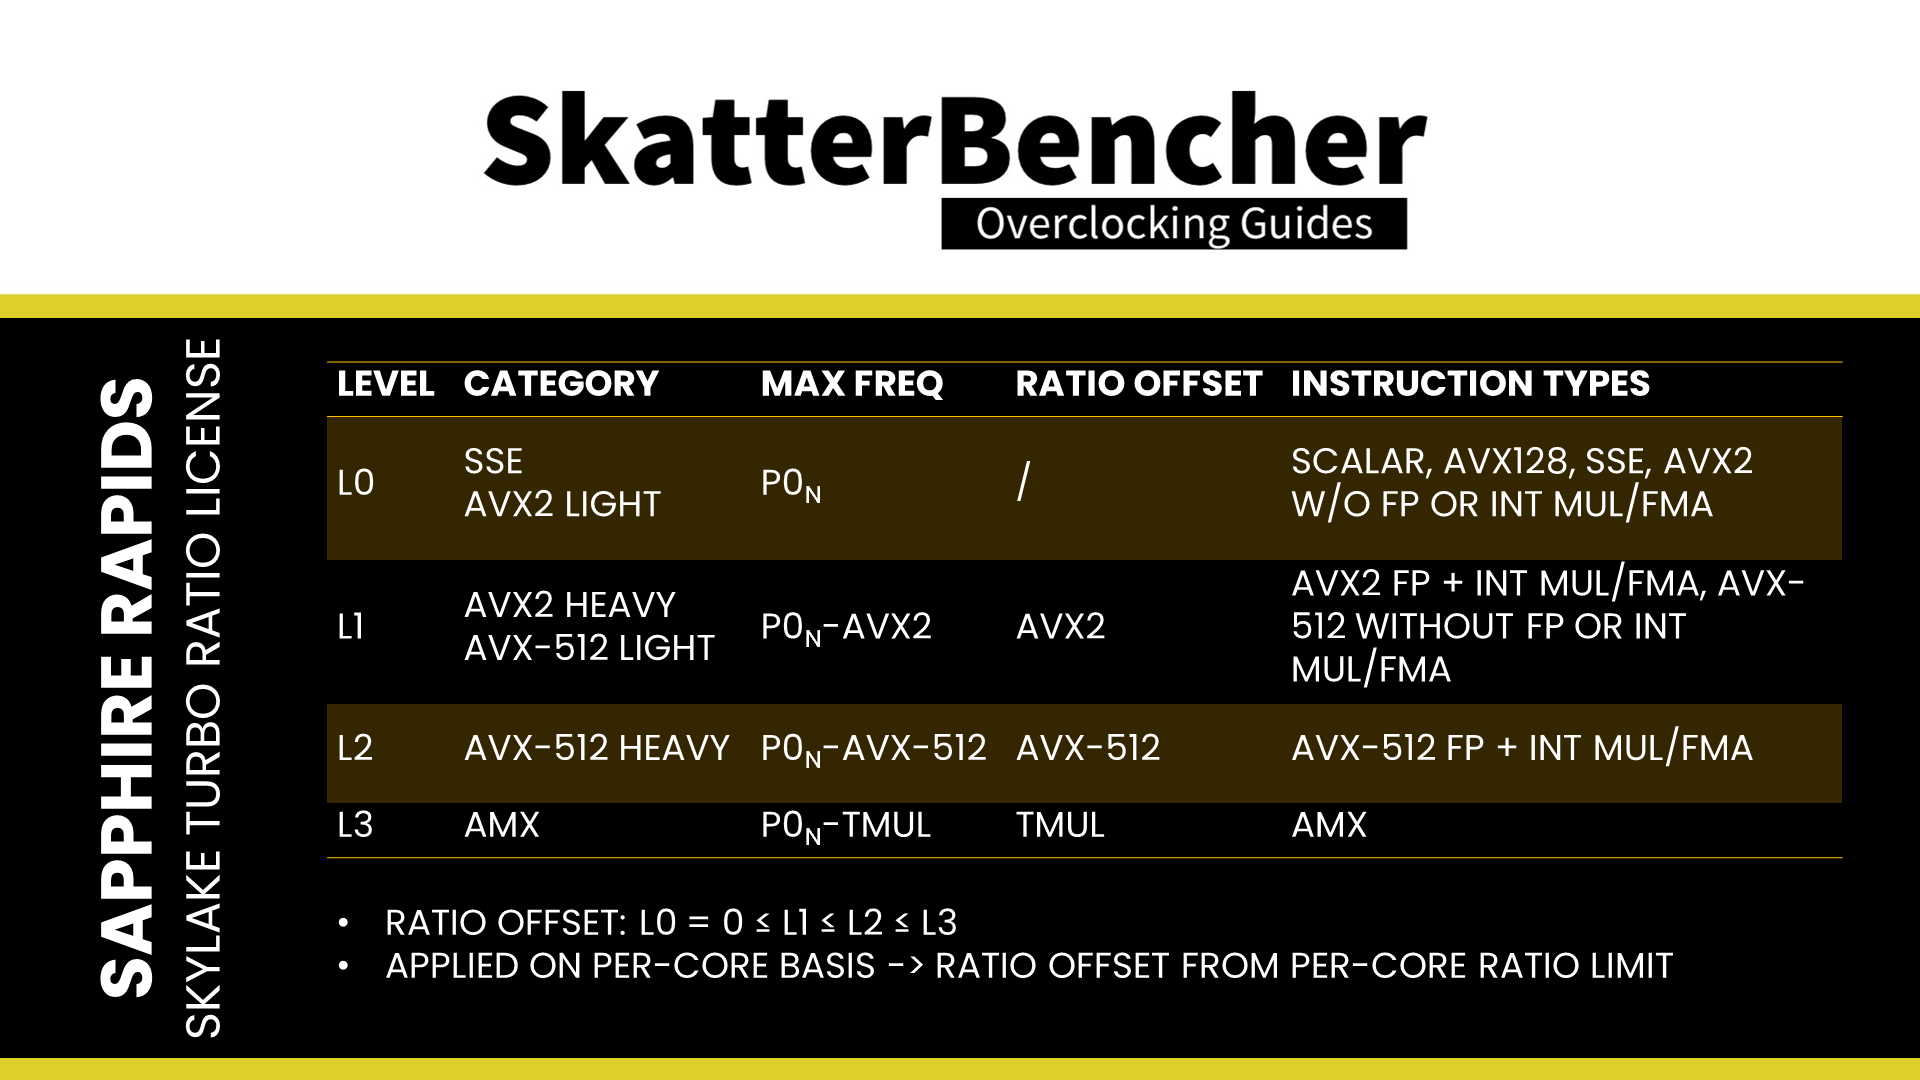
A final topic for this OC Strategy is the AVX Ratio Offset. Intel first introduced the AVX negative ratio offset on Broadwell-E processors. Successive processors adopted this feature and eventually expanded it with AVX2. AVX-512, and, on Sapphire Rapids, even the AMX ratio offset.
The ratio offsets help achieve maximum performance for SSE, AVX, and AMX workloads. The specific behavior of the AVX ratio offset has changed over time. Nowadays, the offsets are not triggered immediately when an instruction is detected but based on the mix of instructions over a certain period. The offsets work according to an elegant frequency license-based approach. The four frequency levels are L0, L1, L2, and L3. Each level is associated with a particular load ranging from lightest to heaviest. Each level can also be associated with one specific ratio offset.
The most practical example of this impacting our overclock is Cinebench 2024. While it is an AVX accelerated workload, it doesn’t trigger the AVX2 ratio offset, causing it to run at the configured all-core ratio. On this system, I found that Cinebench 2024 was the limiting factor for my all-core overclock since, no matter what, the P-cores of this CPU can’t run Cinebench 2024 at 5.8 GHz.
This method of activating ratio offsets makes it slightly more challenging to finetune your CPU since some AVX2 workloads may not trigger the AVX2 ratio offset. I illustrated this in detail in my Alder Lake launch content.
There are some additional rules you need to keep in mind.
- By default, the AVX2 ratio offset is 0. However, the maximum ratio during an AVX workload is the Turbo Boost 2.0 ratio. Effectively, the AVX2 performance is limited to 5.7 GHz when all cores are active and 6.0 GHz when up to two favored cores are active.
- The AVX Ratio Offset is applied for each core independently based on the Per Core Ratio Limit. Setting an offset of -1, like we do for this OC Strategy, results in a maximum AVX frequency of 6.1 GHz for six out of the eight P-cores.
BIOS Settings & Benchmark Results
Upon entering the BIOS
- Switch to Advanced Mode
- In the Tweaker menu
- Set GIGABYTE PerfDrive to Unleash
- Enter the Advanced CPU settings submenu
- Set Voltage Reduction Initiated TVB to Disabled
- Set AVX Settings to User Defined
- Set AVX Offset to 1
- Set AVX Optimum to Enabled
- Set Active Turbo Ratios to Manual
- Set Turbo Ratio (1 P-Core Active) to (6 P-Core Active) to 62
- Set Turbo Ratio (7 P-Core Active) and (8 P-Core Active) to 57
- Set Turbo Per Core Limit Control to Manual
- Set Turbo P-Core 0, 2, 3, 4, 5, and 6 Ratio Limit to 62
- Set Turbo P-Core 1 and 7 Ratio Limit to 61
- Leave the Advanced CPU Settings submenu
- Set High Bandwidth to Enabled
- Set Low Latency to Enabled
- Set Extreme Memory Profile(X.M.P.) to XMP 1
- Set Vcore Voltage Mode to Adaptive Vcore
- Set VF Offset Mode to Selection
- Set VF Point 6 to 8 Offset to +0.025V
- Set VF Point 9 Offset to +0.075V
- Set VF Offset Mode to Selection
- Enter the Advanced Voltage Settings submenu
- Enter the CPU/VRM Settings submenu
- Set CPU Vcore Loadline Calibration to High
- Enter the Internal VR Control submenu
- Set IA VR Config Enable to Enabled
- Set IA AC Loadline to 1
- Set IA DC Loadline to 50
- Set IA VR Config Enable to Enabled
- Enter the CPU/VRM Settings submenu
Then save and exit the BIOS.
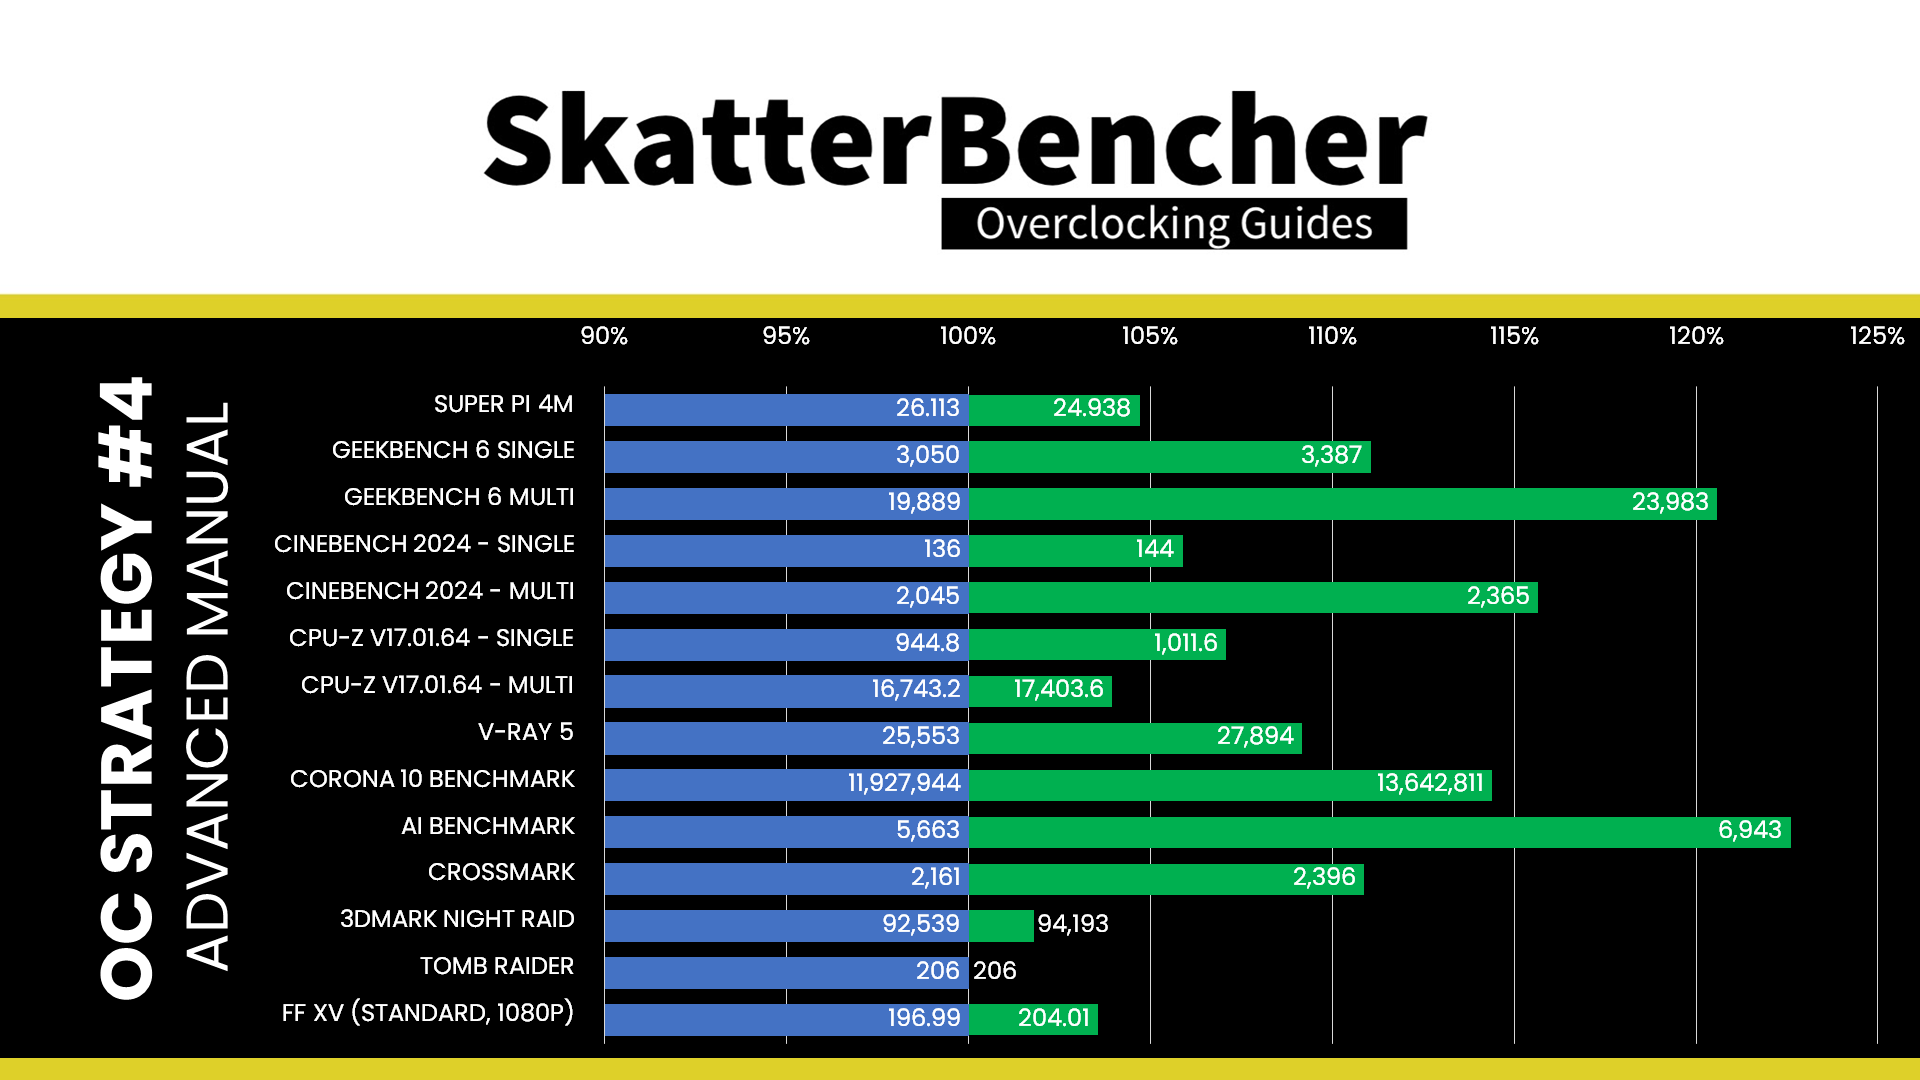
We re-ran the benchmarks and checked the performance increase compared to the default operation.
- SuperPI 4M: +3.18%
- Geekbench 6 (single): +10.03%
- Geekbench 6 (multi): +20.54%
- Cinebench 2024 Single: +3.68%
- Cinebench 2024 Multi: +15.21%
- CPU-Z V17.01.64 Single: +4.14%
- CPU-Z V17.01.64 Multi: +3.40%
- V-Ray 5: +8.72%
- Corona Benchmark: +12.20%
- AI Benchmark: +22.71%
- Crossmark: +10.87%
- 3DMark Night Raid: +1.66%
- Tom Raider: +0.00%
- Final Fantasy XV: +3.89%
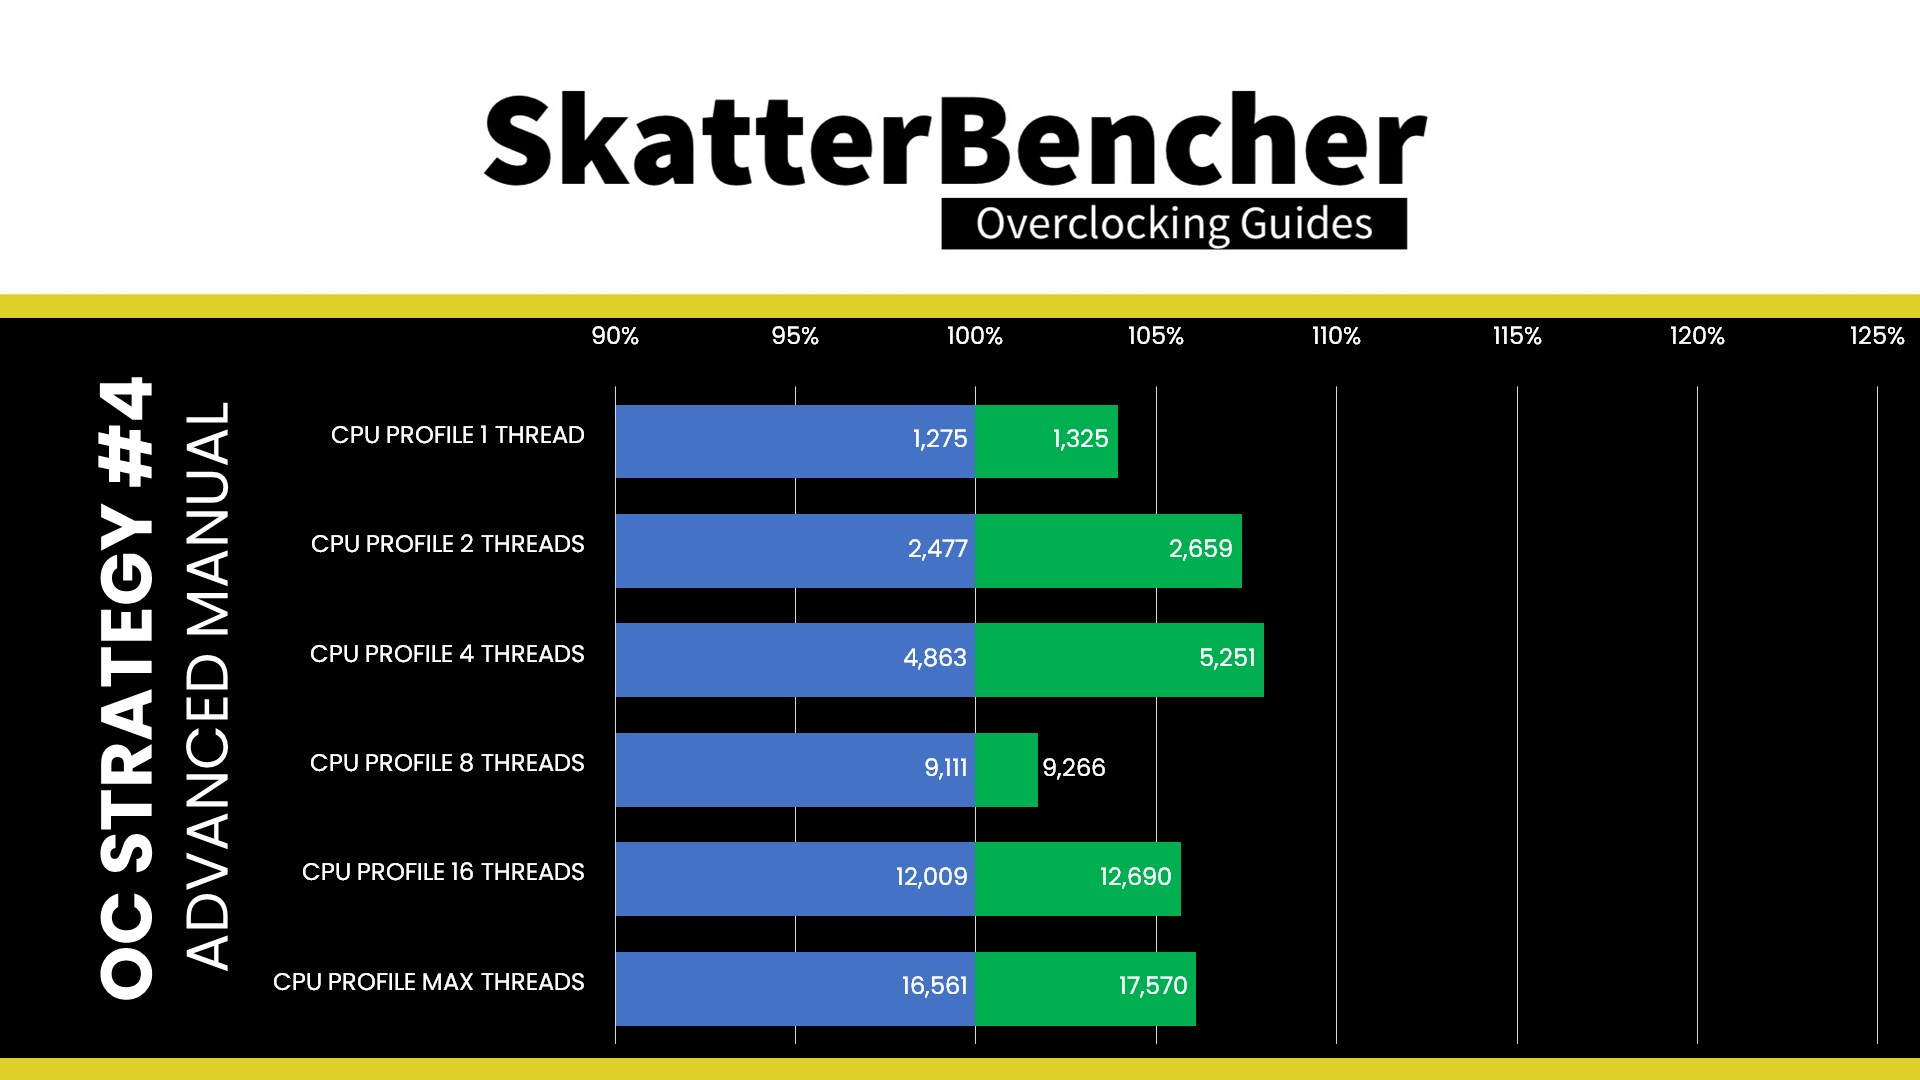
Here are the 3DMark CPU Profile scores:
- CPU Profile 1 Thread: +2.98%
- CPU Profile 2 Threads: +5.77%
- CPU Profile 4 Threads: +6.27%
- CPU Profile 8 Threads: +1.70%
- CPU Profile 16 Threads: +5.78%
- CPU Profile Max Threads: +5.59%
We’re adding only a bit of P-core frequency to this CPU, so the performance improvements are not expected to be huge. That said, we get a gain of +20.54% in Geekbench 6 Multi and +22.71% in AI Benchmark. Not too shabby!
When running the OCCT CPU AVX2 Stability Test, the average CPU P-core effective clock is 5387 MHz, and the average CPU E-core clock is 4385 MHz with 1.187 volts. The average CPU temperature is 100 degrees Celsius. The ambient and water temperatures are 26.4 and 30.9 degrees Celsius. The average CPU package power and CPU input power is 364.0 and 399.6 watts.

When running the OCCT CPU SSE Stability Test, the average CPU P-core effective clock is 5645 MHz, and the average CPU E-core clock is 4219 MHz with 1.229 volts. The average CPU temperature is 100 degrees Celsius. The ambient and water temperatures are 26.2 and 30.7 degrees Celsius. The average CPU package power and CPU input power are 359.4 and 390.8 watts.

Intel Core i9-14900K: Conclusion
Alright, let us wrap this up.
It’s taken me quite some time to finish this guide. My original schedule had it ready for launch day, but I spent a lot of time away from Taiwan in the weeks leading up to the launch. Then, there were a lot of little challenges that kept pushing back this guide. While it’s pretty late, I hope it can still be helpful to some.
Overall, I feel that the 14900K is squeezed to the max. That makes sense for a Refresh product, and it’s great for people who just plug and play the CPU. For enthusiasts, the main tuning opportunities lie in improving the memory performance, undervolting the CPU, and leveraging OCTVB. I didn’t do the latter in this guide, but that would’ve added another 100 or 200 MHz on top of the 6.2 GHz.
I plan to cover more Raptor Lake Refresh products in the future, so stay tuned if you want to see me overclock the 14700K, 14600K, and use Cryo cooling.
Thanks to my Patreon supporters for supporting my work. If you have any questions or comments, please drop them in the comment section below. See you next time!
Jim
Thank you for your work on this! From the numbers, looks like its pointless going from #3 to #4.
Sunman
Hi,
OTVB needs to be on or off when using OC Strategy #3: Simple Manual Overclock?
Pieter
I recommend disabling TVB once you start overclocking because it impacts the voltage dynamically. It makes the tuning process a lot more complication because it could introduce instability in idle situations.