SkatterBencher #73: AMD Radeon 760M Overclocked to 3150 MHz

We overclock the AMD Radeon 760M integrated into the Ryzen 5 8600G APU to 3150 MHz with the GIGABYTE B650E Aorus Elite AX Ice motherboard and custom loop water cooling.
I already overclocked the Ryzen 5 8600G CPU cores in SkatterBencher #72. Still, today, we finally get to do the most exciting part of APU tuning: overclock the integrated graphics. Also, we spend a little time digging into memory timing tuning.
I hope to explain all that in this video. Let’s get started!
AMD Radeon 760M: Introduction
The Radeon 760M is not a new product from AMD, as it was also integrated into the 2023 Phoenix notebook processor lineup. For example, the Ryzen 5 7640HS already featured these integrated graphics. The Radeon 760M is only available on the desktop with the Ryzen 5 8600G APU.

The Ryzen 5 8600G is the second of two Phoenix1-based Ryzen 8000 desktop APUs codenamed “Hawk Point.” The Hawk Point processors were announced on January 8, 2024. A critical difference between the Ryzen 7000 CPUs and the Ryzen 8000G APUs is that the former is a multi-chiplet-based design, and the latter features a single monolithic die. What’s also exciting about the Ryzen 8000G processors is that it’s the first AMD desktop product manufactured using the TSMC N4 process.
Hawk Point is the successor to the Ryzen 5000 Cezanne APUs launched in 2021. I already overclocked the Ryzen 7 8700G and its integrated graphics in SkatterBenchers #69 and #70.
With the Radeon 700M integrated graphics, AMD finally brought the RDNA 3.0 architecture to the desktop, as the integrated graphics for the Ryzen 7000 processors was still the RDNA 2.0 architecture. AMD announced the RDNA 3 graphics architecture on November 4, 2022, during their Together We Advance_Gaming event. About a month later, the first RDNA 3 products entered the market with the Radeon RX 7900 XT and XTX featuring the Navi 31 chiplet. With the RX 7800 XT and RX 7600, AMD would later introduce Navi 32 and Navi 33.
Compared to RDNA 2, AMD claims a 17% IPC improvement. Combined with higher clocks and increased CU count, that translates into a 54% generational performance uplift. RDNA 3 also features the 2nd generation ray accelerators and other architectural improvements.
The Radeon 760M has four workgroup processors (WGP) with eight compute units (CUs) and eight Ray Accelerators. That’s significantly less than the entry-level Radeon RX 7600 discrete graphics, which features 16 WGPs. The maximum GPU frequency is 2.8 GHz. The TDP is 65W, and the TjMax is 95 degrees Celsius.
In this video, we will cover five different overclocking strategies:
- First, we enable AMD Precision Boost Overdrive 2 and EXPO technologies,
- Second, we will tune the PBO 2 parameters to squeeze more performance,
- Third, we manually tune the frequencies relevant to Radeon 760M performance,
- Fourth, we finetune the memory timings and add a CPU overclock,
- Lastly, we switch to a higher-performance memory configuration.
However, before we jump into overclocking, let us quickly review the hardware and benchmarks used in this video.
AMD Radeon 760M: Platform Overview
The system we’re overclocking today consists of the following hardware.
| Item | SKU | Price (USD) |
| CPU | AMD Ryzen 5 8600G | 230 |
| Motherboard | GIGABYTE B650E Aorus Elite AX Ice | 280 |
| CPU Cooling | EK-Pro QDC Kit P360 | 750 |
| Fan Controller | ElmorLabs EFC-SB | 50 |
| Memory | G.SKILL Trident Z5 DDR5-6400 | 120 |
| Power Supply | Antec HCP 1000W Platinum | 250 |
| Graphics Card | ASUS ROG Strix RTX 2080 TI | 490 |
| Storage | AORUS RGB 512 GB M.2 | 75 |
| Chassis | Open Benchtable V2 | 200 |
AMD Radeon 760M: Benchmark Software
We use Windows 11 and the following benchmark applications to measure performance and ensure system stability.
| BENCHMARK | LINK |
| Geekbench 6 (OpenCL, Vulkan) | https://www.geekbench.com/ |
| FurMark 2.1 (1080P) | https://geeks3d.com/furmark/ |
| AI Benchmark | https://pypi.org/project/ai-benchmark/ |
| 3DMark Night Raid | https://www.3dmark.com/ |
| 3DMark Speedway Stress Test | https://www.3dmark.com/ |
| 3DMark FSR Feature Test | https://www.3dmark.com/ |
| Simple Raytracing Benchmark (1080P, Basic) | https://marvizer.itch.io/simple-raytracing-benchmark |
| Unigine Superposition (1080P, DirectX) | https://benchmark.unigine.com/superposition |
| Spaceship (1080P, High) | https://store.steampowered.com/app/1605230/Spaceship__Visual_Effect_Graph_Demo/ |
| EzBench (1080P) | https://store.steampowered.com/app/770170/EzBench_Benchmark/ |
| Shadow of the Tomb Raider (1080P) | https://store.steampowered.com/app/750920/Shadow_of_the_Tomb_Raider_Definitive_Edition/ |
| Returnal | https://store.steampowered.com/app/1649240/Returnal/ |
| Final Fantasy XV (Standard, 1080P) | http://benchmark.finalfantasyxv.com/na/ |
| OCCT | https://www.ocbase.com/ |
| AIDA 64 | https://www.aida64.com/ |
The benchmark selection is similar to the one we used in other GPU SkatterBencher guides. To add some clarification:
- For AI Benchmark, I rely again on the TensorFlow-DirectML library. Note that I use Python 3.10, numpy 1.23.5, and the latest TensorFlow-DirectML.
- I use the 3DMark FSR Feature Test to measure the impact of overclocking on the performance improvement between FSR off and FSR on.
- I include two workloads for stress testing: the 3DMark Speedway Stress Test as a proxy for a gaming workload and the OCCT 3D Standard workload as a worst-case stress test.
AMD Radeon 760M: Stock Performance
Before starting overclocking, we must check the system performance at default settings. The default Precision Boost 2 parameters for the Radeon 760M are as follows:
- PPT: 87.8 W (Fast Limit, Slow Limit, APU Only Limit)
- TDC CPU: 75 A
- EDC CPU: 150 A
- THM: 95 C
- FMAX GFX: 2800 MHz
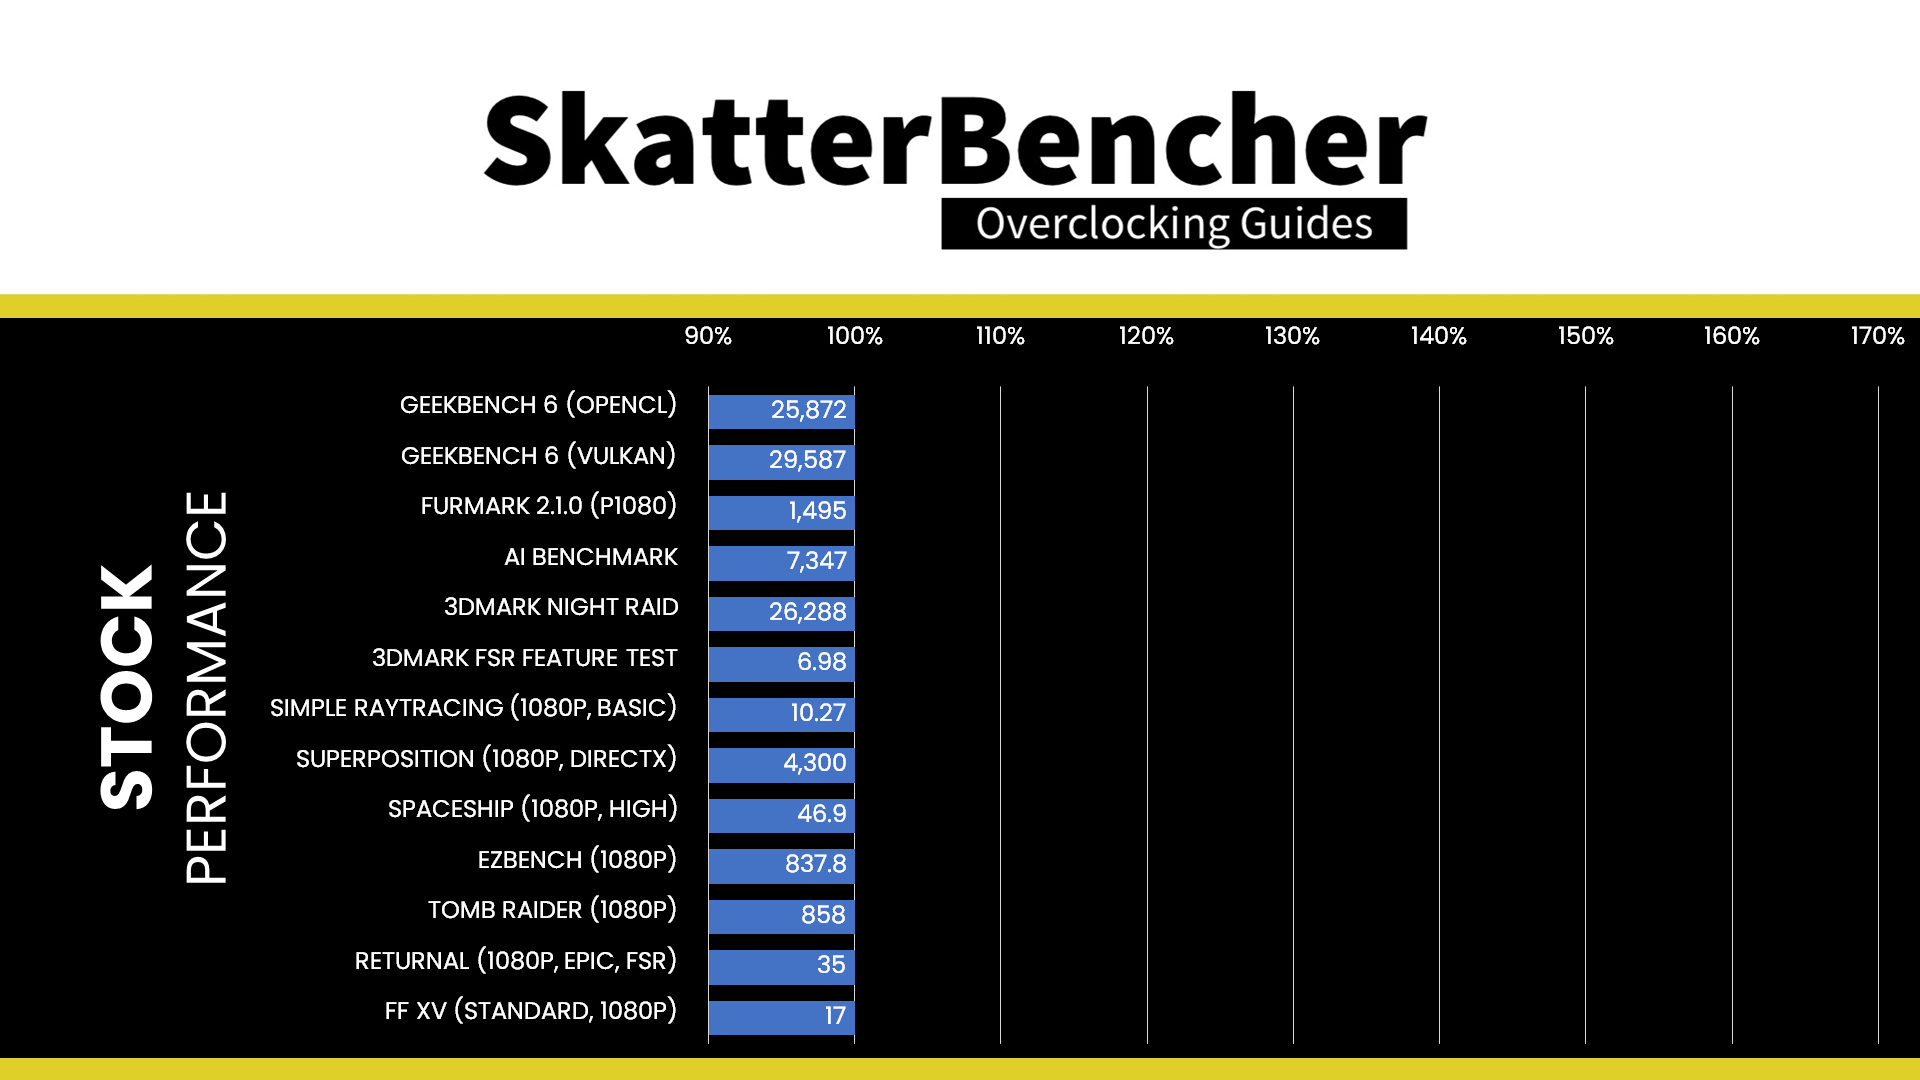
Here is the benchmark performance at stock:
- Geekbench 6 OpenCL: 25,872 points
- Geekbench 6 Vulkan: 29,587 points
- Furmark 2.1: 1,495 points
- AI Benchmark: 7,347 points
- 3DMark Night Raid: 26,288 marks
- 3DMark FSR Feature Test: 6.98 fps
- Simple RayTracing Benchmark: 10.27 fps
- Unigine Superposition: 4,300 points
- Spaceship: 46.9 fps
- EZBench: 858 points
- Shadow of the Tomb Raider: 35 fps
- Returnal: 17 fps
- Final Fantasy XV: 32.93 fps
When running the 3DMark Speedway Stability Test, the average GPU effective clock is 2816 MHz with 1.026 volts. The GPU memory clock is 2400 MHz. The average GPU ASIC Power is 52.5 watts.

When running the OCCT 3D Standard Stress Test, the average GPU effective clock is 2733 MHz with 1.010 volts. The GPU memory clock is 2400 MHz. The average GPU ASIC Power is 87.0 watts.

OC Strategy #1: PBO 2 + EXPO
In our first overclocking strategy, we take advantage of enabling Precision Boost Overdrive 2 and AMD EXPO.
Precision Boost Overdrive 2
Precision Boost Overdrive 2 is AMD’s proprietary overclocking toolkit, which enables customers to finetune the parameters governing the Precision Boost 2 algorithm. It is mainly used for CPU core overclocking but also has tools for overclocking the integrated graphics.
With the launch of Zen 3, AMD introduced an improved version of the Precision Boost Overdrive toolkit, allowing for manual tuning of even more parameters affecting the Precision Boost frequency boost algorithm. Precision Boost Overdrive 2 builds on the PBO implementation of Zen 2. In addition to the overclocking knobs from Zen+ (PPT, TDC, EDC) and Zen 2 (Boost Override and Scalar), Precision Boost Overdrive 2 also introduced Curve Optimizer.
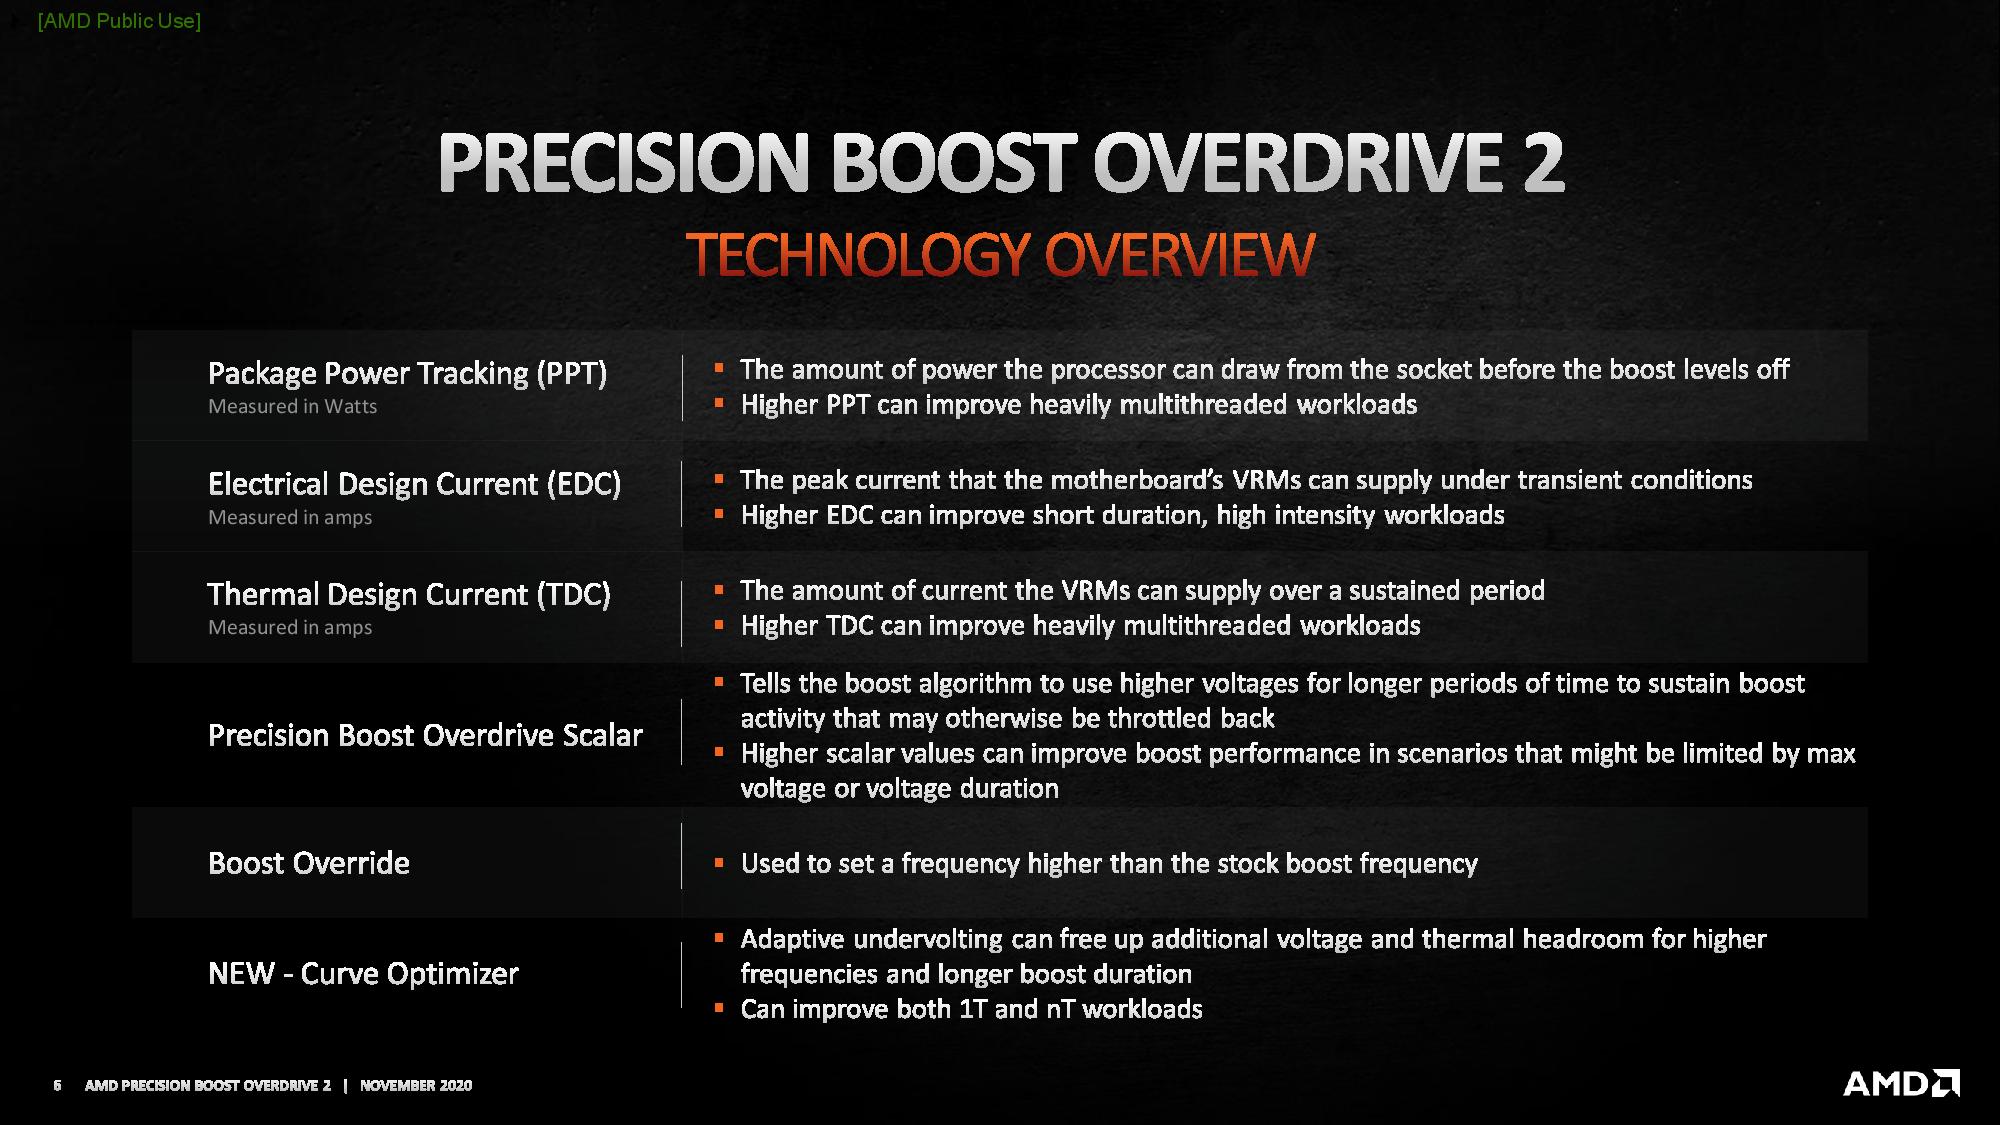
There are essentially 3 levels of Precision Boost Overdrive
- AMD’s stock values, which can be set by disabling PBO
- The motherboard vendor values, which are programmed into the BIOS to match the motherboard VRM specification and can be set by enabling PBO
- Custom values, which can be programmed by the end-user
By enabling Precision Boost Overdrive, we rely on the motherboard pre-programmed PBO parameters. We find that the following values have changed:

Increasing the PPT and, to a lesser extent, the TDC and EDC limit will help unleash the frequency in extreme workloads previously limited by the power limits.
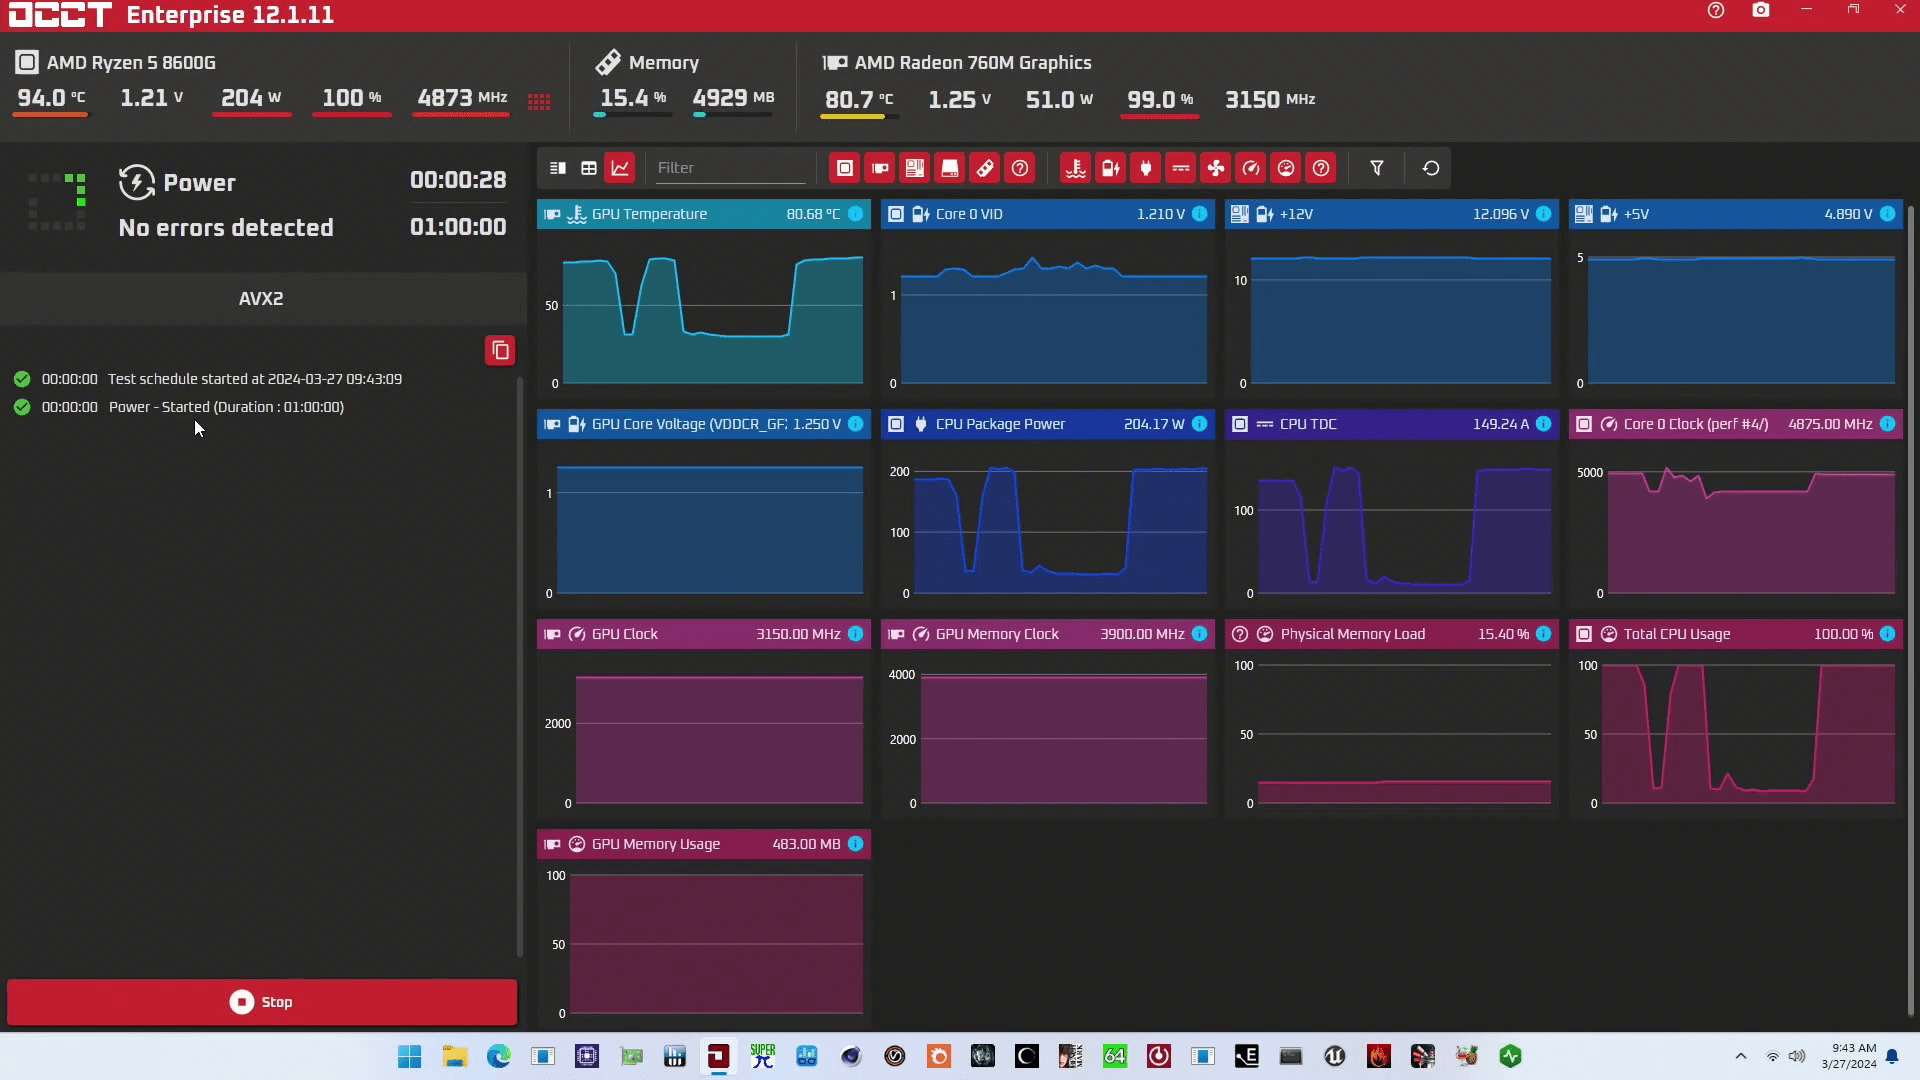
Unlocking the power limits can really make this little APU scream, especially in perhaps unrealistic workloads where we stress the CPU cores and the integrated graphics at the same time. An easy way to test this case is by using the OCCT Power test. Here, you can see the APU run at over 200W! That’s three times the rated TDP!
EXPO – Extended Profiles for Overclocking
EXPO stands for AMD Extended Profiles for Overclocking. It is an AMD technology that enables ubiquitous memory overclocking profiles for AMD platforms supporting DDR5 memory.
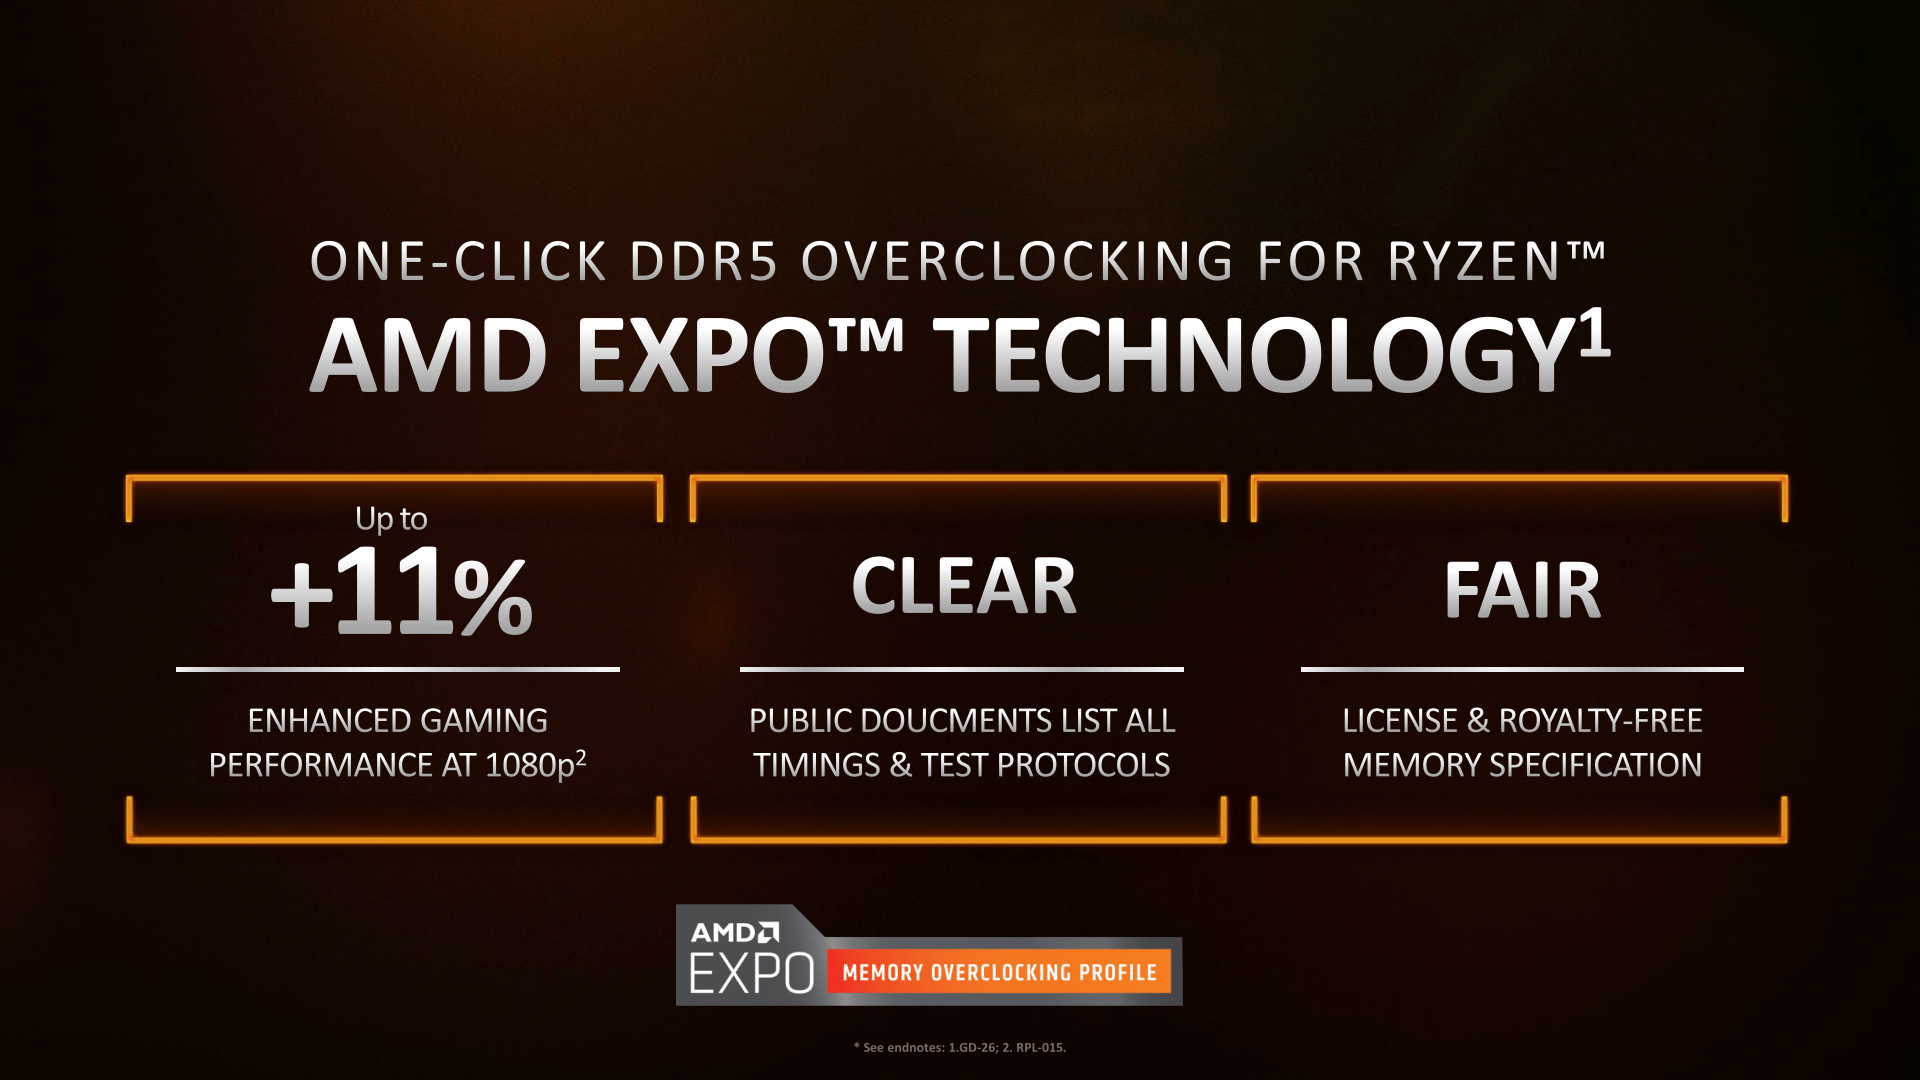
EXPO allows memory vendors such as G.SKILL to program higher performance settings onto the memory sticks. If the motherboard supports EXPO, you can enable higher performance with a single BIOS setting. So, it saves you lots of manual configuration.
As we’ll see later in the video, unlocking memory performance is critical to improving APU graphics performance.
BIOS Settings & Benchmark Results
Upon entering the BIOS
- In Easy Mode
- Set XMP/EXPO Profile to EXPO 1
- Switch to Advanced Mode and stay in the Tweaker menu
- Enter the Advanced CPU Settings submenu
- Enter the Precision Boost Overdrive submenu
- Set Precision Boost Overdrive to Enabled
- Enter the Precision Boost Overdrive submenu
Then save and exit the BIOS.
We re-ran the benchmarks and checked the performance increase compared to the default operation.
- Geomean: +12.99%
- Geekbench 6 OpenCL: +3.73%
- Geekbench 6 Vulkan: +15.34%
- Furmark 2.1: +20.67%
- AI Benchmark: +10.13%
- 3DMark Night Raid: +11.63%
- 3DMark FSR Feature Test: +9.89%
- Simple RayTracing Benchmark: +14.02%
- Unigine Superposition: +13.02%
- Spaceship: +14.93%
- EZBench: +10.96%
- Shadow of the Tomb Raider: +22.86%
- Returnal: +17.65%
- Final Fantasy XV: +18.07%

Unlocking the power limits and enabling higher memory performance significantly impacts the integrated graphics performance. The geomean performance improvement is +12.99%, and we get a maximum improvement of +22.86% in Tomb Raider.

When running the 3DMark Speedway Stability Test, the average GPU effective clock is 2824 MHz with 1.027 volts. The GPU memory clock is 3200 MHz. The average GPU ASIC Power is 62.2 watts.

When running the OCCT 3D Standard Stress Test, the average GPU effective clock is 2835 MHz with 1.050 volts. The GPU memory clock is 3200 MHz. The average GPU ASIC Power is 98.1 watts.

OC Strategy #2: PBO Tuned
In our second overclocking strategy, we tune the Precision Boost dynamic graphics frequency using the Precision Boost Overdrive 2 toolkit.
PBO 2: GPU Boost Override
Fused maximum frequency, or Fmax, is one of the Precision Boost infrastructure limiters constraining the graphics performance. The limiter determines the maximum allowed graphics frequency.
GPU Boost Clock Override or GPU Fmax Override is one of the overclocking tools available in the PBO 2 toolkit. It allows the user to override the arbitrary clock frequency limit up to +200 MHz in steps of 25 MHz. It’s important to note that the GPU Boost override only adjusts the upper ceiling of the frequency and doesn’t act as a frequency offset. Ultimately, the Precision Boost 2 algorithm still determines the actual operating frequency.

When we increase the GPU Fmax boost limit by 200 MHz, the new GPU Boost Fmax is 3000 MHz.
GIGABYTE High Bandwidth Support
A last quick setting I want to discuss before moving on to the BIOS settings is the High Bandwidth Support memory option. I used this in previous guides, and they seem to provide additional performance benefits, but GIGABYTE is pretty tight-lipped on what it does.

Enabling the settings may cause instability, so it’s up to you to see if your memory is stable when enabled. In my case, I enabled the High Bandwidth Support option.
BIOS Settings & Benchmark Results
Upon entering the BIOS
- In Easy Mode
- Set XMP/EXPO Profile to EXPO 1
- Enable XMP/EXPO High Bandwidth Support
- Switch to Advanced Mode and change to the Settings menu
- Enter the AMD Overclocking submenu and click accept
- Enter the Precision Boost Overdrive submenu
- Set Precision Boost Overdrive to Advanced
- Set PBO Limits to Motherboard
- Set GPU Boost Clock Override to Enabled
- Set Max GPU Boost Clock Override to 200 MHz
- Leave the Precision Boost Overdrive submenu
- Enter the SoC/Uncore OC Mode submenu
- Set SoC/Uncore OC Mode to Enabled
- Leave the SoC/Uncore OC Mode submenu
- Enter the SoC Voltage submenu
- Set SoC Voltage to 1300.
- Enter the Precision Boost Overdrive submenu
- Enter the AMD Overclocking submenu and click accept
Then save and exit the BIOS.
We re-ran the benchmarks and checked the performance increase compared to the default operation.
- Geomean: +21.44%
- Geekbench 6 OpenCL: +10.69%
- Geekbench 6 Vulkan: +23.46%
- Furmark 2.1: +27.96%
- AI Benchmark: +19.59%
- 3DMark Night Raid: +18.48%
- 3DMark FSR Feature Test: +17.72%
- Simple RayTracing Benchmark: +23.66%
- Unigine Superposition: +20.98%
- Spaceship: +23.24%
- EZBench: +17.48%
- Shadow of the Tomb Raider: +28.57%
- Returnal: +29.41%
- Final Fantasy XV: +26.69%

With only a slightly higher frequency of 200 MHz, we didn’t expect much of a performance improvement. However, nothing is further from the truth and we get a pretty substantial performance uplift. Compared to the previous OC Strategy, the geomean performance improved by 8 percentage points. We get the highest performance improvement over stock of +29.41% in Returnal.

When running the 3DMark Speedway Stability Test, the average GPU effective clock is 3003 MHz with 1.186 volts. The GPU memory clock is 3200 MHz. The average GPU ASIC Power is 79.2 watts.

When running the OCCT 3D Standard Stress Test, the average GPU effective clock is 3014 MHz with 1.200 volts. The GPU memory clock is 3200 MHz. The average GPU ASIC Power is 121.1 watts.

OC Strategy #3: Manual Tuning
In our third overclocking strategy, we’re pursuing a manual overclock. My goal is to increase the clock frequency of every part that may affect the Radeon 760M performance, including:
- The graphics clock frequency (GFXCLK)
- The infinity fabric clock frequency (FCLK)
- The memory controller clock frequency (UCLK)
- The system memory clock frequency (MCLK)
Before I show you my final overclocking settings, however, I need to cover the basics of the AMD Hawk Point clocking and voltage topology. This will help us better understand how to do our manual overclocking.
AMD Hawk Point Clocking Topology
The clocking of Hawk Point APUs is similar to the other Zen 4 desktop processors.

The standard Hawk Point platform has a 48 MHz crystal input to the integrated CGPLL clock generator. The CGPLL then generates a 48 MHz clock for the USB PLL and a 100 MHz reference clock for the FCH, which contains the CCLK PLL for the CPU cores and several SOC PLLs.
The CCLK PLL 100MHz reference clock drives the 200 MHz VCO, which is then multiplied by an FID and divided by a DID. As a whole, this provides a CPU clock frequency granularity of 25 MHz. As with Raphael, each CCX has its own PLL, with the cores within that CCX running at the same frequency. This isn’t particularly relevant since there’s only one CCX, featuring six Zen 4 cores.
The SOC PLLs include a wide range of PLLs present on the die. The ones most relevant for overclocking are:
- FCLK for the data fabric,
- UCLK for the memory controller,
- MCLK for the system memory,
- GFXCLK for the integrated graphics,
- IPUCLK for the inference processor.
FCLK is the term used for the infinity fabric clock frequency. The default FCLK frequency is 1600 MHz, but I was able to push it to 2467 MHz.
UCLK is the term used for the unified memory controller clock frequency. It runs by default at the same frequency as the system memory. However, motherboard auto-rules may drop to half the frequency if the system memory frequency is too high. It is relatively inflexible as it can run at the same or half the system memory frequency. I could run the UCLK in sync with the system memory up to DDR5-6400 on my particular system.
MCLK is the term used for the system memory clock frequency. It is, by default, either the same or double the memory controller frequency. AMD recently improved its memory overclocking capabilities, and Hawk Point APUs can run well over DDR5-8000.
GFXCLK is the term used for the integrated graphics core clock frequency. It will go up to 2.8 GHz during a 3D load at stock. The Precision Boost algorithm manages the graphics clock, even when you set a manual target frequency.
IPUCLK is the term used for the inference processing unit clock frequency. It should be able to go up to 1.6 GHz and it can currently not be overclocked.
AMD Hawk Point Voltage Topology
AMD Hawk Point’s voltage topology is similar to that of previous Ryzen processors but with one significant change. In fact, I got this one wrong in my 8700G CPU core overclocking guide!
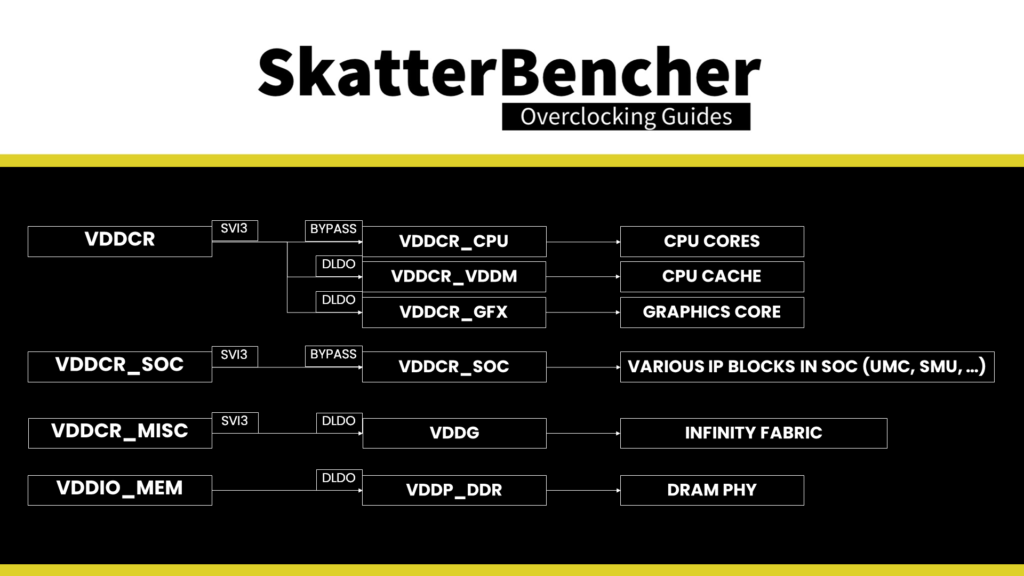
As usual, the processor relies on an internal and external power supply to generate the processor voltages. There are four primary power supplies from the motherboard VRM to the processor: VDDCR, VDDCR_SOC, VDDCR_MISC, and VDDIO_MEM.
The VDDCR voltage rail provides the external power for three internal voltage regulators: VDDCR_CPU, VDDCR_VDDM, and the VDDCR_GFX.
- VDDCR_CPU provides the voltage for the CPU cores within the CCX. The voltage rail can work in either regular or bypass mode, but it is always in bypass mode on Hawk Point. That means the voltage of the cores is always equal to the VDDCR external voltage. The end user can change the voltage in the BIOS.
- VDDCR_VDDM provides the voltage for the L2, L3, and, if present, 3D V-Cache on a CCX. This rail cannot work in bypass mode; therefore, it is always internally regulated from the VDDCR external voltage rail. We can also not adjust this voltage.
- VDDCR_GFX provides the voltage for the integrated graphics. In the past, this voltage would be provided by the VDDCR_SOC voltage rail. Still, it’s likely due to the high current requirements of the powerful integrated graphics, using the typically beefier VDDCR voltage plane is safer. The voltage rail can technically work in regular or bypass mode, but only regular mode is available. In regular mode, the voltage is managed by the integrated voltage regulator and derived from the VDDCR voltage rail. This voltage is limited to 1.25V under ambient conditions and requires LN2 mode for a higher range.
The VDDCR_SOC voltage rail provides the external power for multiple internal voltage regulators on SOC for the various IP blocks, including but not limited to the memory controller, SMU, PSP, etc. It is essential to know that the VDDCR_SOC voltage must always be lower than VDDIO_MEM_S3 + 100mV. The default VDDCR_SOC voltage is 1.05V and can be set to 1.30V under ambient conditions. Again, we need LN2 mode enabled for higher voltages.
The VDDCR_MISC voltage rail provides the external power for the internally regulated VDDG voltage rail. VDDG is the voltage supply for the infinity fabric data path. Previously, you could manually tune the voltages for each infinity fabric connection. However, this doesn’t seem to be available for Hawk Point.
The VDDIO_MEM voltage rail provides the external power for the VDDP_DDR internal voltage regulator. VDDP is the voltage for the DDR bus signaling or DRAM PHY. So it can help achieve higher memory frequencies. As a rule, the external VDDIO_MEM should always be higher than the internal VDDP_DDR + 100mV. Furthermore, the external VDDCR_SOC voltage rail should be lower than the external VDDIO_MEM + 100mV. When memory overclocking, you may need to manually increase the VDDP voltage as it does not automatically adjust when changing the VDDIO_MEM voltage.
AMD Radeon 760M Manual Overclocking
Manual overclocking of the Radeon 760M is pretty straightforward, as it’s a process of trial and error. For example, for the FCLK, I tried increasing the frequency to 2500 MHz, but the system wasn’t quite stable. So, I stuck with 2467 MHz instead.
Overclocking the memory and memory controller are tied together. In my case, I could run them in sync up to DDR5-6400. For higher memory frequencies, I had to reduce the UCLK to half the speed of the MCLK. So, for this overclock I stuck with DDR5-6400.
The graphics overclocking process was a mixed bag. On the one hand, the Radeon 760M should have more overclocking potential than the Radeon 780M because:
- We start from a lower rated frequency even though the architecture and manufacturing process are the same, and
- The lower number of compute units gives us a better operating temperature even in extreme workloads like OCCT. So, there should be plenty of thermal headroom.
The overclocking results were not just similar to the Radeon 780M, they were identical: 3150 MHz in our worst-case stress test! I could further increase the frequency to 3250 MHz in lighter workloads like 3DMark Speedway.

BIOS Settings & Benchmark Results
Upon entering the BIOS
- In Easy Mode
- Set XMP/EXPO Profile to EXPO 1
- Enable XMP/EXPO High Bandwidth Support
- Switch to Advanced Mode and go to the settings menu
- Enter the AMD Overclocking submenu and click accept
- Enter the Manual iGPU Overclocking submenu
- Set GFX Clock Frequency to 3150
- Set GFX Voltage to 1250
- Leave the Manual iGPU Overclocking submenu
- Enter the DDR and Infinity Fabric Frequency/Timings submenu
- Enter the Infinity Fabric Frequency and Dividers submenu
- Set Infinity Fabric Frequency and Dividers to 2467 MHz
- Set UCLK DIV1 Mode to UCLK=MEMCLK
- Leave the Infinity Fabric Frequency and Dividers submenu
- Enter the Infinity Fabric Frequency and Dividers submenu
- Leave the DDR and Infinity Fabric Frequency/Timings submenu
- Enter the Precision Boost Overdrive submenu
- Set Precision Boost Overdrive to Advanced
- Set PBO Limits to Motherboard
- Leave the Precision Boost Overdrive submenu
- Enter the SoC/Uncore OC Mode submenu
- Set SoC/Uncore OC Mode to Enabled
- Leave the SoC/Uncore OC Mode submenu
- Enter the SoC Voltage submenu
- Set SoC Voltage to 1300.
- Enter the Manual iGPU Overclocking submenu
- Enter the AMD Overclocking submenu and click accept
Then save and exit the BIOS.
We re-ran the benchmarks and checked the performance increase compared to the default operation.
- Geomean: +26.03%
- Geekbench 6 OpenCL: +18.51%
- Geekbench 6 Vulkan: +25.76%
- Furmark 2.1: +28.56%
- AI Benchmark: +32.60%
- 3DMark Night Raid: +18.65%
- 3DMark FSR Feature Test: +21.92%
- Simple RayTracing Benchmark: +26.78%
- Unigine Superposition: +24.14%
- Spaceship: +26.01%
- EZBench: +24.01%
- Shadow of the Tomb Raider: +34.29%
- Returnal: +35.29%
- Final Fantasy XV: +28.36%

Despite the tiny improvement in GPU core frequency, we still get a little bit of a performance boost thanks to the improvements in memory subsystem performance. Compared to the previous OC Strategy, the geomean performance improved by 4.5 percentage points. We get the highest performance improvement over stock of +35.29% in Returnal.

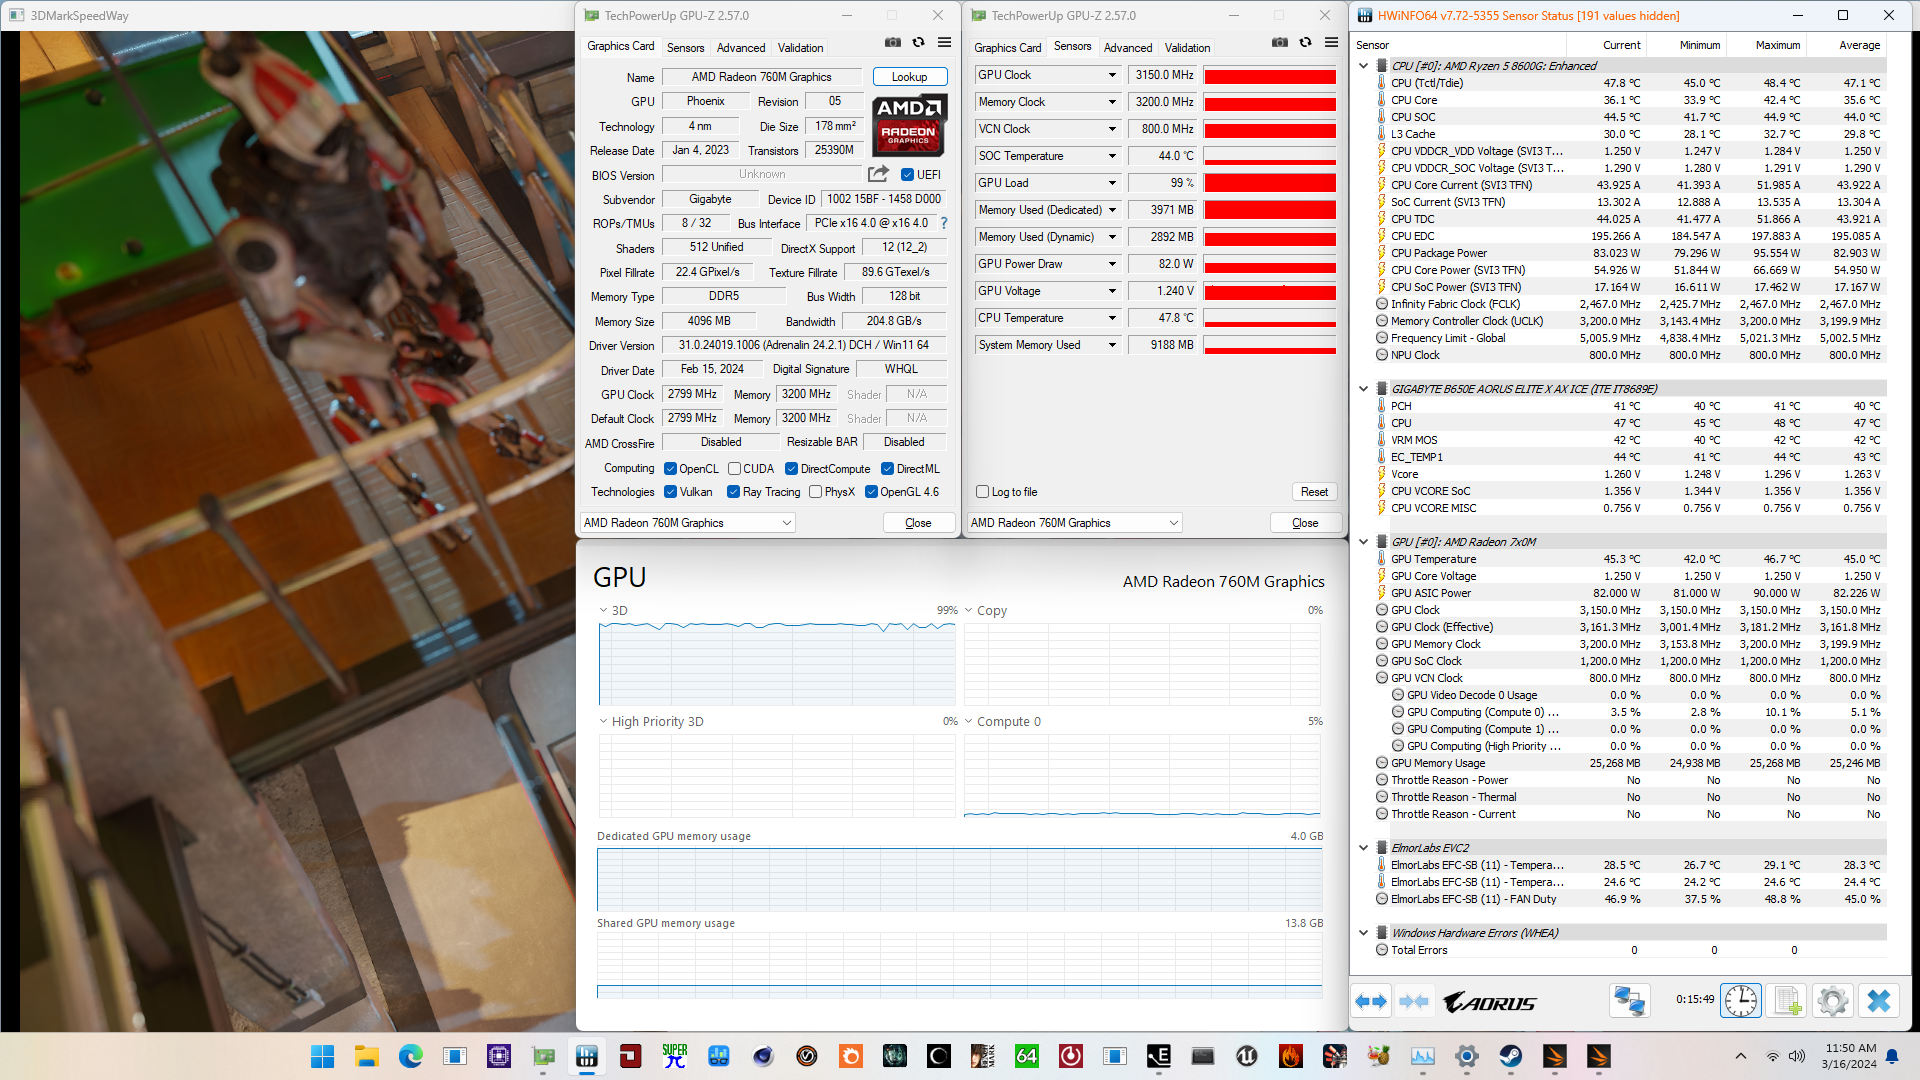
When running the 3DMark Speedway Stability Test, the average GPU effective clock is 3162 MHz with 1.250 volts. The GPU memory clock is 3200 MHz. The average GPU ASIC Power is 82.2 watts.
When running the OCCT 3D Standard Stress Test, the average GPU effective clock is 3163 MHz with 1.200 volts. The GPU memory clock is 3200 MHz. The average GPU ASIC Power is 124.2 watts.

OC Strategy #4: Memory Tuning & CPU Overclocking
In the fourth overclocking strategy, we try to further optimize the performance by overclocking the CPU cores and tuning the memory timings.
APU Core Overclocking
I rely on the Ryzen 5 8600G APU core overclocking information from SkatterBencher #72 in our fourth overclocking strategy. We apply the settings from OC Strategy #2, which leverages the Precision Boost Overdrive 2 toolkit knobs such as Fmax override and Curve Optimizer.
I won’t spend any time explaining these settings as you can easily refer to my SkatterBencher guide for all information related to CPU core overclocking of the Ryzen 5 8600G.
Memory Timings Tuning
I wanted to include memory tuning as part of this overclocking guide following the incredible performance improvements I got when optimizing the memory timings with the Radeon 780M in SkatterBencher #70. There were three things I wanted to figure out:
- Double-check if optimizing the memory timings indeed has such a huge impact on performance (or if my previous results were a fluke),
- Try to optimize the timings of my DDR5-6400 EXPO kit and see the performance improvement
- Find a more stable configuration for the fast DDR5-7800 XMP kit so I don’t have the weird green flashes during 3D loads.
In this OC Strategy, I’m focusing on the EXPO kit while the XMP kit will be used in the next OC Strategy.
Now, as you may know, I’m far from a memory overclocking expert. I’m what Buildzoid would call a “normie” when it comes to understanding memory performance tuning. Buildzoid, on the other hand, is a legend when it comes to memory performance tuning. The great thing about Buildzoid is that he freely shares his knowledge on his YouTube channel “Actually Hardcore Overclocking,” where you can learn how to overclock all kinds of memory on a wide variety of platforms.
What’s even better is that he shared a document titled “Low effort Single rank Hynix 16Gb A/M-die timings for Ryzen 7000” and that’s my starting point for memory timing tuning. For the most part, these optimized memory timings work fine. It passes the OCCT Memory stress test workload without issues. Except, I still get green flashes during a 3D workload! To make a long journey of testing every memory timing to find the culprit short: turns out the tRAS timing has to be relaxed to avoid the green flashes. When I change the tRAS from 30 to 34, the green flashes no longer appear.
Memory Kit
SKU		G.SKILL F5-6400J3239G16GA2-TZ5RK
DRAM IC		Hynix
PMIC 		Richtek

Frequency
MCLK		3200 (DDR5-6400)
UCLK		3200

Voltage
APU VDDIO	1.40
APU VSOC	1.30
DIMM VDD	1.40
DIMM VDDQ	1.40
DIMM VPP	1.80

Primary Timings
tCL		32 (EXPO)
tRCD 		39 (EXPO)
tRP 		39 (EXPO)
tRAS		34

Secondary Timings
tRC 		68
tWR		48
tREFI 		50000
tRFC1 		500
tRFC2 		400
tRFCSb 		300
tRTP 		12
tRRD_L 		8
tRRD_S 		4
tFAW 		20
tWTR_L 		16
tWTR_S 		6
tRDRDSCL	4
tRDRDSC 	1
tRDRDSD 	1
tRDRDDD		1
tWRWRSCL	4
tWRWRSCL	1
tWRWRSD		1
tWRWRDD		1
tWRRD 		2
tRDWR		16
On a side note, these green flashes are a strange phenomenon and I don’t know why relaxing that particular memory timing fixes the issue. And things get even stranger. If I further relax the memory subsystem by halving the memory controller frequency (UCLK=MEMCLK/2), therefore presumably improving the memory subsystem stability, the green flashing gets worse, not better.
That’s something I’ll leave for the next SkatterBencher guide to explore. For now, let’s jump into the BIOS configuration.
BIOS Settings & Benchmark Results
Upon entering the BIOS
- In Easy Mode
- Set XMP/EXPO Profile to EXPO 1
- Enable XMP/EXPO High Bandwidth Support
- Switch to Advanced Mode
- Stay in the Tweaker menu
- Enter the Advanced Memory Settings submenu
- Enter the Memory Subtimings submenu
- For the Standard Timing Control timings
- Set CAS Latency, tRCD, and tRP according to the EXPO specification
- Set tRAS to 34
- For the Advanced Timing Control timings
- Set Buildzoid’s Easy Hynix Memory Timings for Ryzen 7000
- For the Standard Timing Control timings
- Leave the Memory Subtimings submenu
- Enter the Memory Subtimings submenu
- Leave the Advanced Memory Settings submenu
- Enter the Advanced Memory Settings submenu
- Enter the Advanced CPU Settings submenu and change to the Settings menu
- Enter the AMD Overclocking submenu and click accept
- Enter the Manual iGPU Overclocking submenu
- Set GFX Clock Frequency to 3150
- Set GFX Voltage to 1250
- Leave the Manual iGPU Overclocking submenu
- Enter the DDR and Infinity Fabric Frequency/Timings submenu
- Enter the Infinity Fabric Frequency and Dividers submenu
- Set Infinity Fabric Frequency and Dividers to 2467 MHz
- Set UCLK DIV1 Mode to UCLK=MEMCLK
- Leave the Infinity Fabric Frequency and Dividers submenu
- Enter the Infinity Fabric Frequency and Dividers submenu
- Leave the DDR and Infinity Fabric Frequency/Timings submenu
- Enter the Precision Boost Overdrive submenu
- Set Precision Boost Overdrive to Advanced
- Set PBO Limits to Motherboard
- Leave the Precision Boost Overdrive submenu
- Enter the SoC/Uncore OC Mode submenu
- Set SoC/Uncore OC Mode to Enabled
- Leave the SoC/Uncore OC Mode submenu
- Enter the SoC Voltage submenu
- Set SoC Voltage to 1300.
- Enter the Manual iGPU Overclocking submenu
- Enter the AMD Overclocking submenu and click accept
Then save and exit the BIOS.
We re-ran the benchmarks and checked the performance increase compared to the default operation.
- Geomean: +29.92%
- Geekbench 6 OpenCL: +21.14%
- Geekbench 6 Vulkan: +28.98%
- Furmark 2.1: +39.46%
- AI Benchmark: +32.72%
- 3DMark Night Raid: +23.52%
- 3DMark FSR Feature Test: +21.92%
- Simple RayTracing Benchmark: +34.18%
- Unigine Superposition: +28.72%
- Spaceship: +31.34%
- EZBench: +25.17%
- Shadow of the Tomb Raider: +37.14%
- Returnal: +41.18%
- Final Fantasy XV: +31.92%

We can largely ignore the benefit of CPU overclocking as, just like with the Radeon 780M, it has minimal impact on the performance. However, tuning the memory timings is pretty impactful. It provides us with a 4 percentage point geomean performance improvement over the previous overclocking strategy. That’s a similar improvement than we got from optimizing the operating frequencies of the graphics, fabric, and memory subsystem! We get the highest performance improvement over stock of +41.18% in Returnal.

When running the 3DMark Speedway Stability Test, the average GPU effective clock is 3155 MHz with 1.250 volts. The GPU memory clock is 3200 MHz. The average GPU ASIC Power is 79.4 watts.

When running the OCCT 3D Standard Stress Test, the average GPU effective clock is 3150 MHz with 1.250 volts. The GPU memory clock is 3200 MHz. The average GPU ASIC Power is 125.4 watts.

OC Strategy #5: High-Performance Memory
In our fifth overclocking strategy, I try to achieve the same performance uplift thanks to memory optimization as I saw with the Radeon 780M. So, just like in SkatterBencher #70, I swap out my EXPO-6400 kit for an XMP-7800 kit.
Rather than, once again, showing a configuration that suffers from those green flashes, for this guide I wanted to find out what’s the root cause of the instability and resolve it. So, at the very least, I could pass the stress tests and consider it a stable overclock.
Easier said than done, however. Let me explain.
Memory Tuning
As a tuning starting point, I took the optimized memory timings from SkatterBencher #70, OC Strategy #5. Everything applied without issue though upon boot I had the green flashes. But that’s not a big surprise.
Then, I took what I learned from OC Strategy #4: increase tRAS to get rid of the green flashes. In addition, I also adjusted the primary memory timings tCL, tRCD, and tRP according to the XMP kit specification. That worked just fine to eliminate the green flashes, so it’s good enough for this OC strategy.
Memory Kit
SKU		G.SKILL F5-7800J3646H16GX2-TZ5RK
DRAM IC		Hynix
PMIC 		Richtek

Frequency
MCLK		3900 (DDR5-7800)
UCLK		1950

Voltage
APU VDDIO	1.40
APU VSOC	1.30
DIMM VDD	1.50
DIMM VDDQ	1.50
DIMM VPP	1.80

Primary Timings
tCL		36 (XMP)
tRCD 		46 (XMP)
tRP 		46 (XMP)
tRAS		46

Secondary Timings
tRC 		44
tWR		48
tREFI 		65535
tRFC1 		460
tRFC2 		460
tRFCSb 		440
tRTP 		16
tRRD_L 		8
tRRD_S 		6
tFAW 		20
tWTR_L 		16
tWTR_S 		4
tRDRDSCL	8
tRDRDSC 	1
tRDRDSD 	1
tRDRDDD		1
tWRWRSCL	8
tWRWRSCL	1
tWRWRSD		1
tWRWRDD		1
tWRRD 		4
tRDWR		16
Do note that this didn’t pass my memory stability test, but I ran out of time to figure out more stable settings.

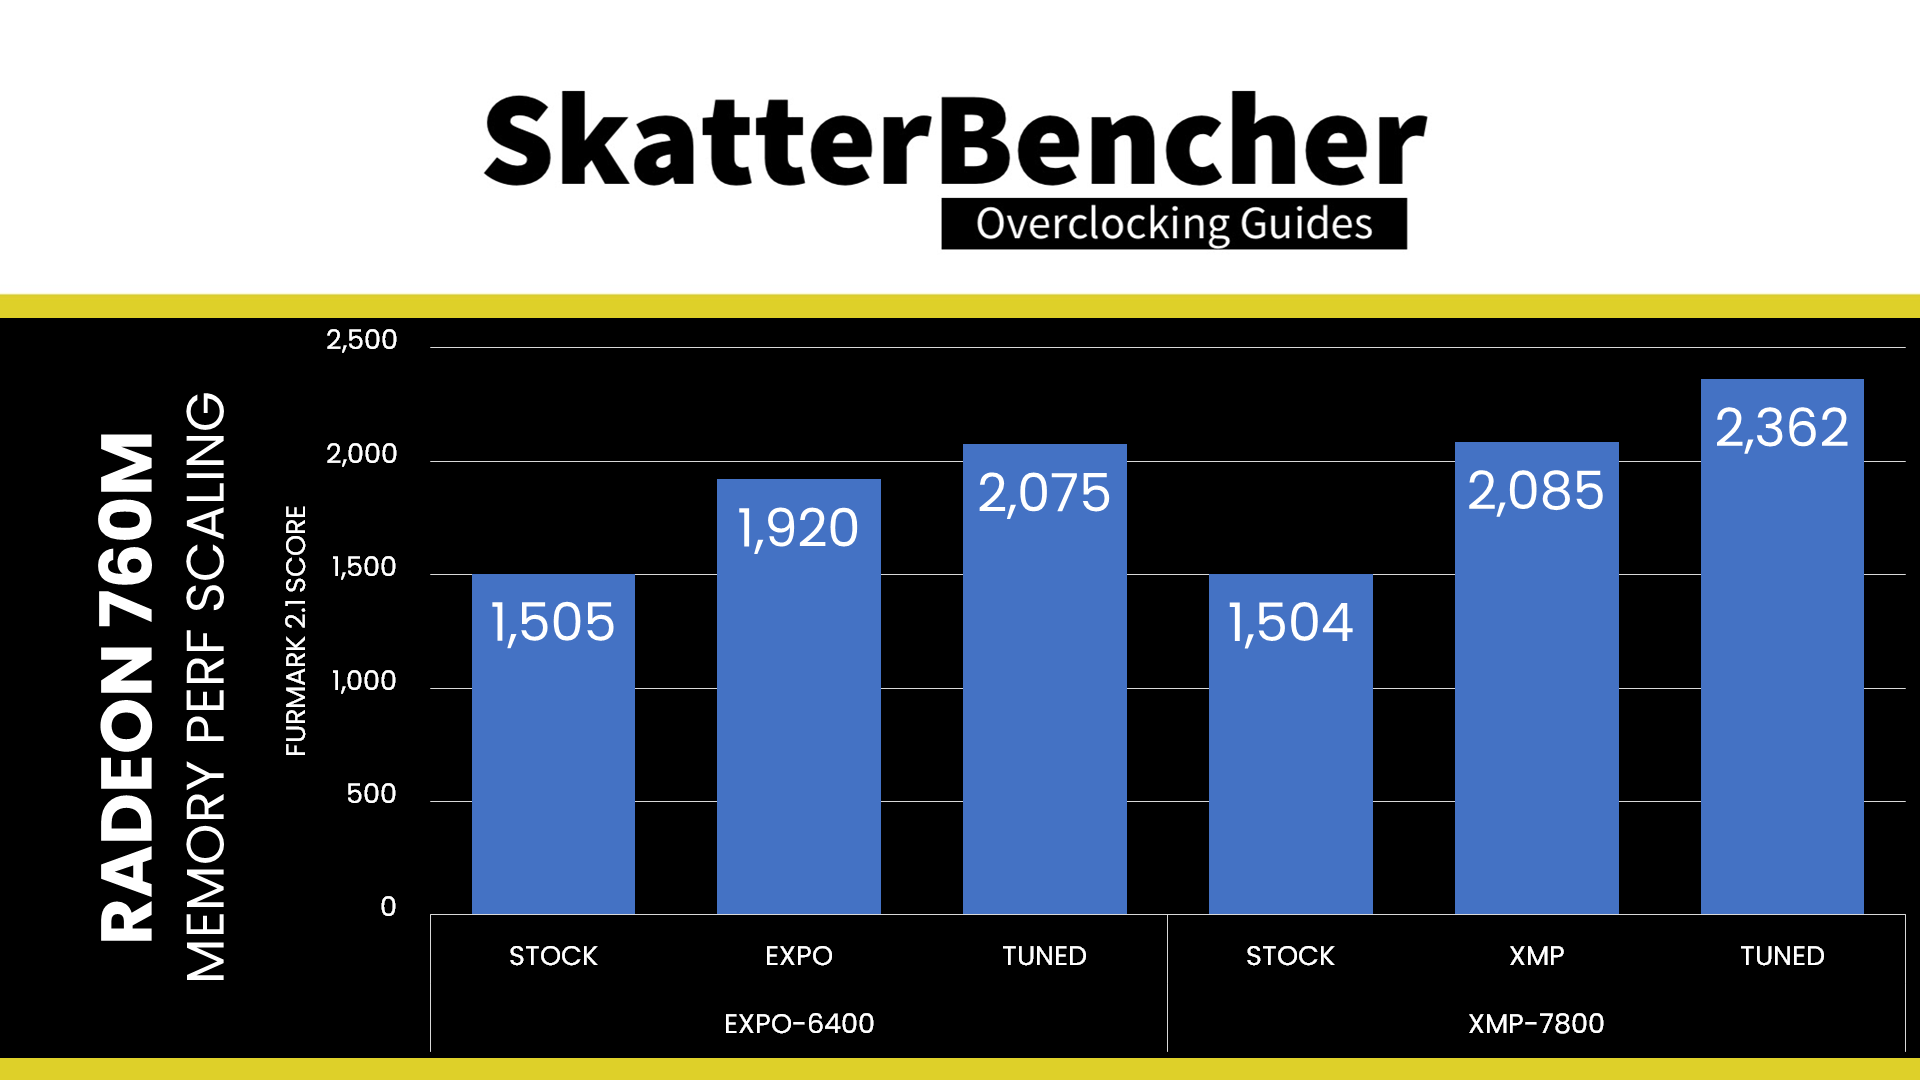
I did have a closer look at memory performance scaling. In my previous Hawk Point integrated graphics guide, I specifically mentioned the memory timings being the crucial factor in unlocking the integrated graphics performance.
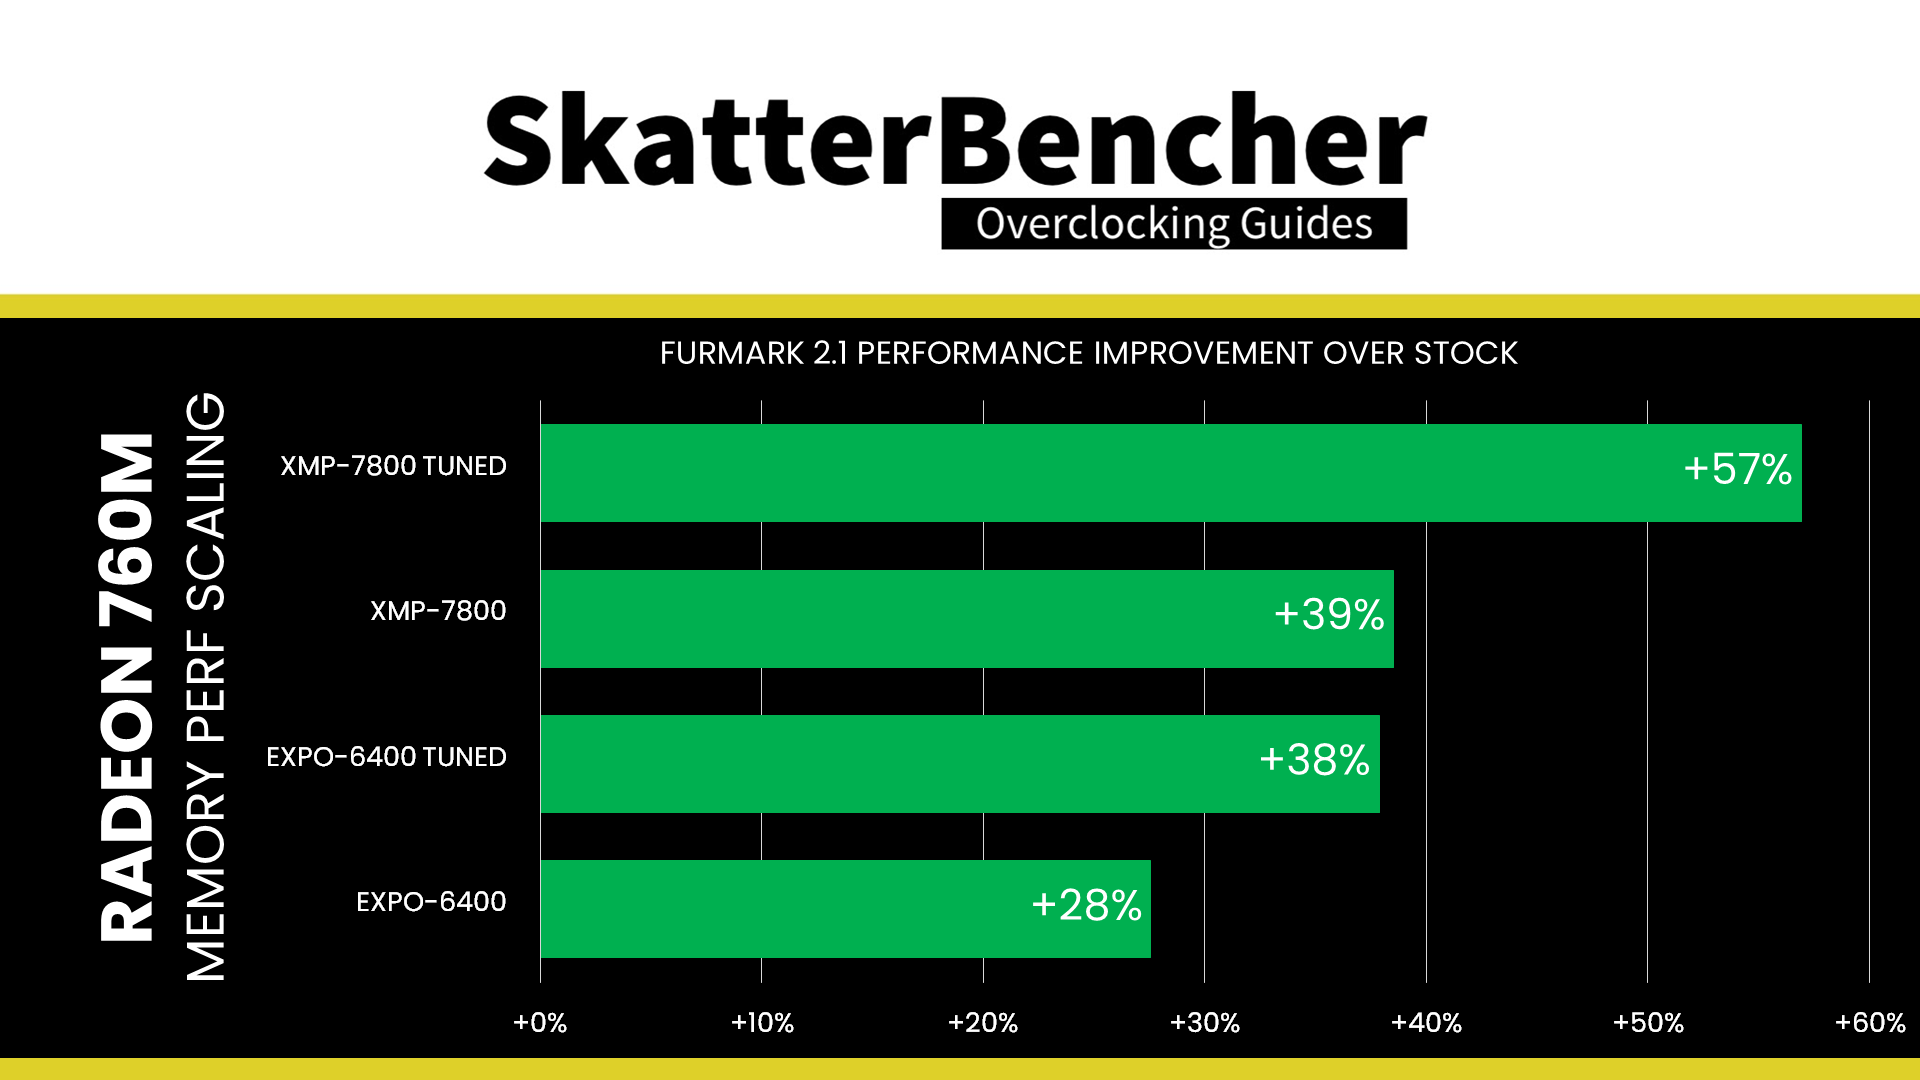
Based on further testing data, you can see why: we can match the 3D performance of an untuned XMP-7800 kit with a well-tuned EXPO-6400 kit. Furthermore, it is more clear now what’s driving the performance gains as the memory copy bandwidth correlates strongest with 3D performance. A well-tuned high-frequency kit will continue to deliver higher performance. The bandwidth numbers of our tuned XMP-7800 memory kit are pretty great.
Anyway, now that we know how to tune our XMP memory kit, let’s jump into the BIOS.
BIOS Settings & Benchmark Results
Upon entering the BIOS
- In Easy Mode
- Set XMP/EXPO Profile to XMP 1
- Enable XMP/EXPO High Bandwidth Support
- Switch to Advanced Mode
- Stay in the Tweaker menu
- Enter the Advanced Memory Settings submenu
- Enter the Memory Subtimings submenu
- For the Standard Timing Control timings
- Set CAS Latency, tRCD, and tRP according to the XMP specification
- Set tRAS to 46
- For the Advanced Timing Control timings
- Set the optimized memory timings from SkatterBencher #70, OC Strategy #5
- For the Standard Timing Control timings
- Leave the Memory Subtimings submenu
- Enter the Memory Subtimings submenu
- Leave the Advanced Memory Settings submenu
- Enter the Advanced Memory Settings submenu
- Enter the Advanced CPU Settings submenu and change to the Settings menu
- Enter the AMD Overclocking submenu and click accept
- Enter the Manual iGPU Overclocking submenu
- Set GFX Clock Frequency to 3150
- Set GFX Voltage to 1250
- Leave the Manual iGPU Overclocking submenu
- Enter the DDR and Infinity Fabric Frequency/Timings submenu
- Enter the Infinity Fabric Frequency and Dividers submenu
- Set Infinity Fabric Frequency and Dividers to 2467 MHz
- Set UCLK DIV1 Mode to UCLK=MEMCLK/2
- Leave the Infinity Fabric Frequency and Dividers submenu
- Enter the Infinity Fabric Frequency and Dividers submenu
- Leave the DDR and Infinity Fabric Frequency/Timings submenu
- Enter the Precision Boost Overdrive submenu
- Set Precision Boost Overdrive to Advanced
- Set PBO Limits to Motherboard
- Leave the Precision Boost Overdrive submenu
- Enter the SoC/Uncore OC Mode submenu
- Set SoC/Uncore OC Mode to Enabled
- Leave the SoC/Uncore OC Mode submenu
- Enter the SoC Voltage submenu
- Set SoC Voltage to 1300.
- Enter the Manual iGPU Overclocking submenu
- Enter the AMD Overclocking submenu and click accept
Then save and exit the BIOS.
We re-ran the benchmarks and checked the performance increase compared to the default operation.
- Geomean: +40.50%
- Geekbench 6 OpenCL: +25.26%
- Geekbench 6 Vulkan: +38.26%
- Furmark 1080P: +58.66%
- AI Benchmark: +43.04%
- 3DMark Night Raid: +32.43%
- 3DMark FSR Feature Test: +30.23%
- Simple RayTracing Benchmark: +40.90%
- Unigine Superposition: +38.91%
- Spaceship: +42.43%
- EZBench: +32.40%
- Shadow of the Tomb Raider: +57.14%
- Returnal: +52.94%
- Final Fantasy XV: +49.80%

The performance improvement from switching to a higher-performance memory kit is once again very impressive. Compared to the previous OC Strategy, the geomean performance improved by 10 percentage points. That’s a bigger performance improvement than going from a PBO Optimized to a fully manually tuned configuration. We get the highest performance improvement over stock of +58.66% in Furmark 1080P.

When running the 3DMark Speedway Stability Test, the average GPU effective clock is 3158 MHz with 1.250 volts. The GPU memory clock is 3900 MHz. The average GPU ASIC Power is 92.45 watts.

When running the OCCT 3D Standard Stress Test, the average GPU effective clock is 3155 MHz with 1.250 volts. The GPU memory clock is 3900 MHz. The average GPU ASIC Power is 126.4 watts.

AMD Radeon 760M: Conclusion
Alright, let us wrap this up.
My first experience overclocking the Hawk Point integrated graphics a couple of weeks ago was pretty exciting. With the memory performance impacting the graphics performance in such as big way, it makes it interesting for memory tuners to squeeze more performance out of the chip.
Pretty much everything I learned from overclocking the Radeon 780M also applies to the Radeon 760M. That includes unleashing the power limits and tuning the memory performance has a huge impact on performance. But that also includes the somewhat limited overclocking range of the graphics core.
There are still some questions left unanswered about Hawk Point, however. For one, I need to study the memory tuning in more detail to better understand the instability issues and green flashes. And, of course, I do want to get around testing the IPU at some point.
Anyway, that’s all for today!
I absolutely love the Hawk Point overclocking challenge so far. Hence, my next target will be to overclock one of the Phoenix2 dies with Zen 4c cores. So stay tuned if you are interested in that.
I want to thank my Patreon supporters for supporting my work. If you have any questions or comments, please drop them in the comment section below.
See you next time!
Nasos
Hi,did you found more stable settings for 7800MT? I fined tune my 6400MT profile but i cant get 7800MT stable…Afaik im not the most knowledgeable in memory oc..
Pieter
I didn’t look further into getting this 7800 kit stable for AMD. Note that the 7800MT is achieved with a different kit than the 6400MT.
5 Minute Overclock: AMD Radeon 760M to 3150 MHz - 5 Minute Overclock
[…] I’ll speedrun you through the BIOS settings and provide some notes and tips along the way. Please note that this is for entertainment purposes only and not the whole picture. Please don’t outright copy these settings and apply them to your system. If you want to learn how to overclock this system, please check out the longer SkatterBencher article. […]