Undervolt Ryzen 9000
Curve Optimizer and Curve Shaper are not the only ways to undervolt your Ryzen CPU. You can also undervolt by lowering the operating temperature. Let me explain!
In this video, I cover three topics related to undervolting Ryzen CPUs:
- How the Voltage-Frequency-Temperature curve enables undervolting through lower temperatures.
- How Curve Optimizer works in different operating temperature scenarios.
- How the Curve Shaper Temperature Points provide us more precise control over our CPU undervolt.
We’ve got lots to cover, so let’s get started.
Table of Contents
The Voltage-Frequency-Temperature Curve
For those who didn’t watch my first content piece on the Curve Shaper topic, let’s get the basics down. What is a VFT curve?
Simply put: a voltage-frequency-temperature curve describes the relationship between an operating frequency, the operating temperature, and the voltage required to operate at that frequency and temperature.
While every modern SoC has a factory-fused voltage-frequency curve to dynamically adjust the power consumption depending on the workload needs, not all SoCs have a temperature aspect.
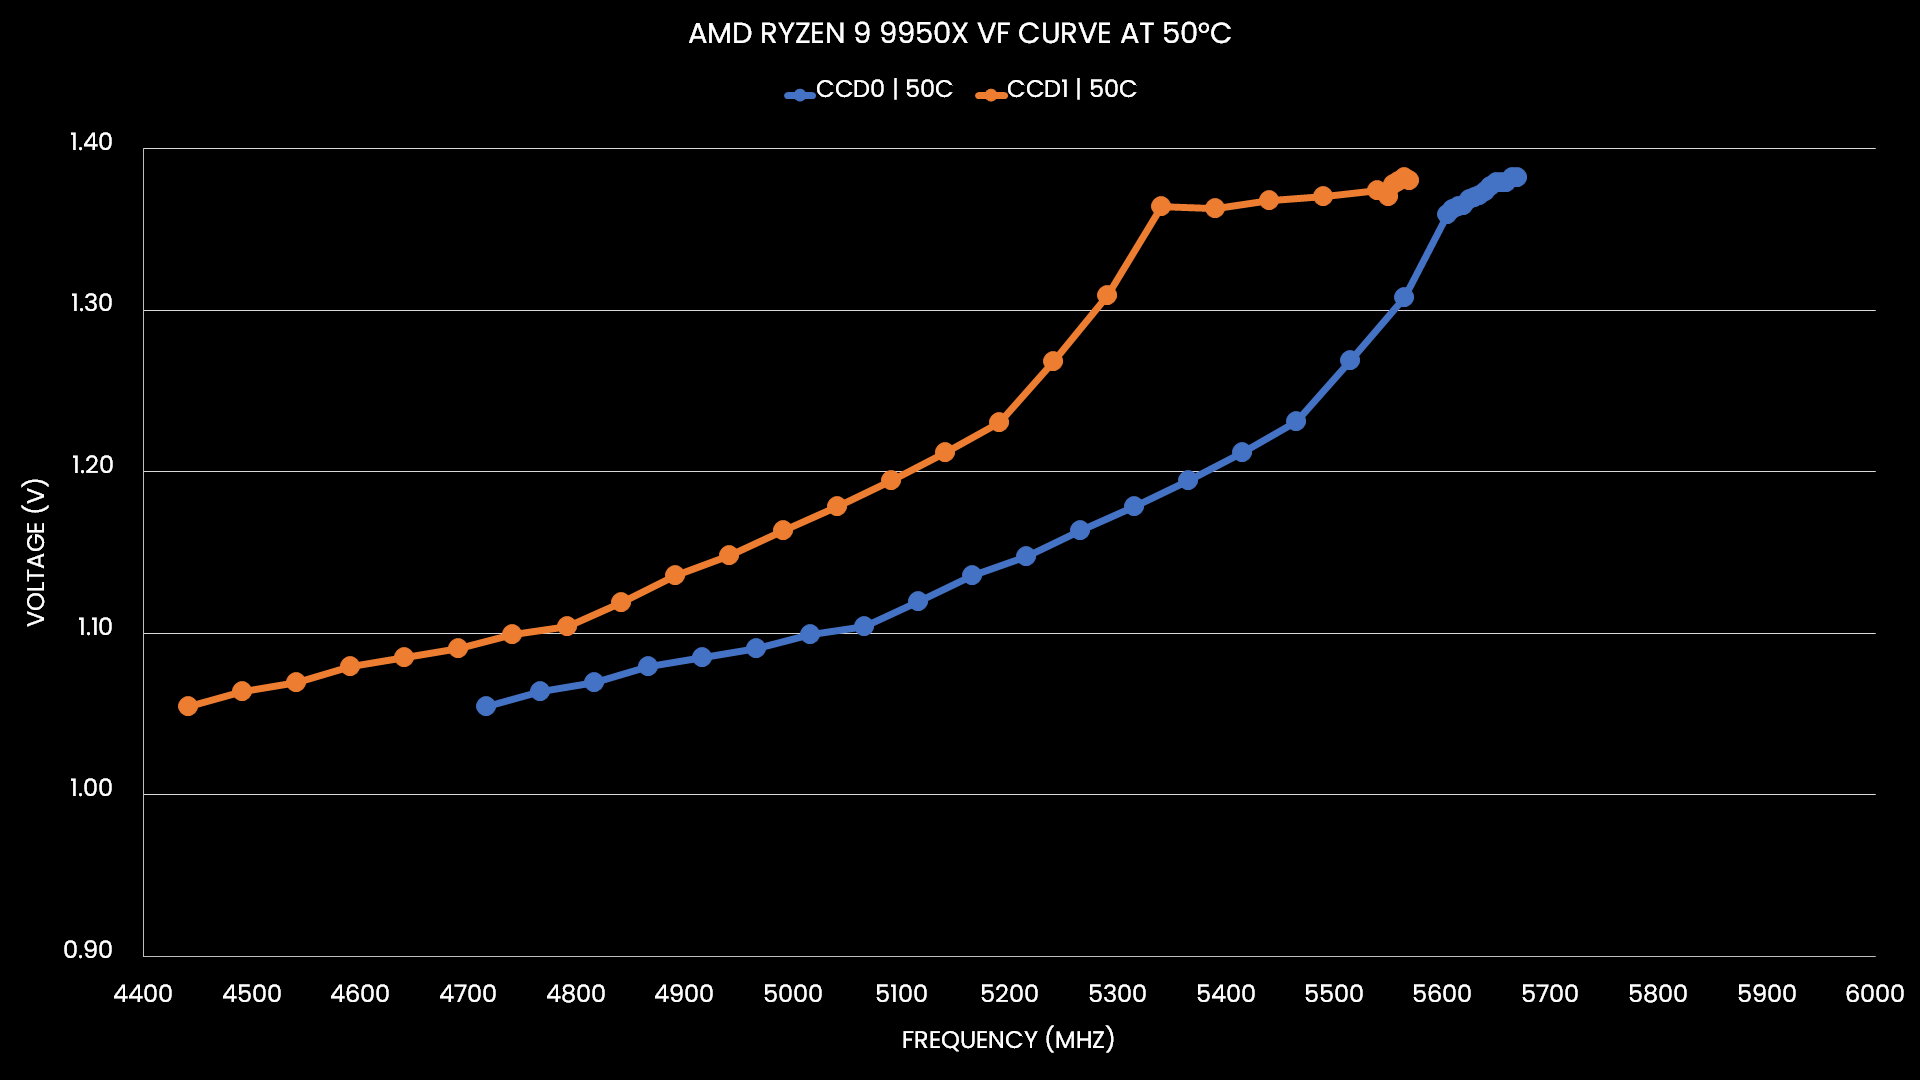
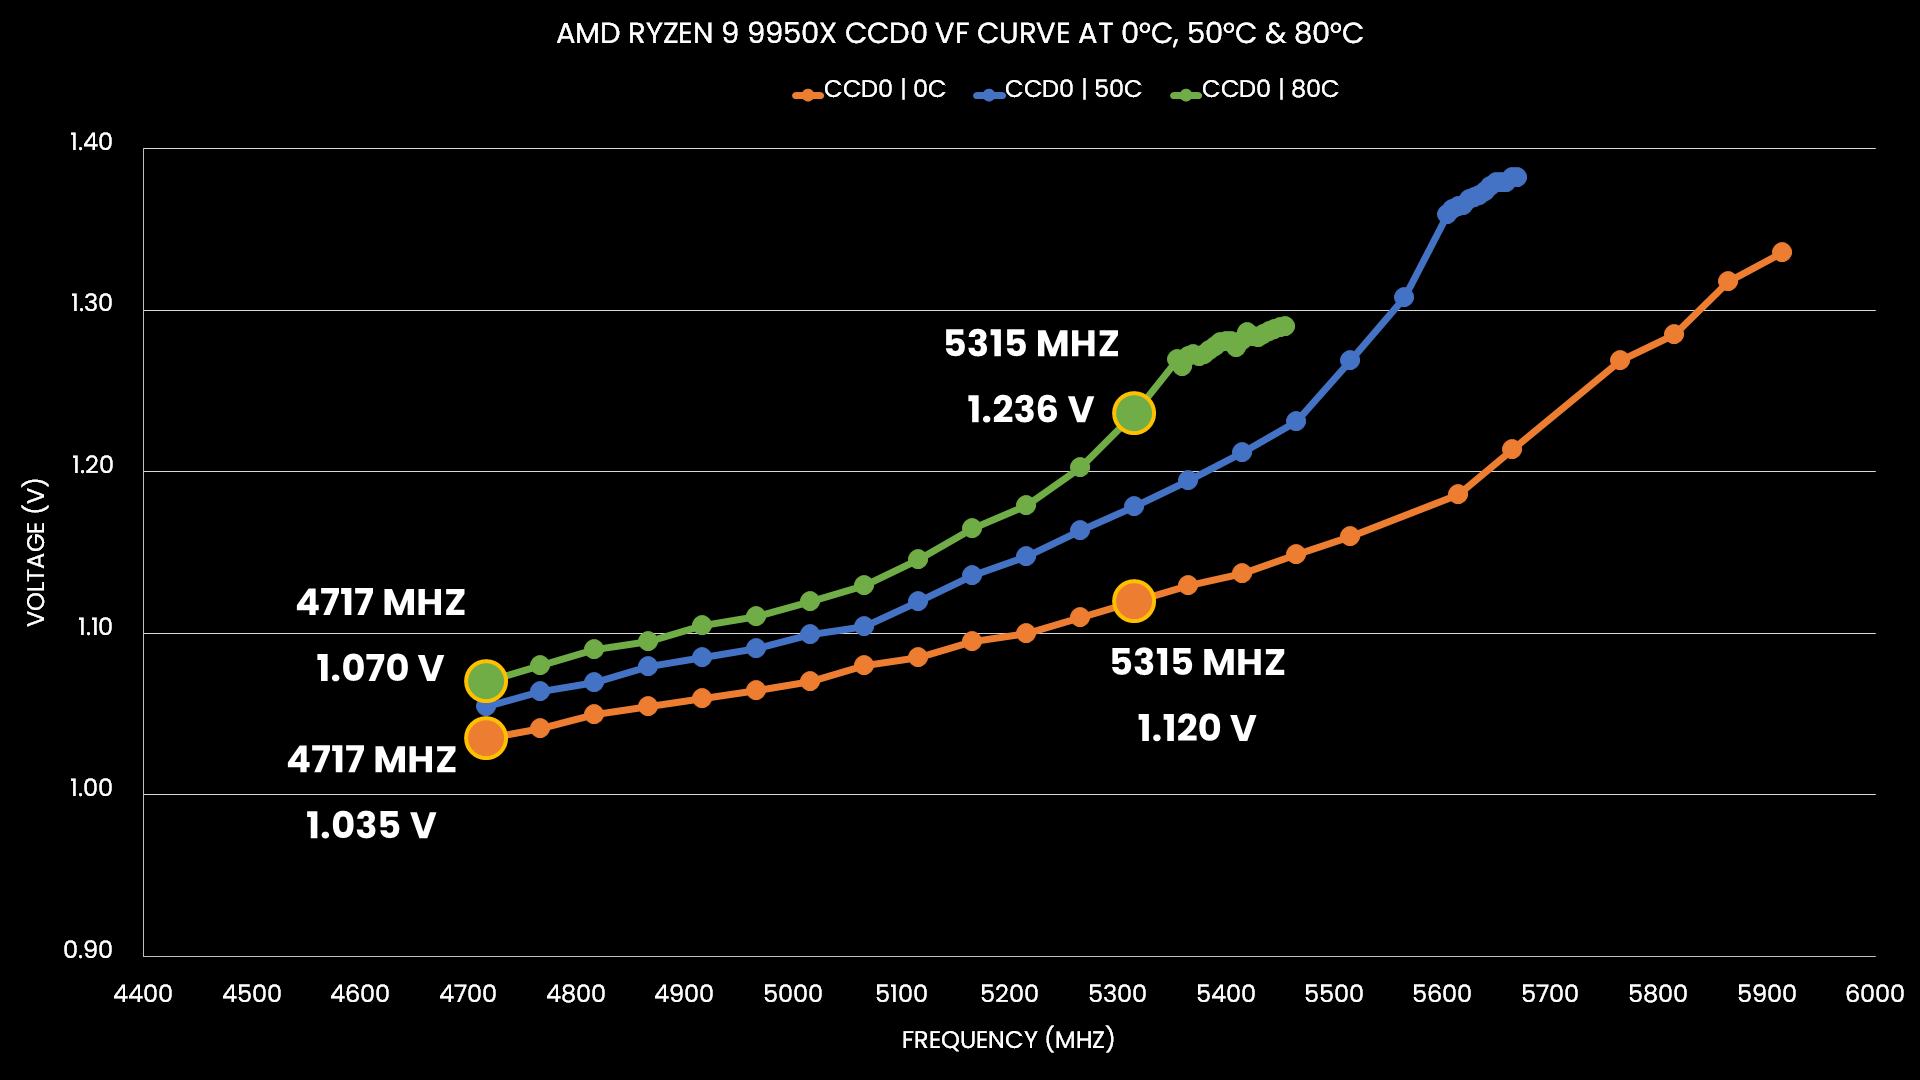
It’s not easy to visualize a VFT curve because of its 3 dimensions: voltage, frequency, and temperature. So, instead, let’s first look at the V/F curve at a fixed temperature and then see how changing the temperature affects the curve. Here’s the default voltage-frequency curve of a Ryzen 9 9950X processor at an operating temperature of 50 degrees Celsius. Since the processor has two CCDs of quite different quality, we have two distinct curves.
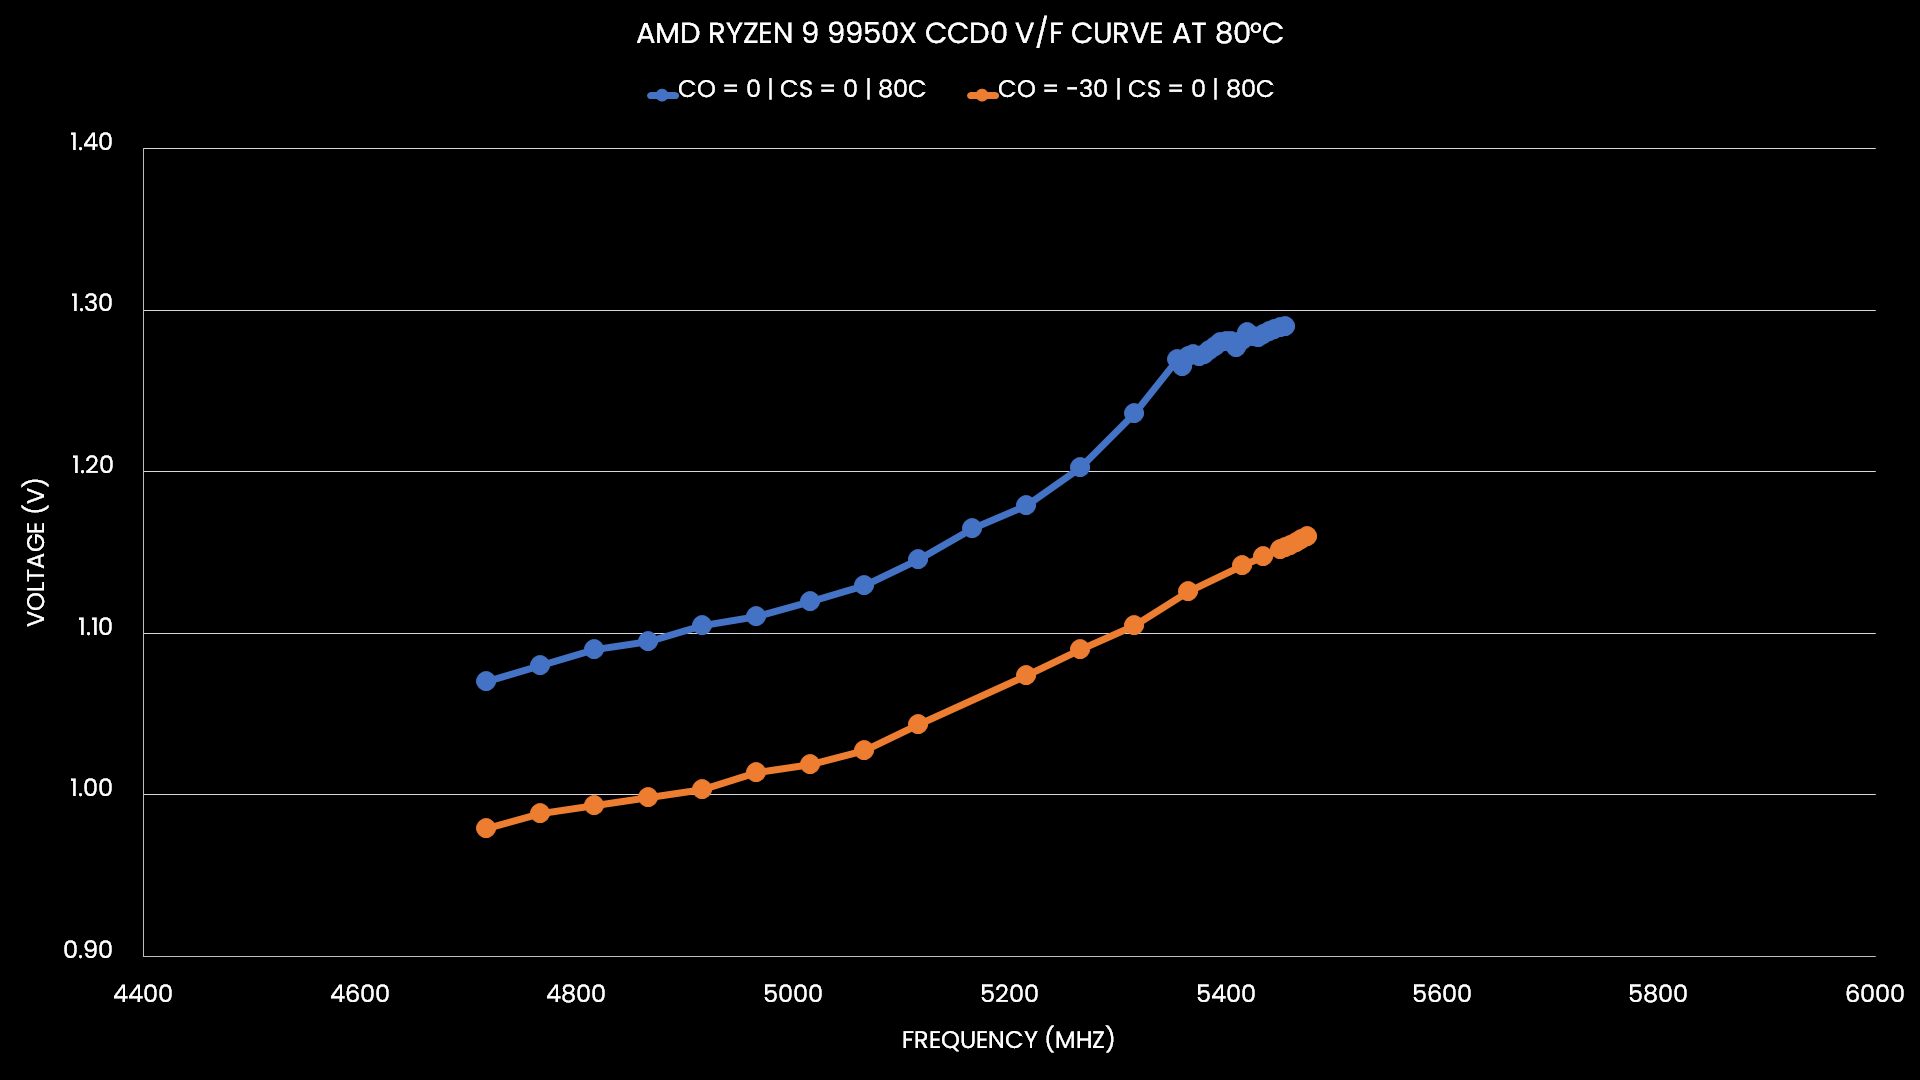
For simplicity purposes, let’s focus on the CCD0 curve and compile the V/F curves at 0 and 80 degrees Celsius. We can immediately make a couple of important observations.
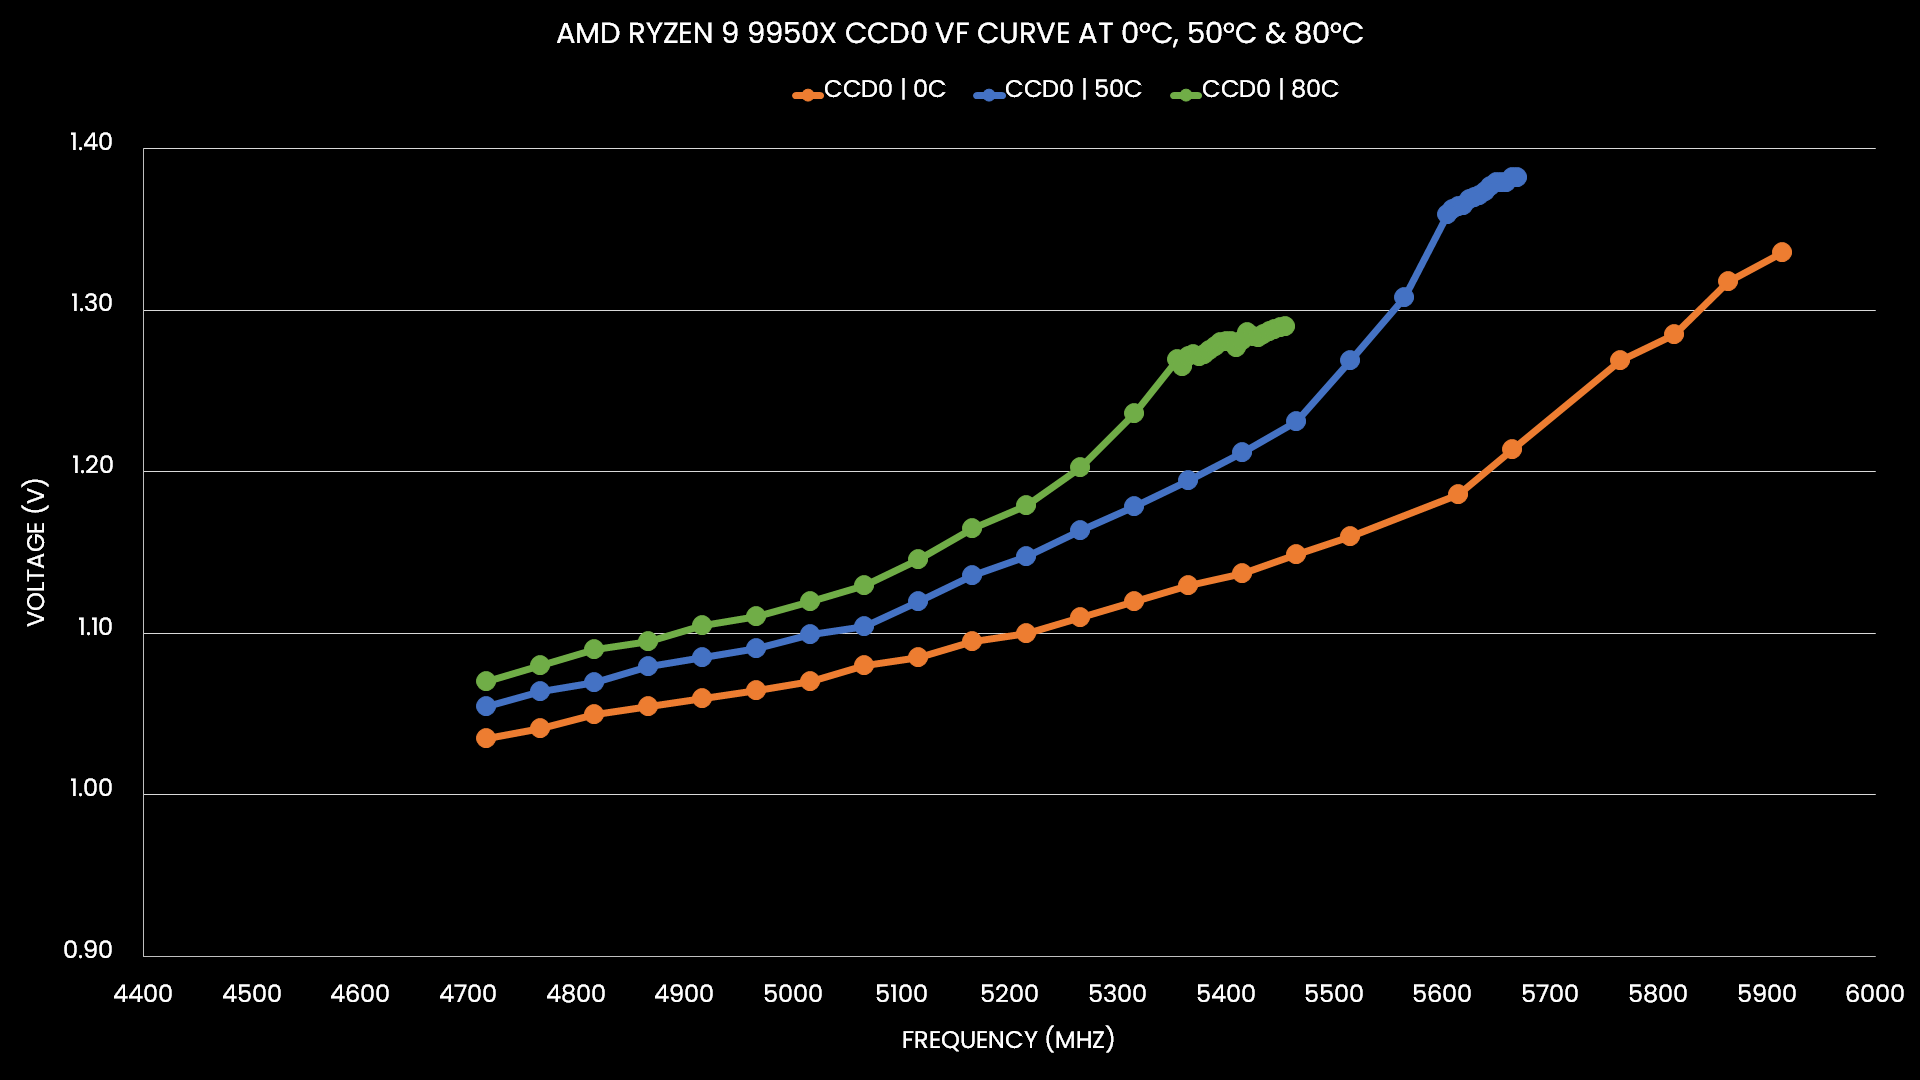
First of all, clearly, this CPU has a different voltage-frequency curve at different temperatures. This clearly outlines that we should always talk about Ryzen’s VFT curve rather than the VF curve.
Furthermore, the V/F curve deviates more at higher frequencies than at lower frequencies. For example, the difference at 4.7 GHz between 0C and 80C is only 35 mV. However, at 5.3 GHz the difference is 116 mV.
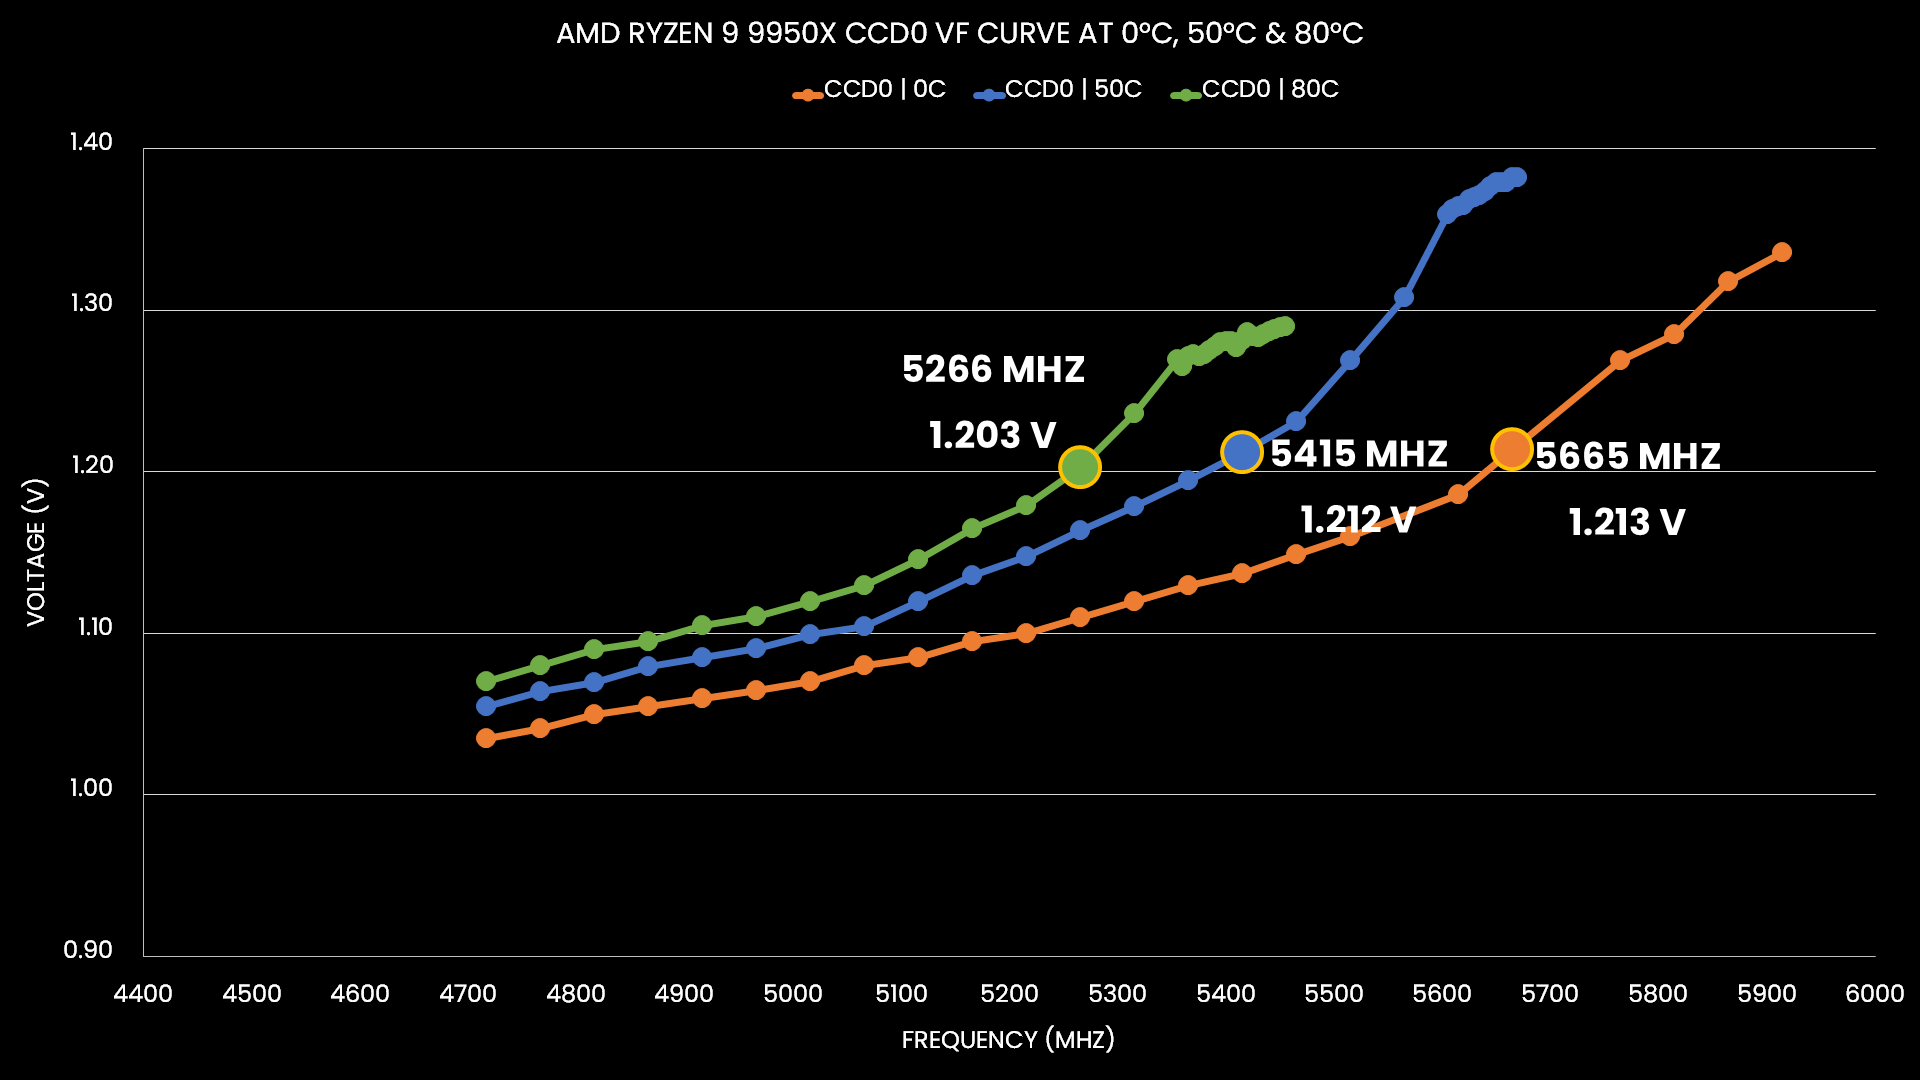
Lastly, we can see that at a similar voltage, there’s much more frequency headroom at lower temperatures. For example, 1.2V yields 5226 MHz at 80C, 5415 MHz at 50C, and well over 5.6 GHz at 0C.
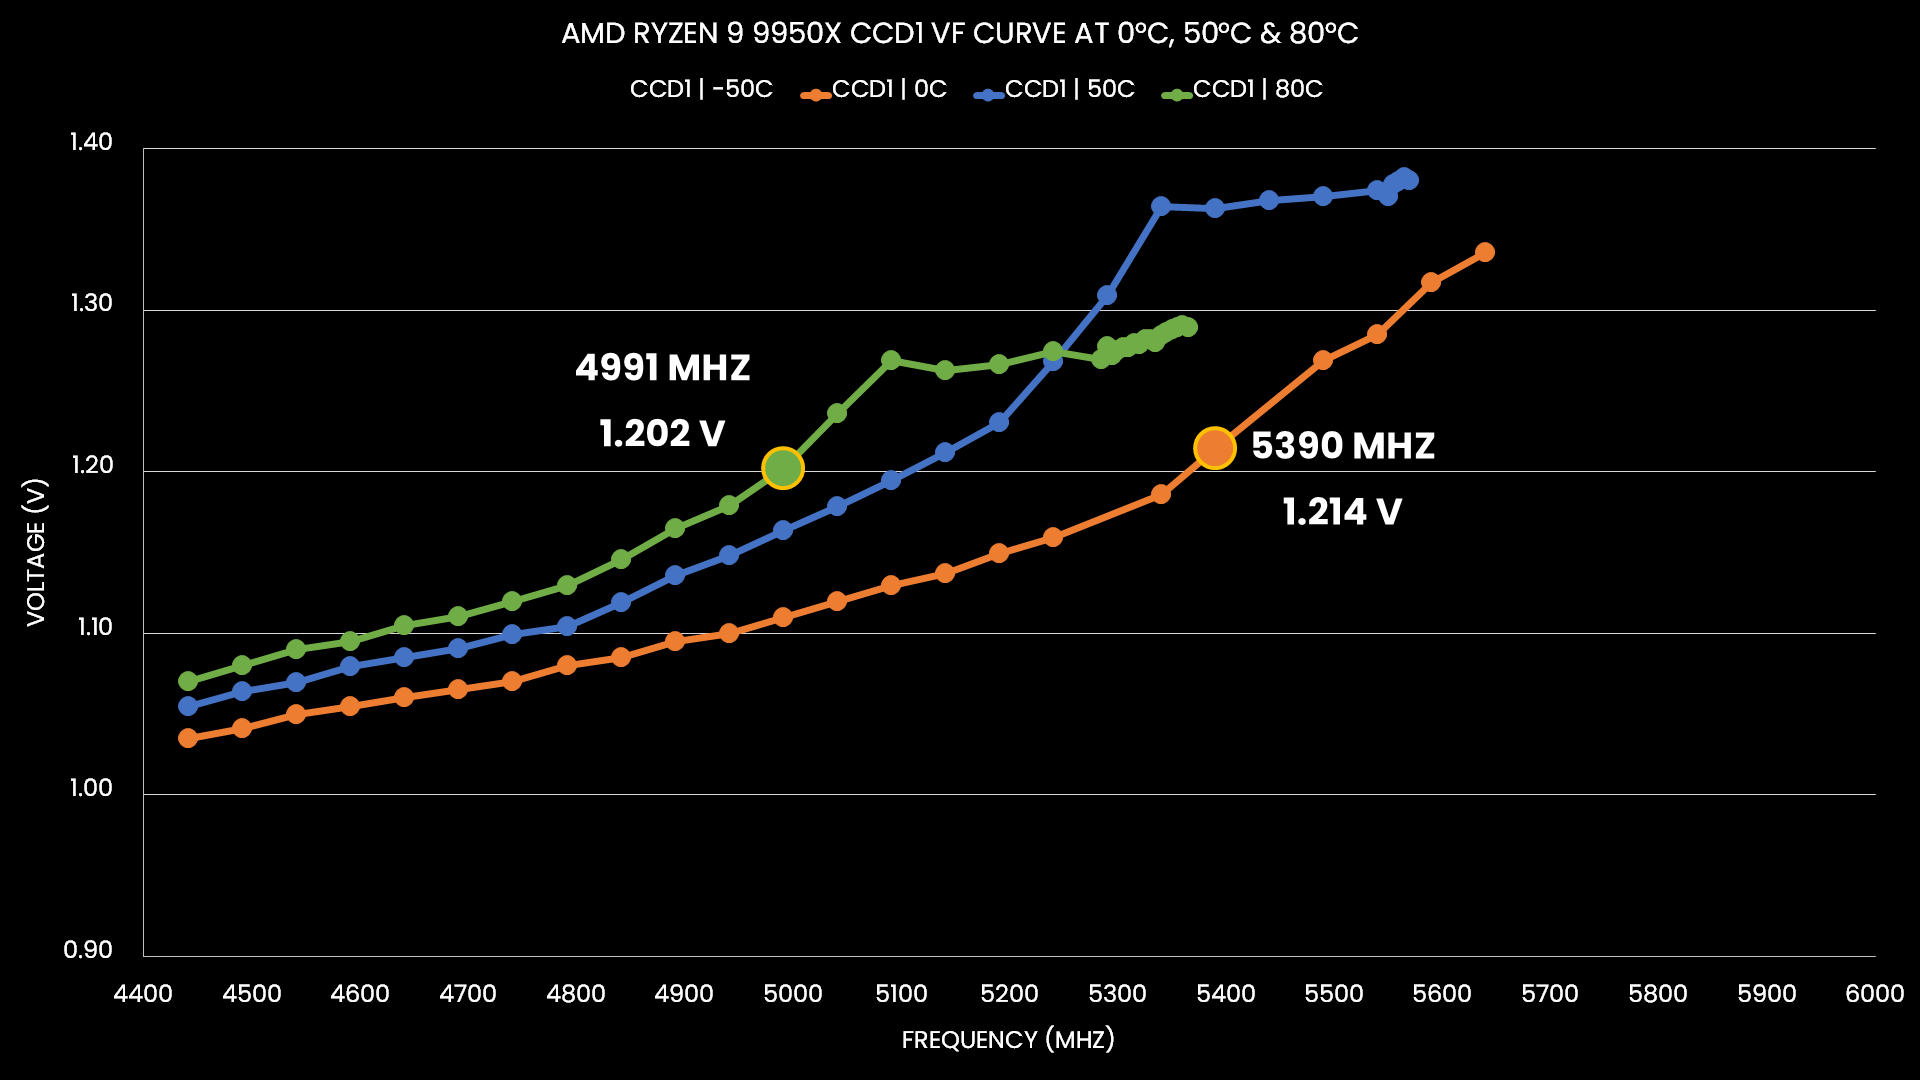
This also holds true for CCD1, by the way. We can see that at 1.2V, for example, we get almost 5.4 GHz at 0C but only 5 GHz at 80C.
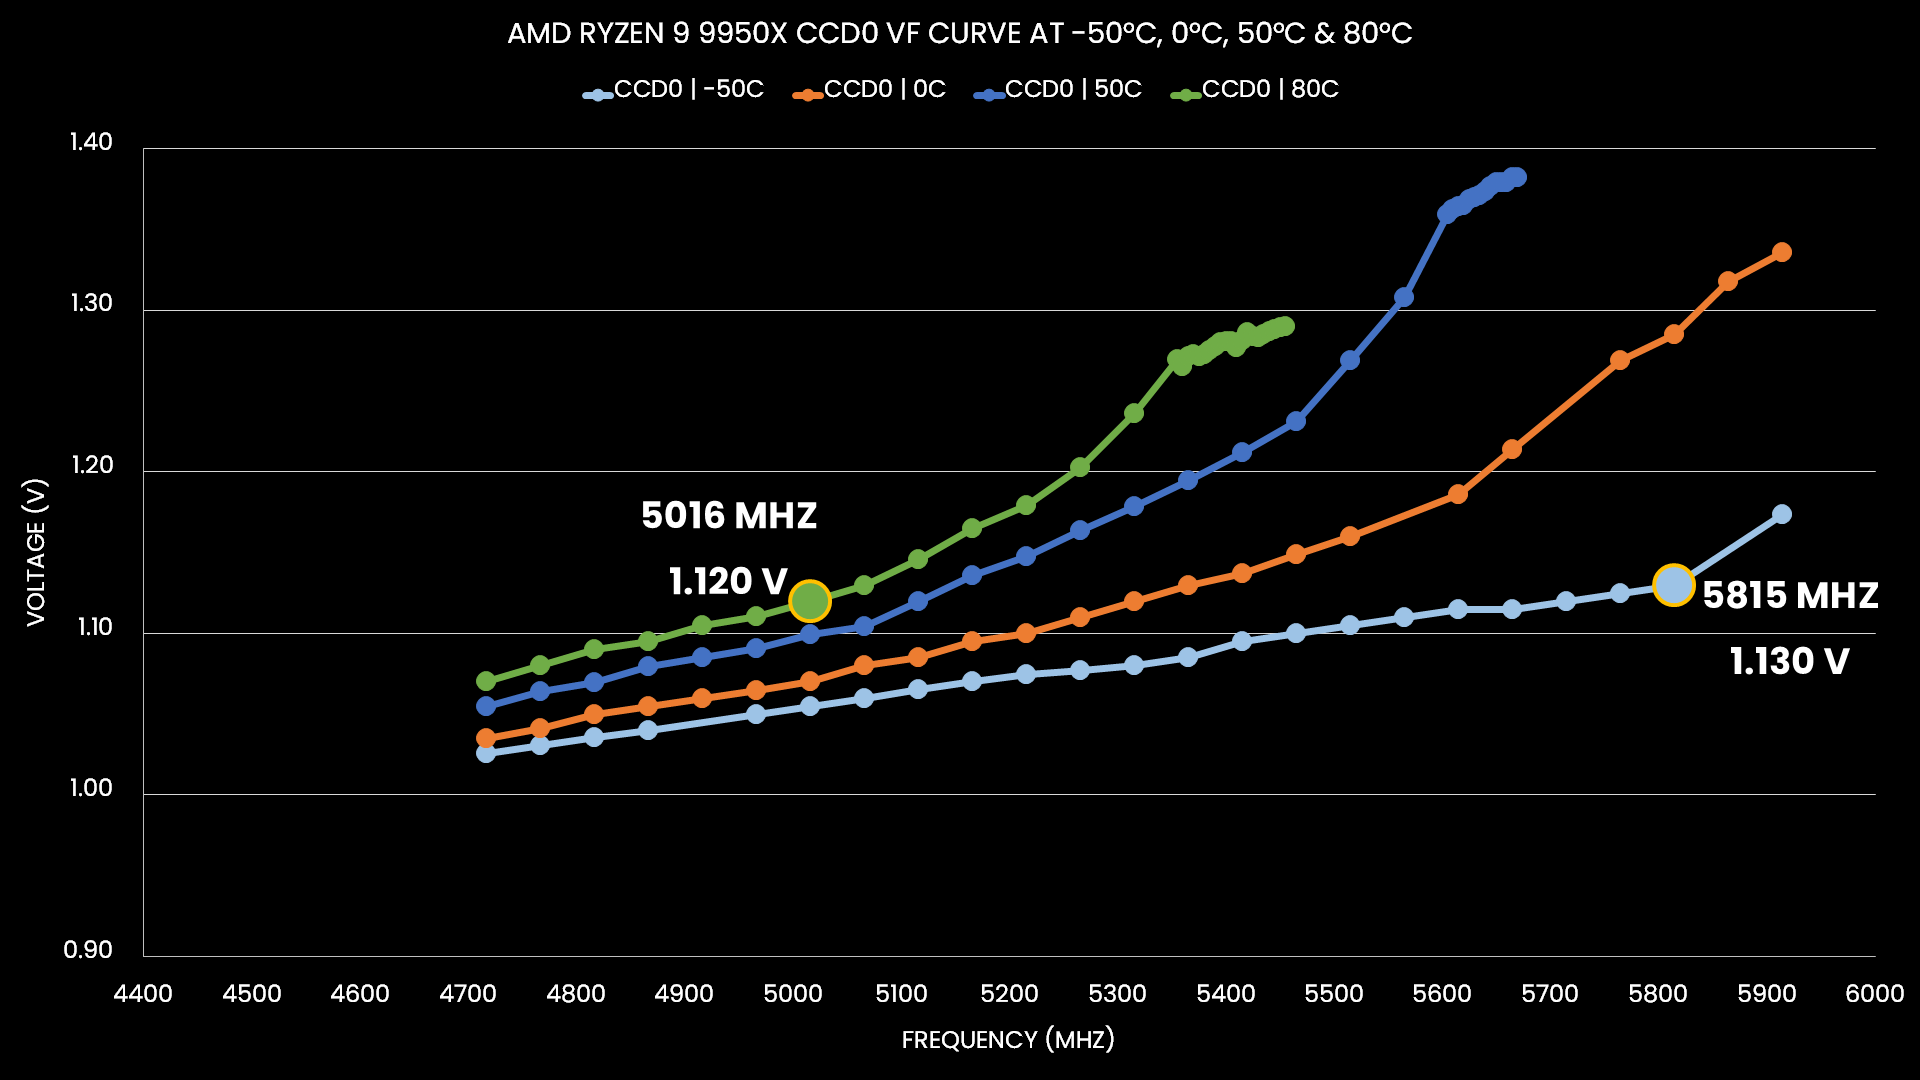
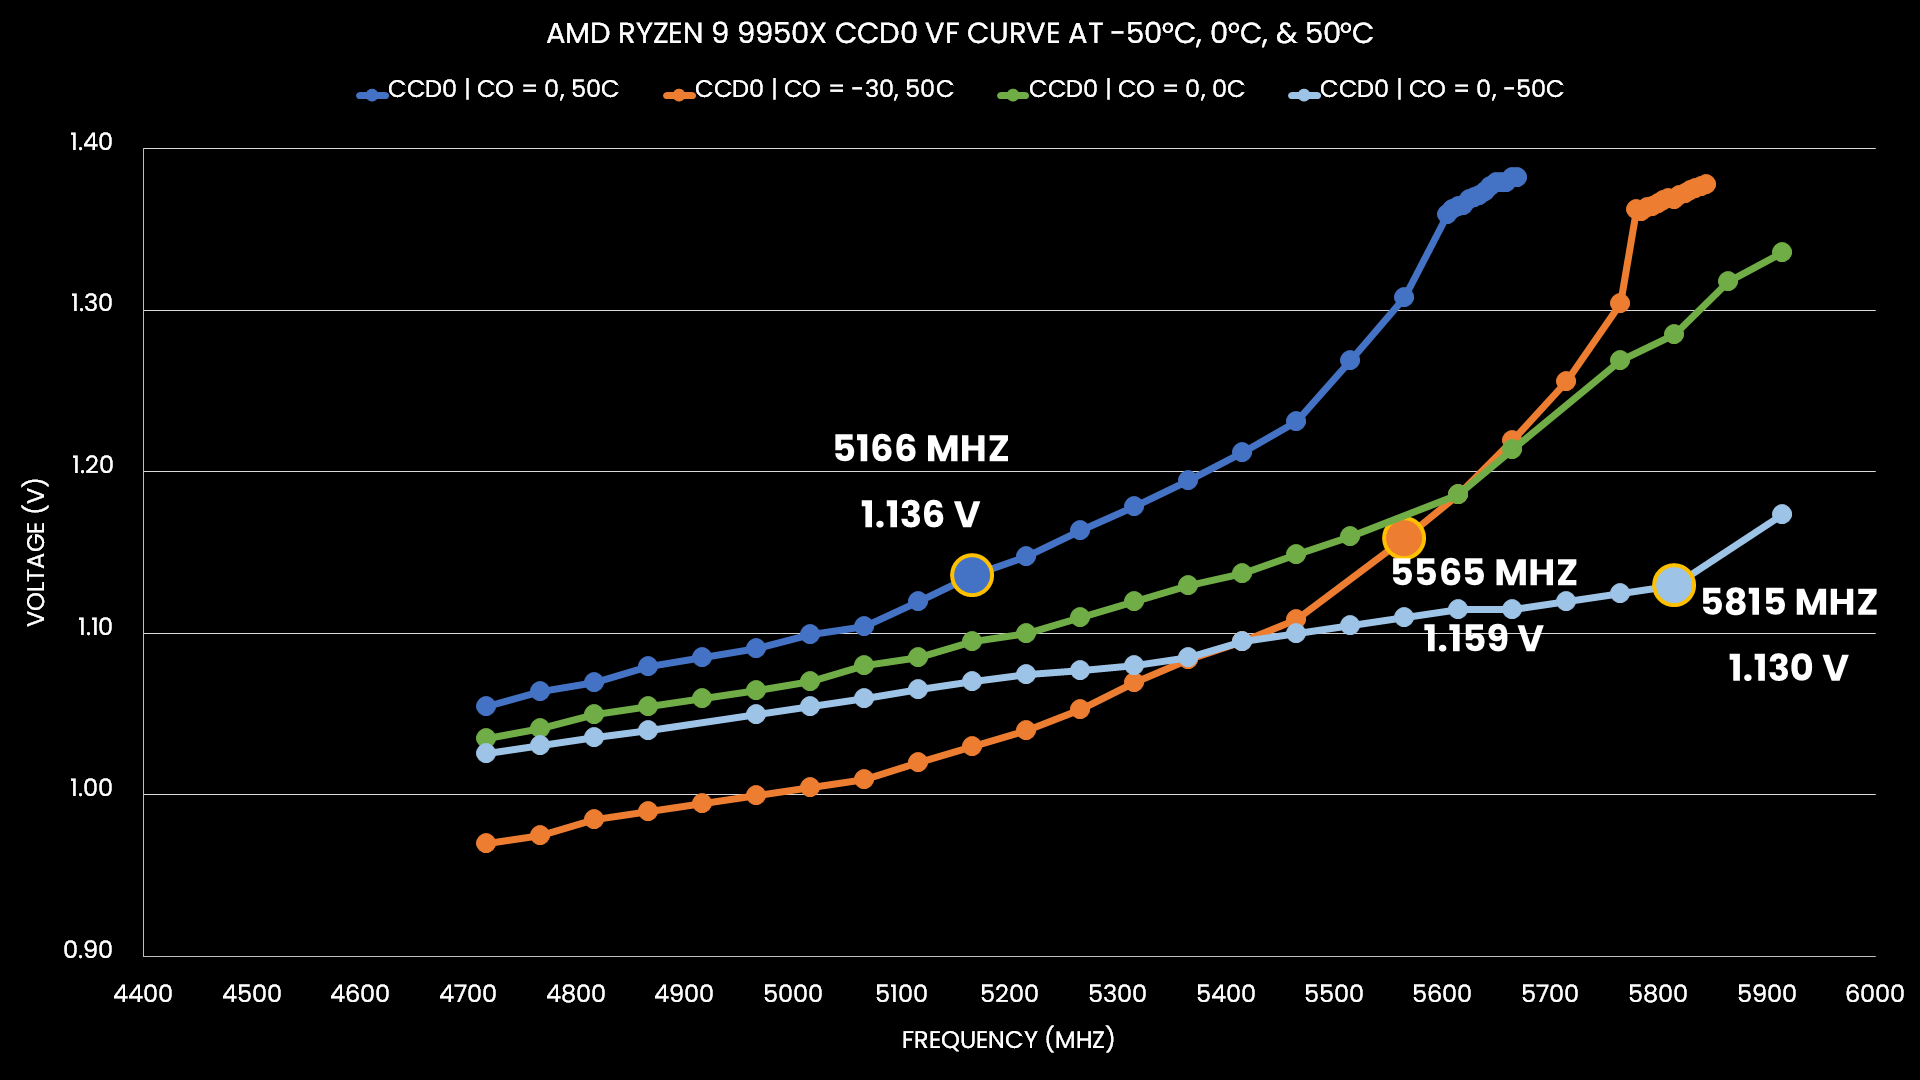
The cool thing – literally – is that Precision Boost scales with negative temperatures too. Check out the V/F curve at -50 degrees Celsius, for example. How cool is that! At -50 degrees Celsius, we get 5.8 GHz with only 1.13V; however, at 80 degrees Celsius, 1.1 V gets us barely over 4.9 GHz. Wow!
The general takeaway from this data is that by reducing the operating temperature, we’re effectively undervolting the CPU. Undervolting and Ryzen CPUs … we’ve heard that before, haven’t we? Of course, but normally we undervolt our CPU with Curve Optimizer.
So … who does it best: Curve Optimizer or our cooler?
Curve Optimizer Undervolt
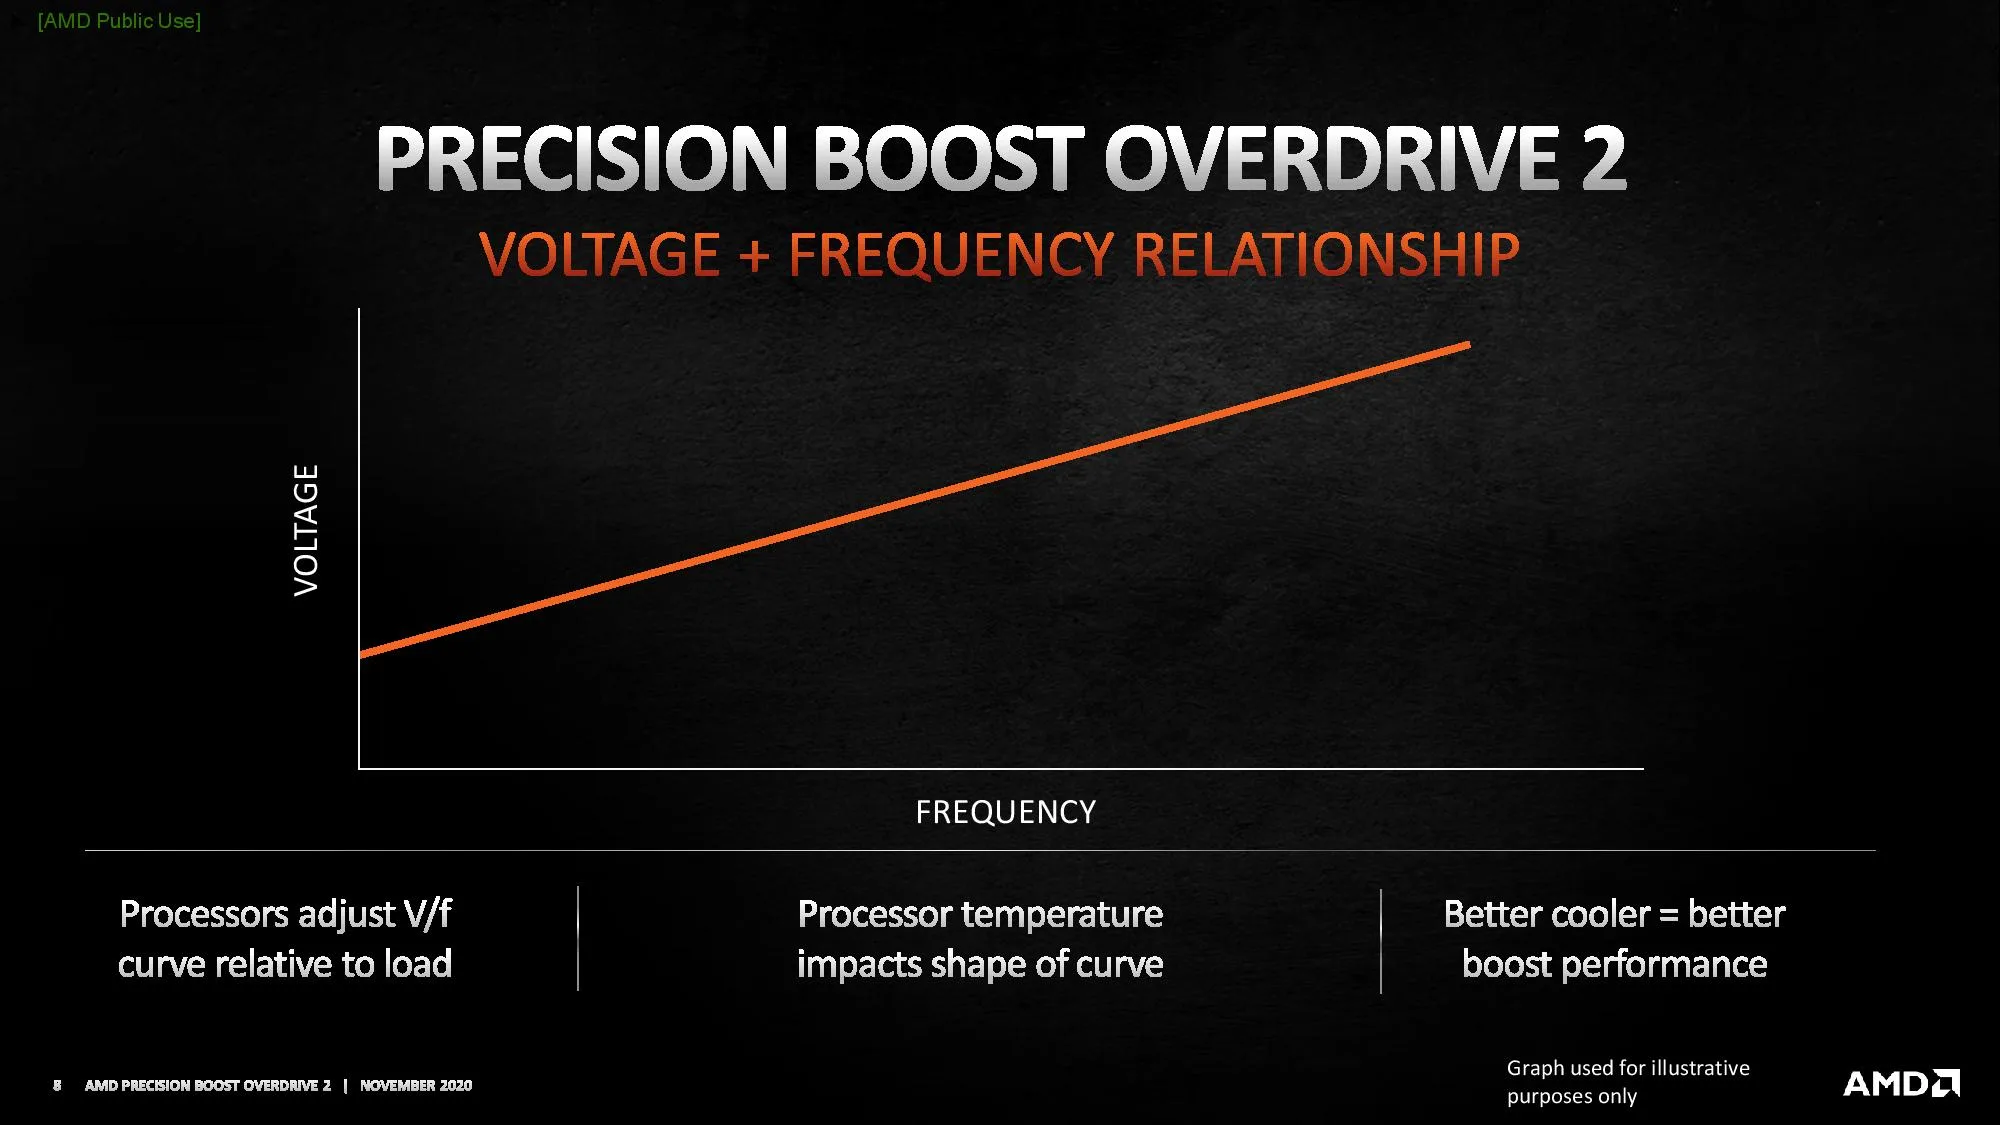
Curve Optimizer has been one of the most important overclocking tools of the Precision Boost Overdrive 2 toolkit. It is most commonly used to undervolt the CPU by setting a negative curve optimizer magnitude.
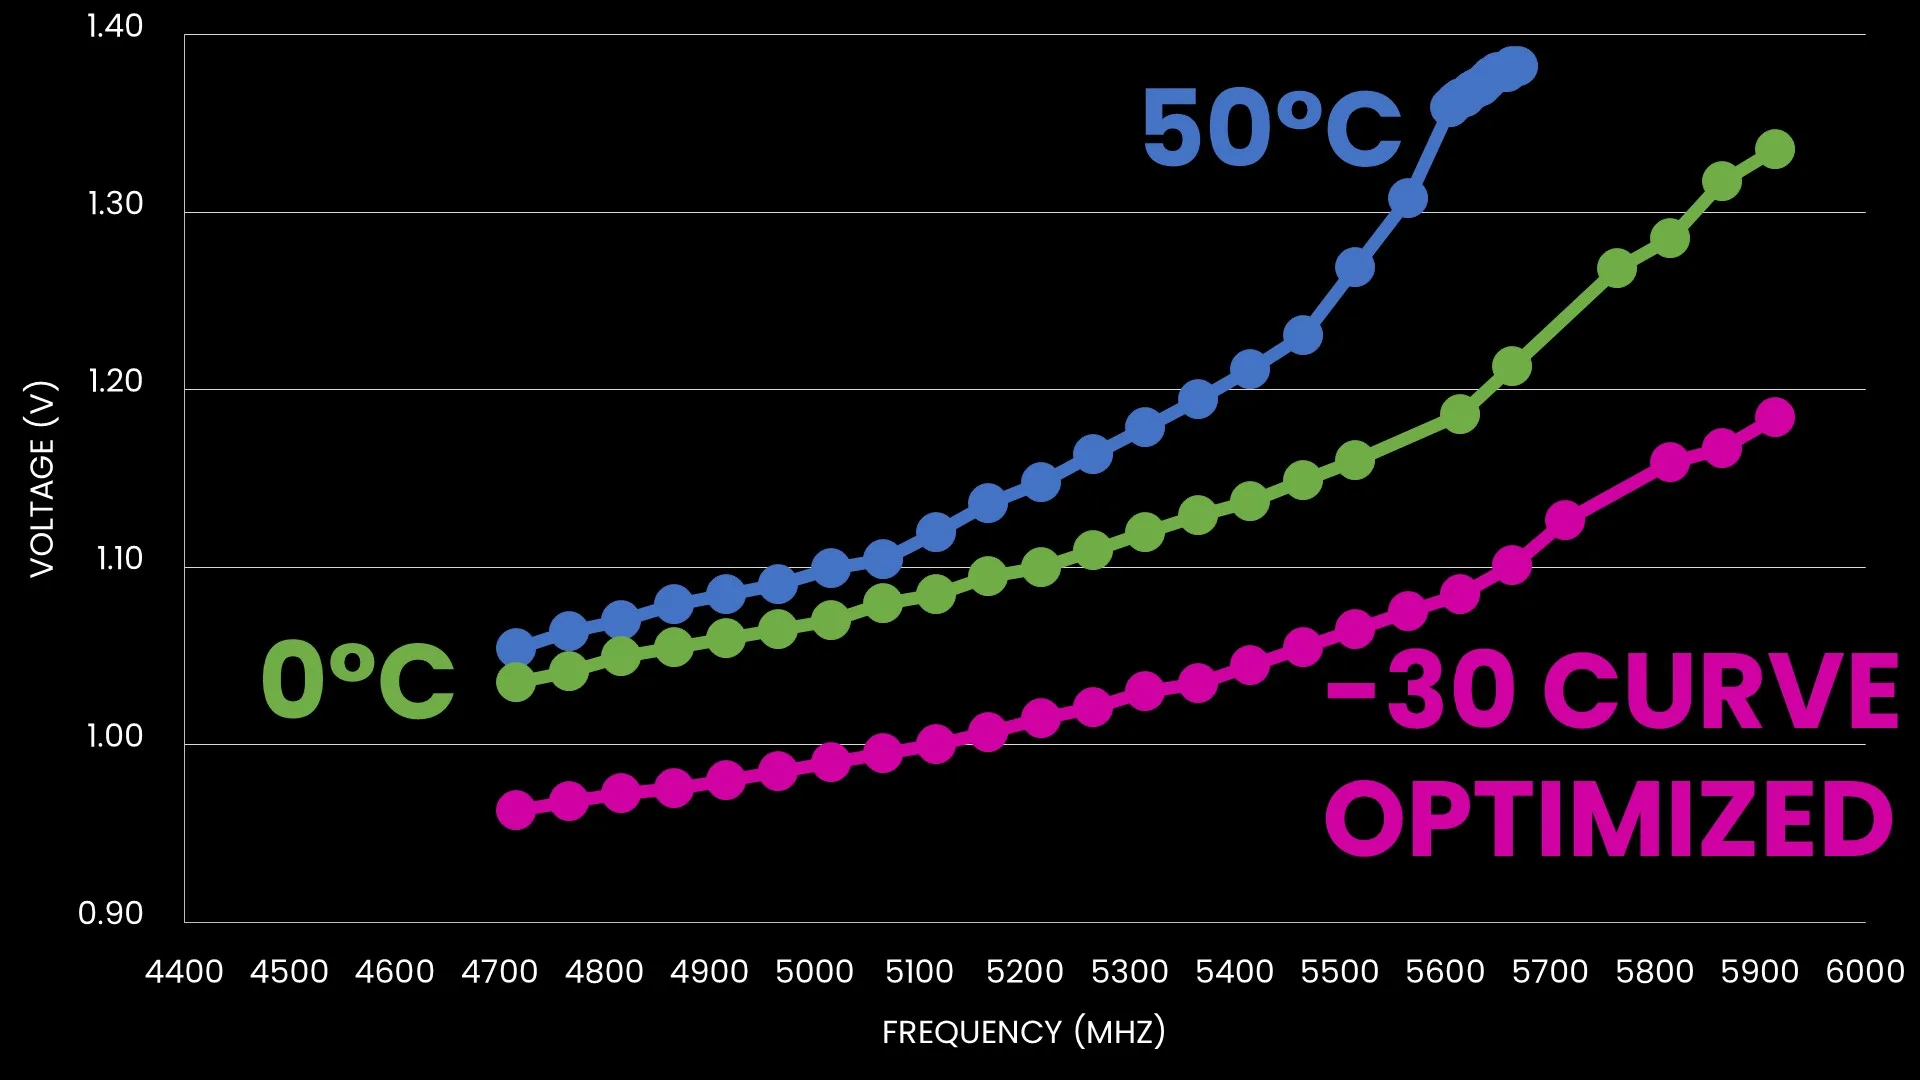
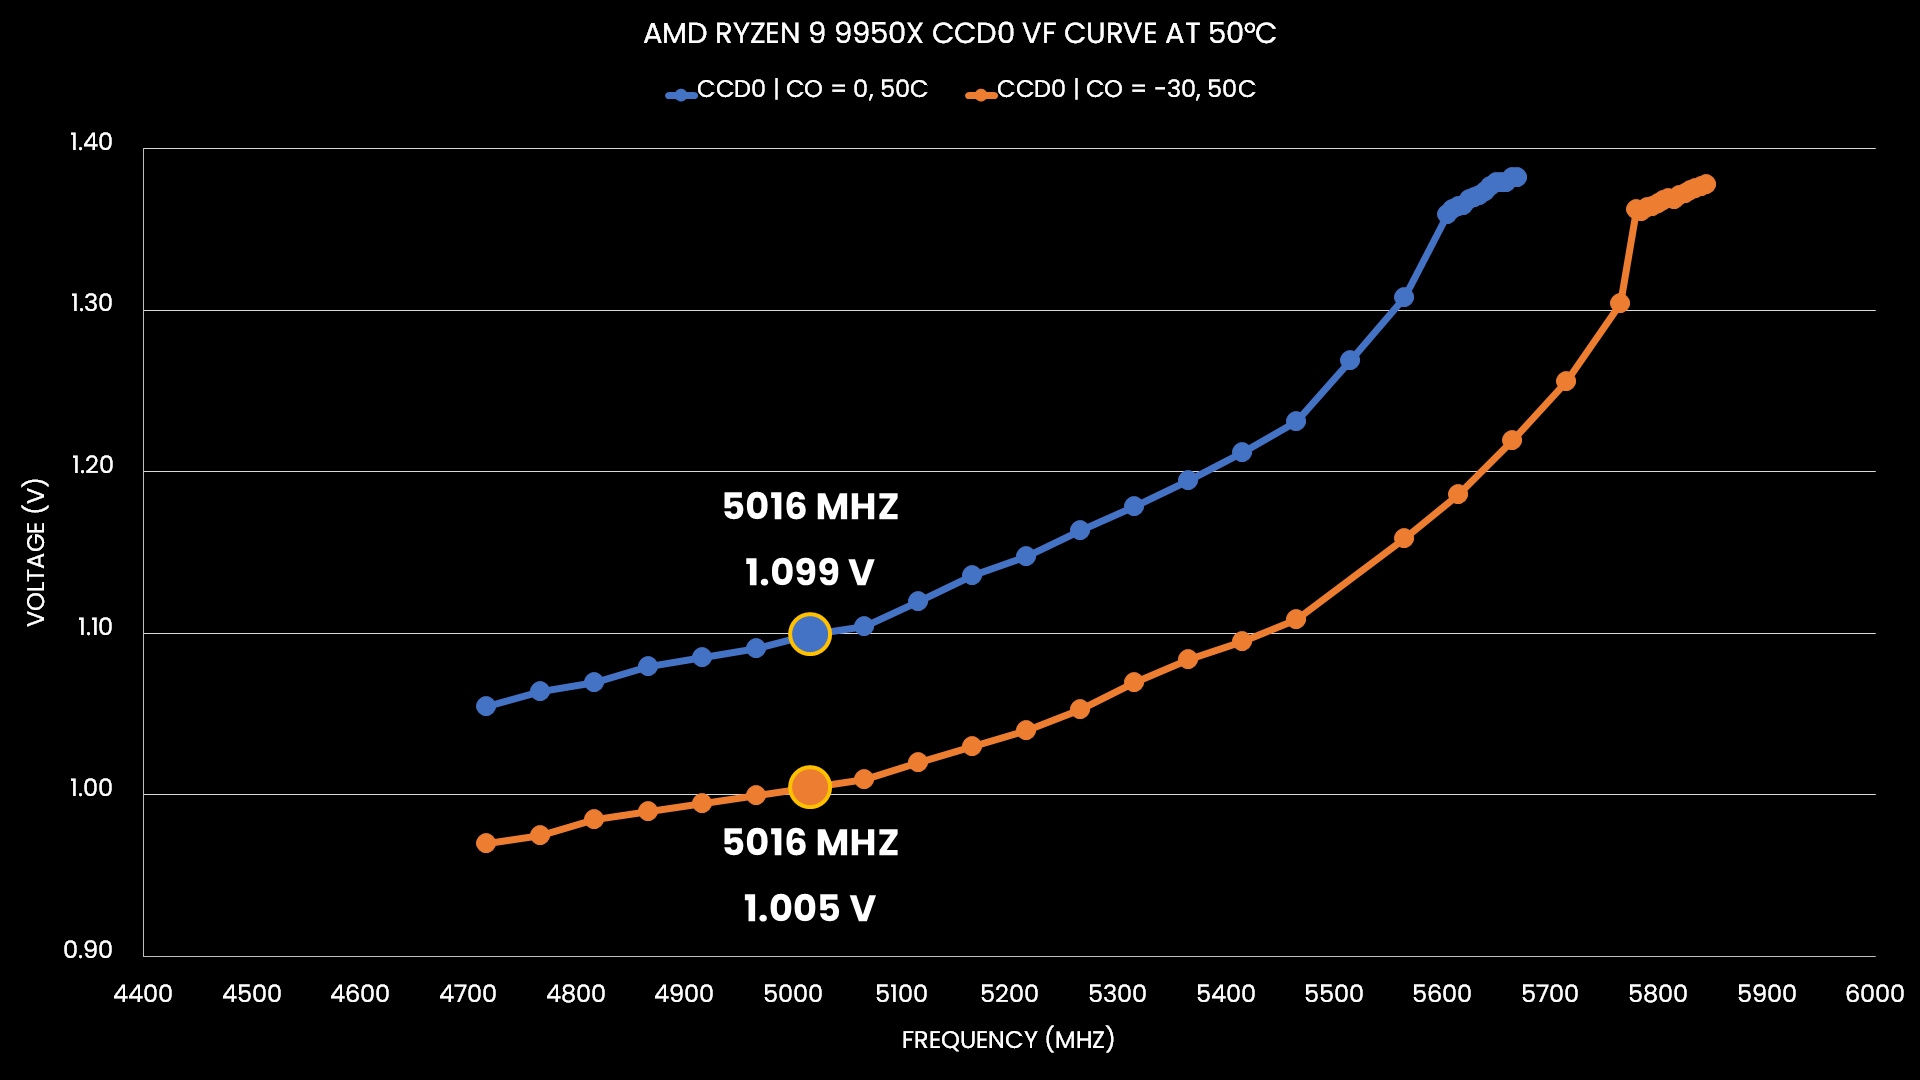
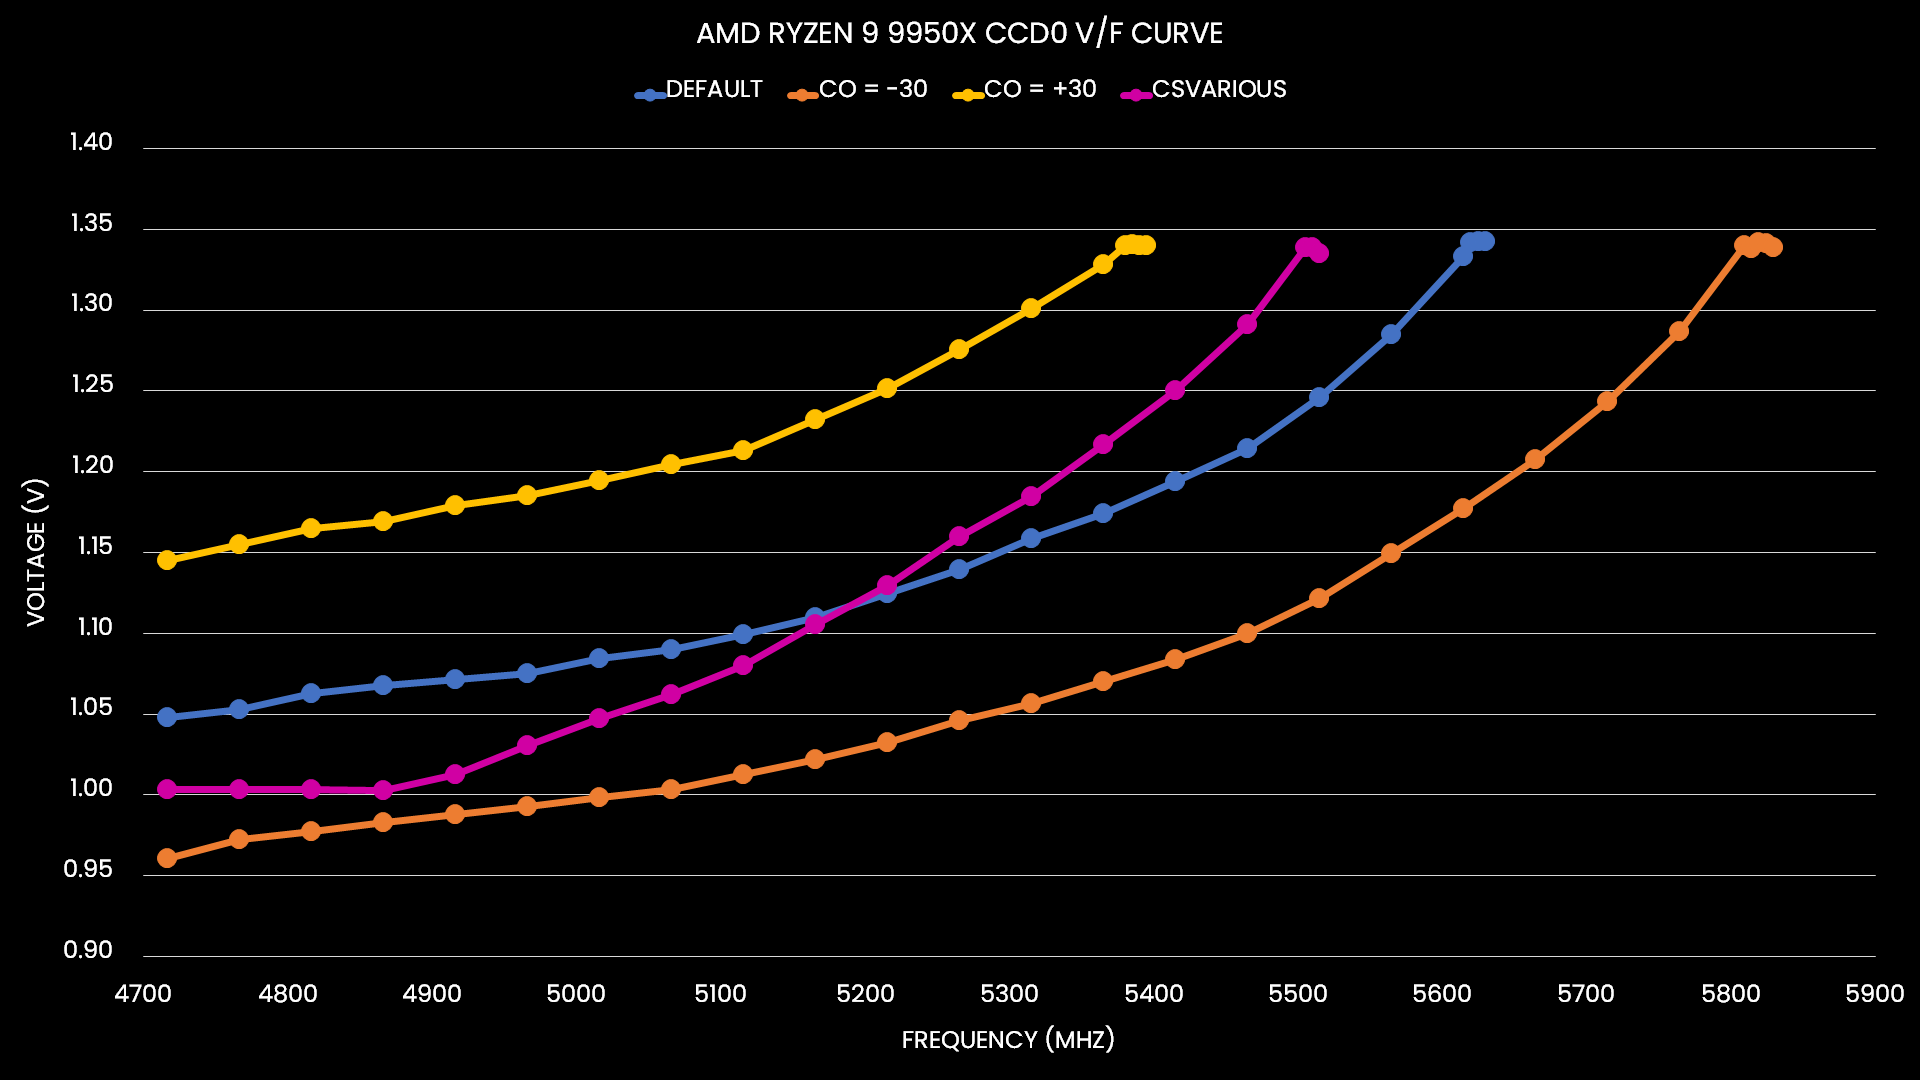
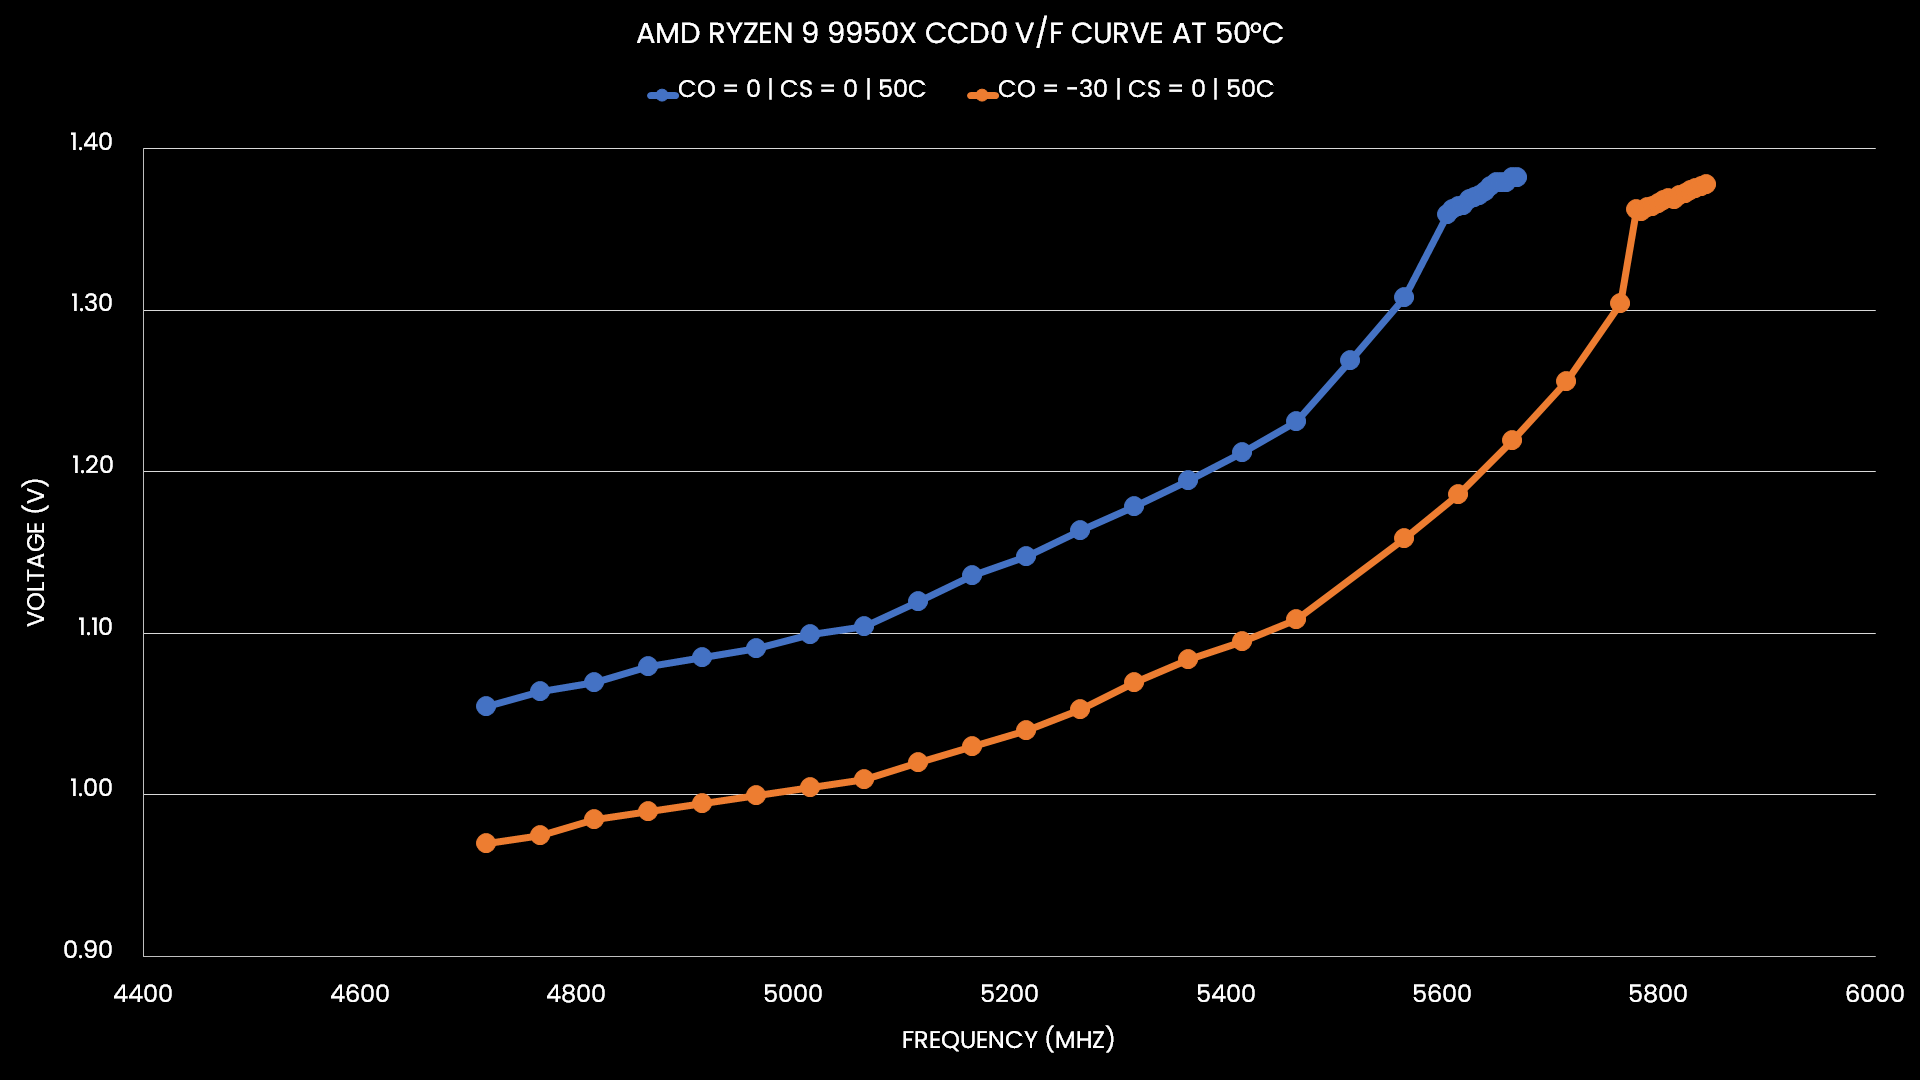
If we set Curve Optimizer to negative 30, we shift the entire voltage-frequency curve along the voltage axis. And, suddenly, we need significantly less voltage for every operating frequency. For example, with CCD0 at 50 degrees Celsius, for 5 GHz we needed about 1.1V by default, but with a -30 Curve Optimizer, now we only need 1.005V!
Now let’s compare the Curve Optimizer and operating temperature undervolt mechanism.
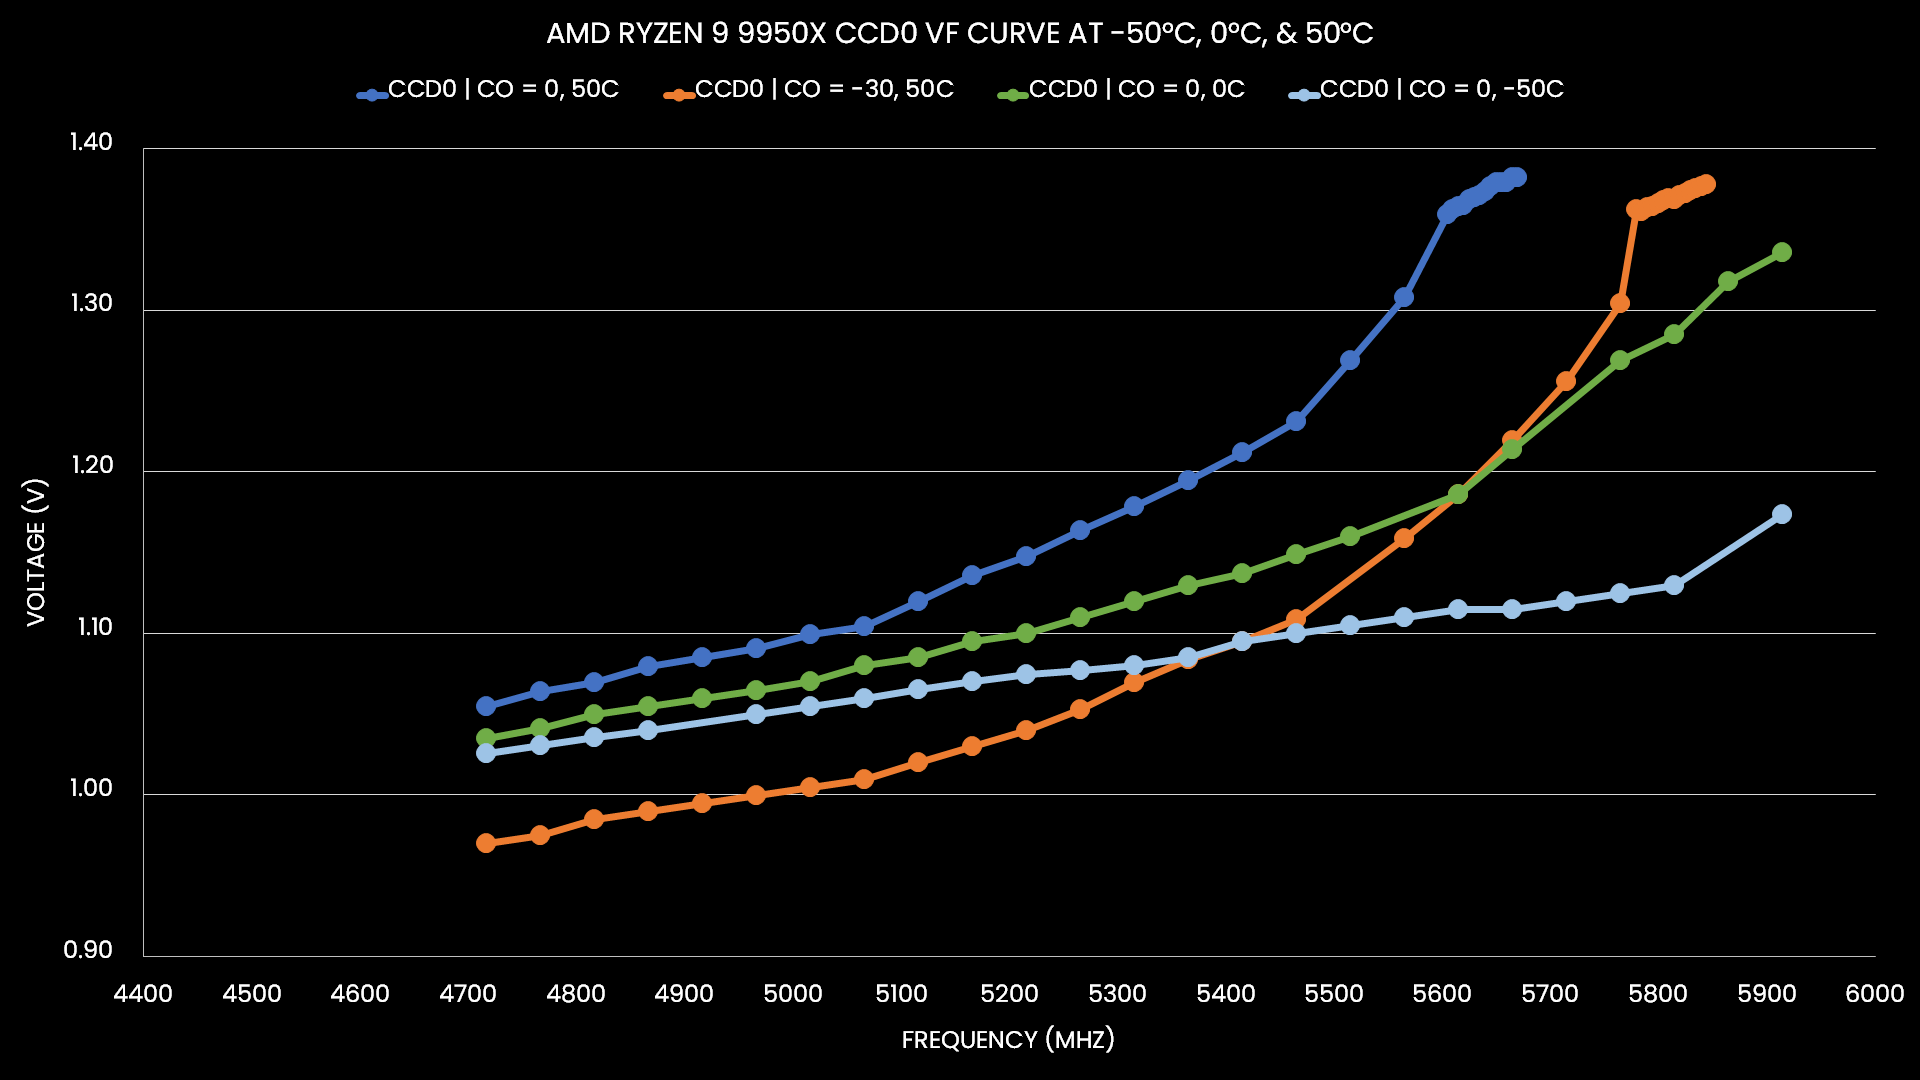
It’s quite obvious that Curve Optimizer and lowering the operating temperature have a very different impact on the V/F curve. Curve Optimizer’s impact is much more homogenous across the curve while lowering the temperature is much more impactful at the upper end of the curve than at the lower end.
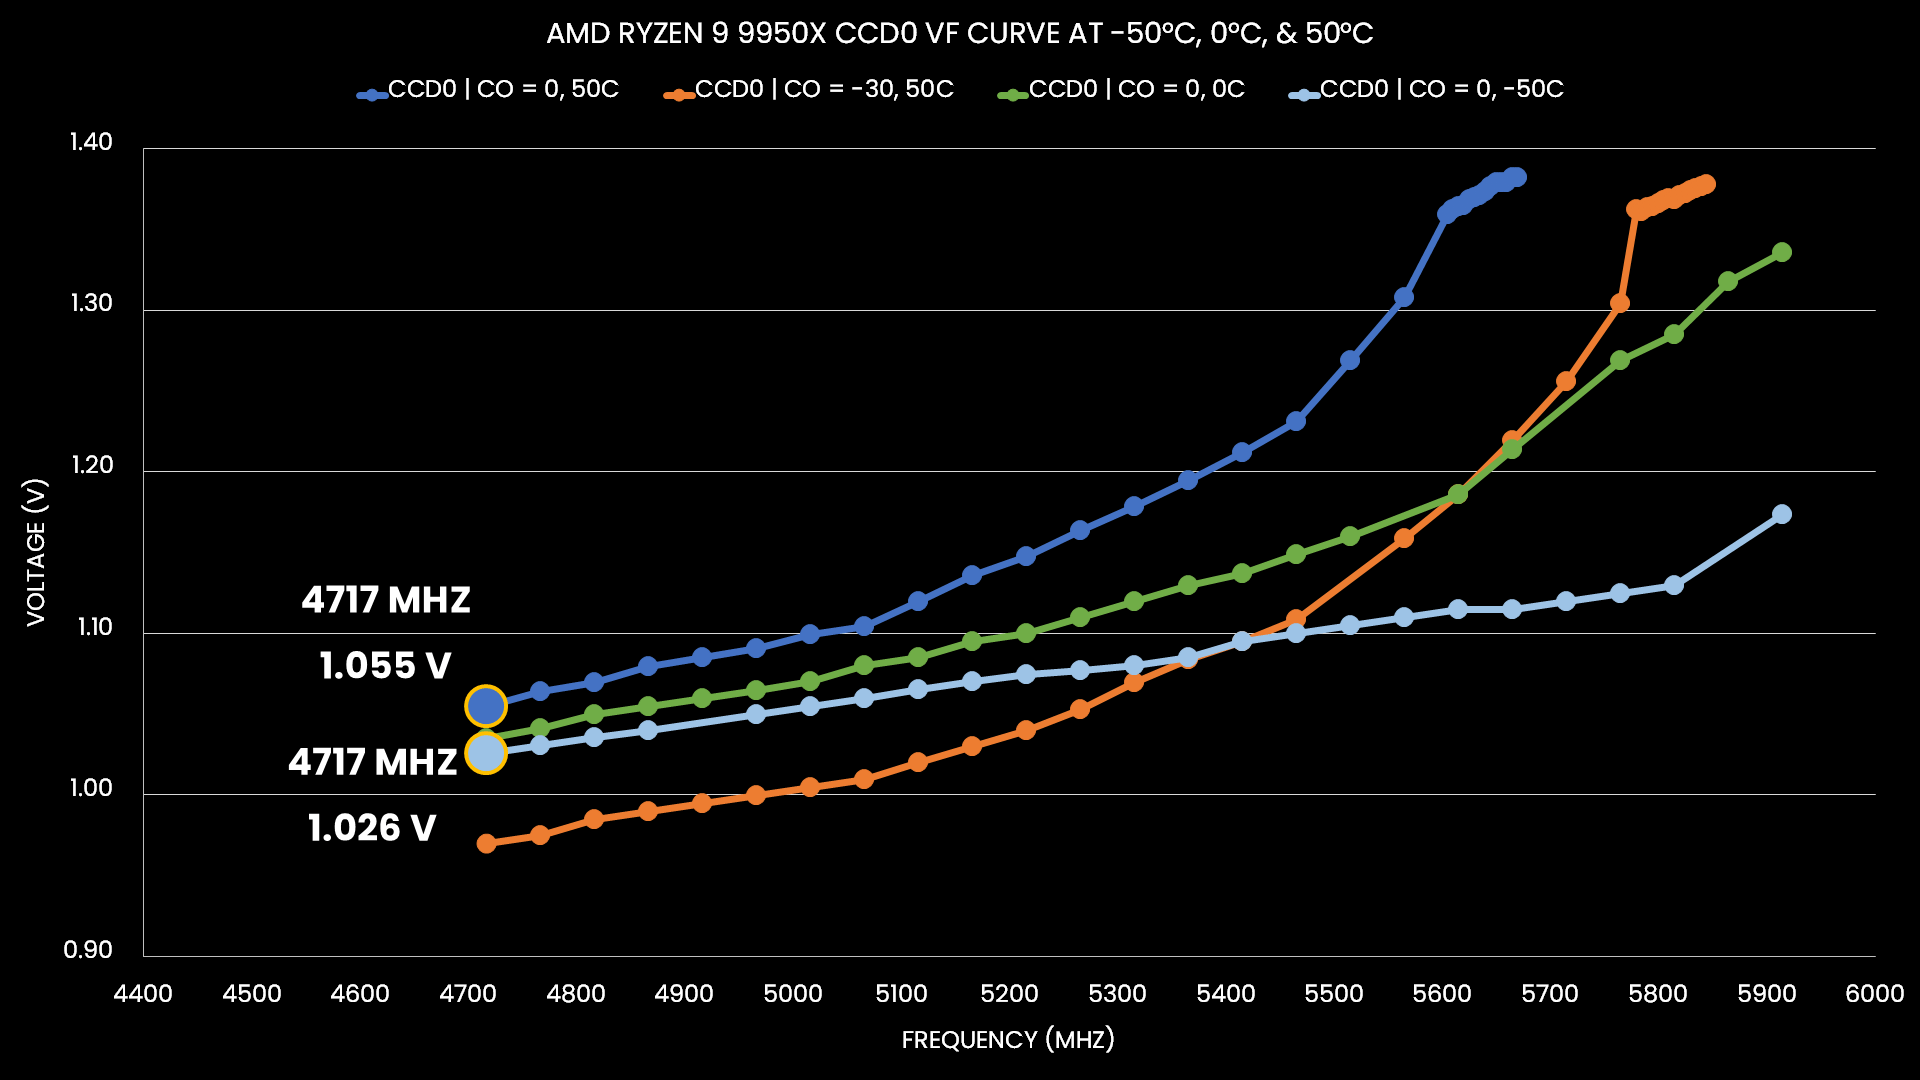
For example, at -30 Curve Optimizer, the voltage required for 4.7 GHz decreases by 85 mV (from 1.055V to 0.97V). In contrast, reducing the operating temperature by 100 degrees Celsius from +50 to -50 degrees Celsius only reduces the voltage by 30 mV.
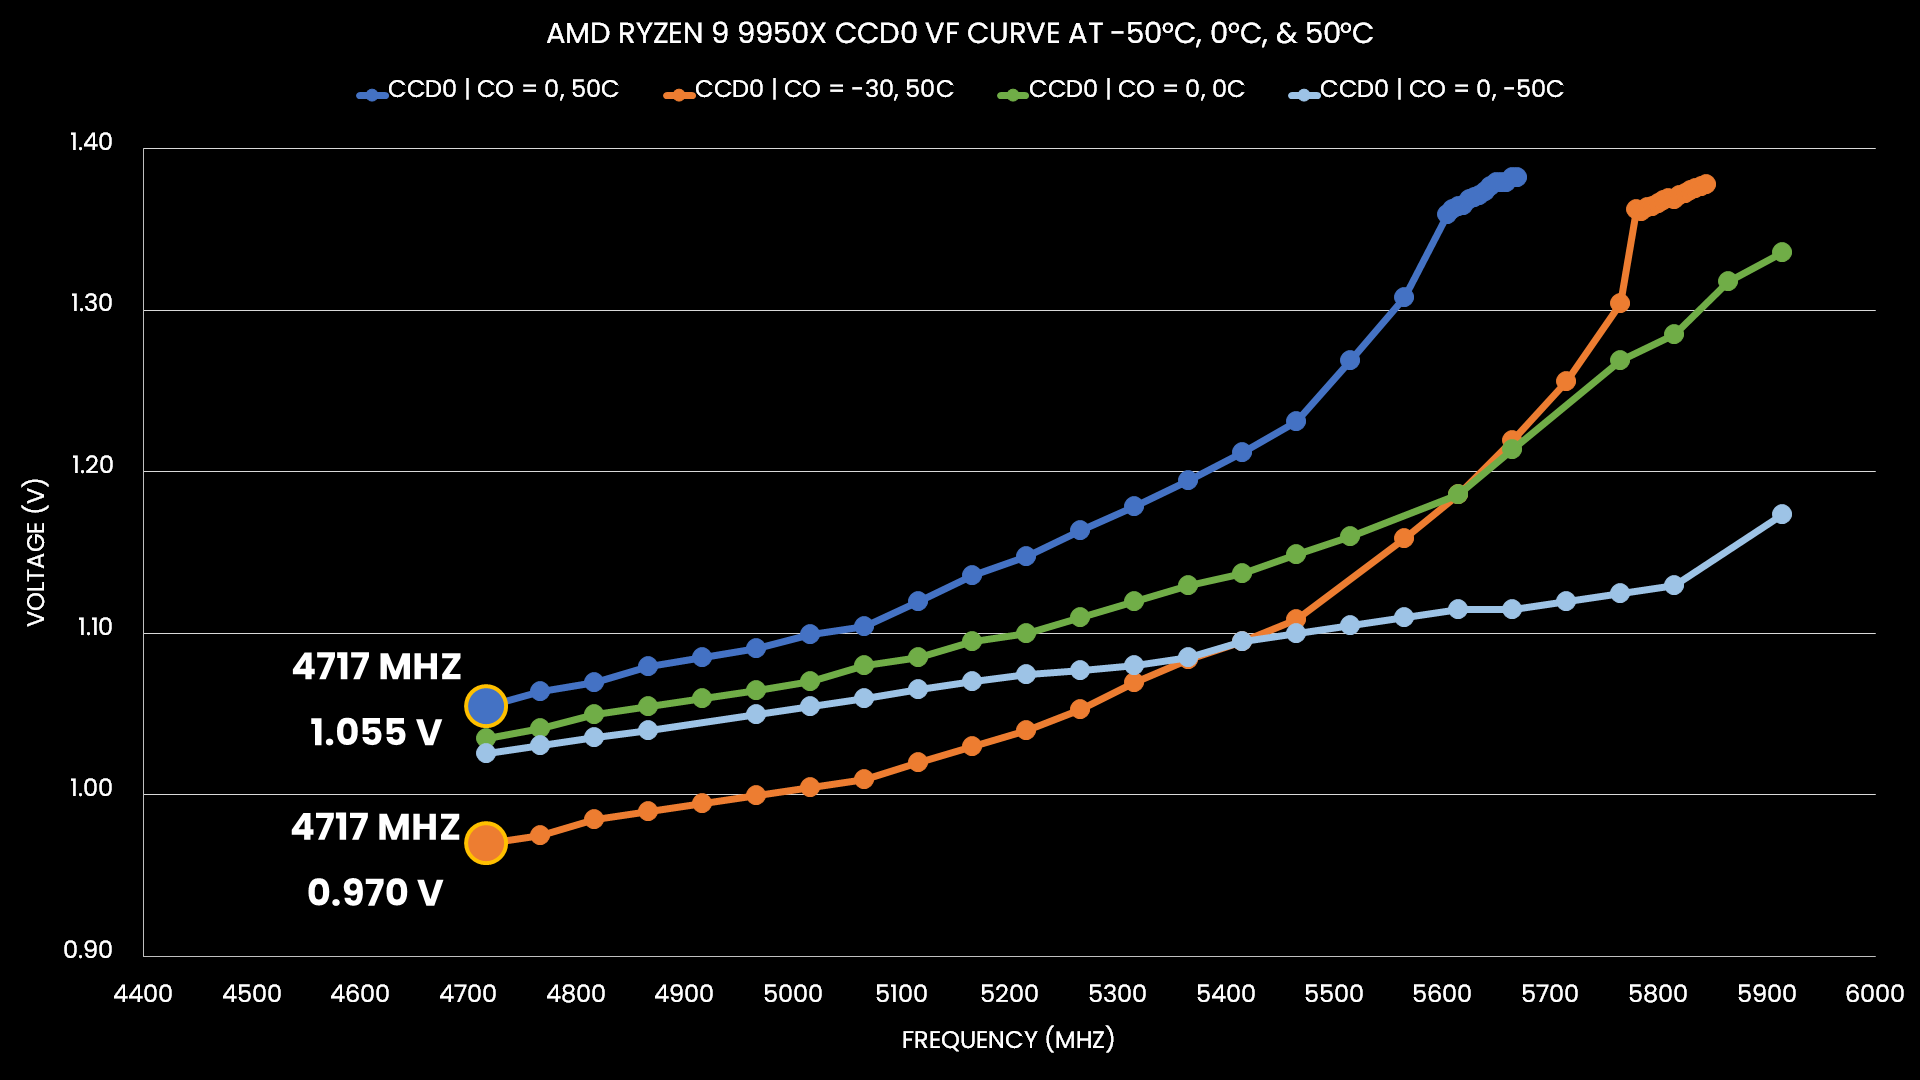
However, with a temperature of -50 degrees Celsius, we get over 5.8 GHz at 1.13V, an improvement of more than 600 MHz over default. In contrast, -30 Curve Optimizer only yields about 5.5 GHz at that voltage. That’s still a 300 MHz improvement from stock, but 200 MHz less than when we reduced the temperature to -50 degrees Celsius.
So, what if we take the best of both worlds? Unfortunately, a -30 curve optimizer wasn’t stable at -50 degrees Celsius. However, it was stable at 0 degrees Celsius.
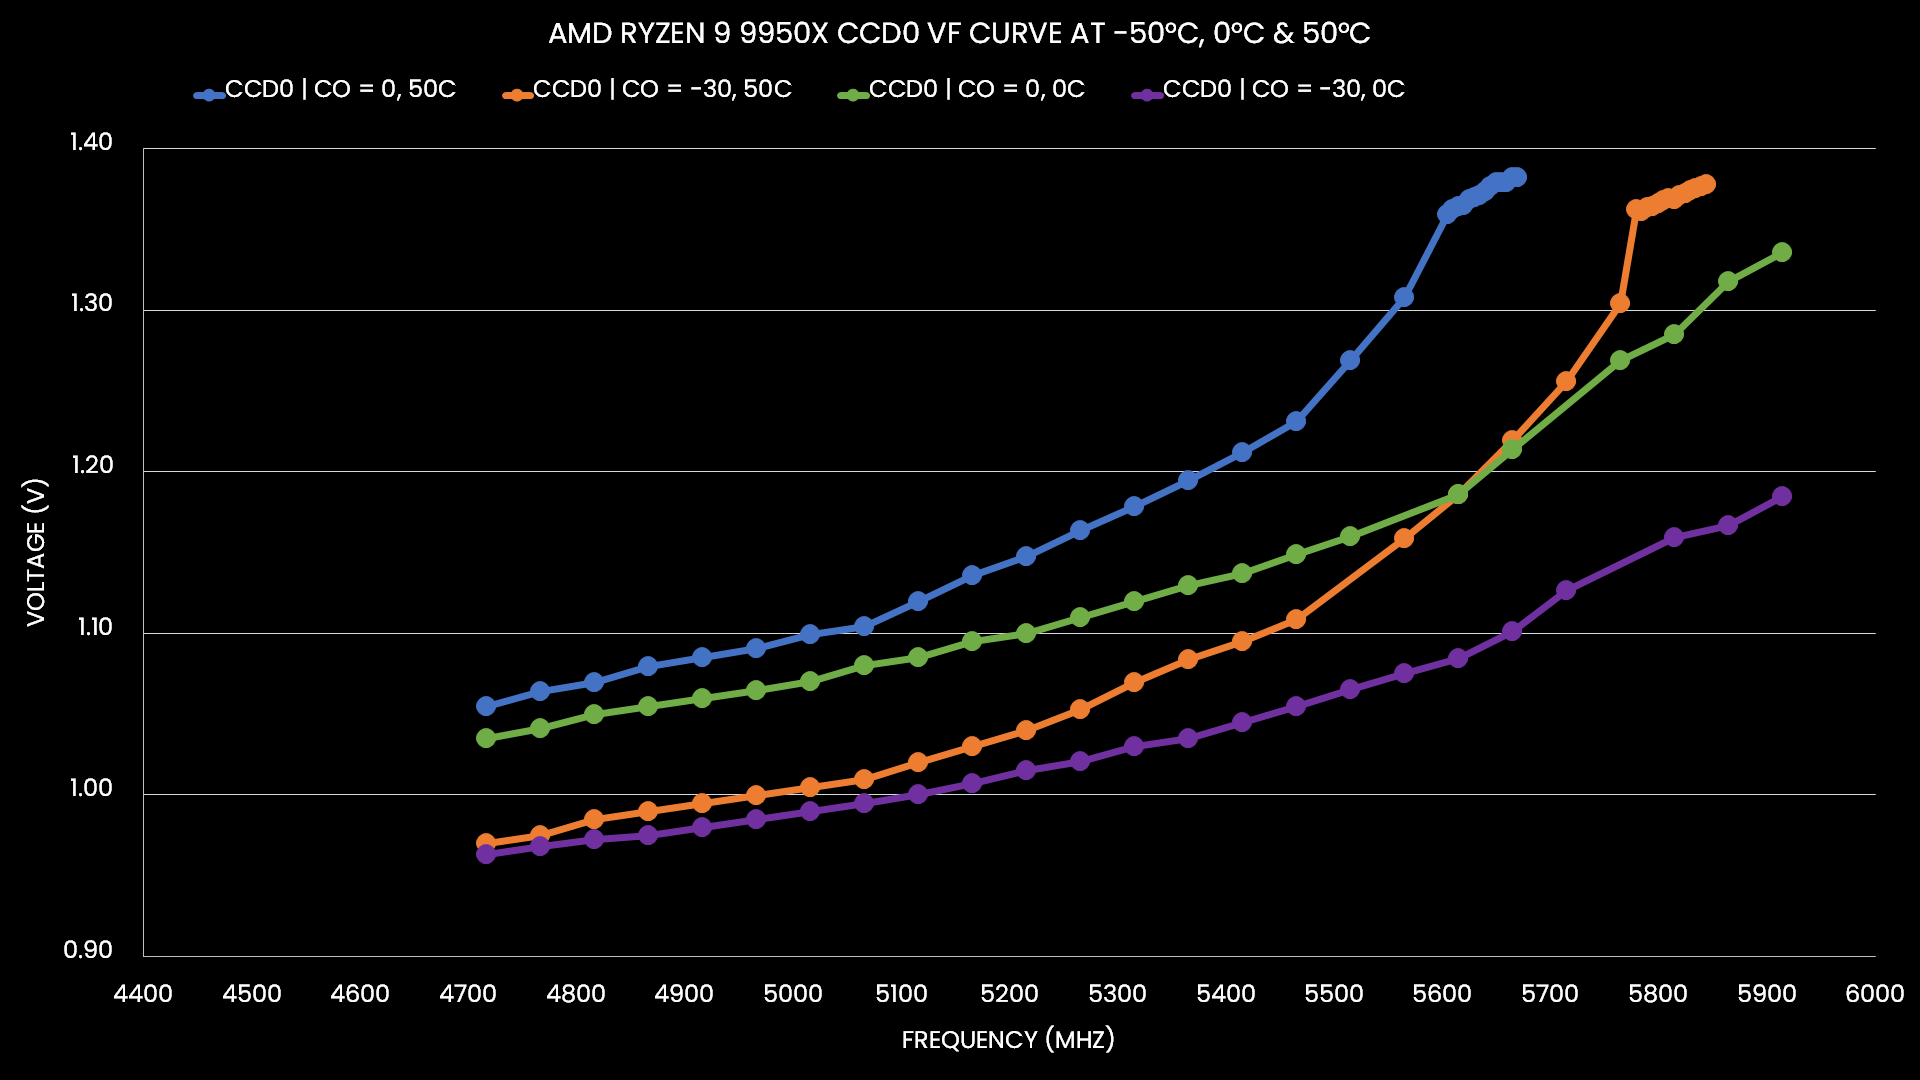
We can see that the shape of our Curve Optimized 0 degree curve resembles very much the with no undervolt … it’s just shifted along the voltage axis. For reference, here’s the curve at -50 degrees again.
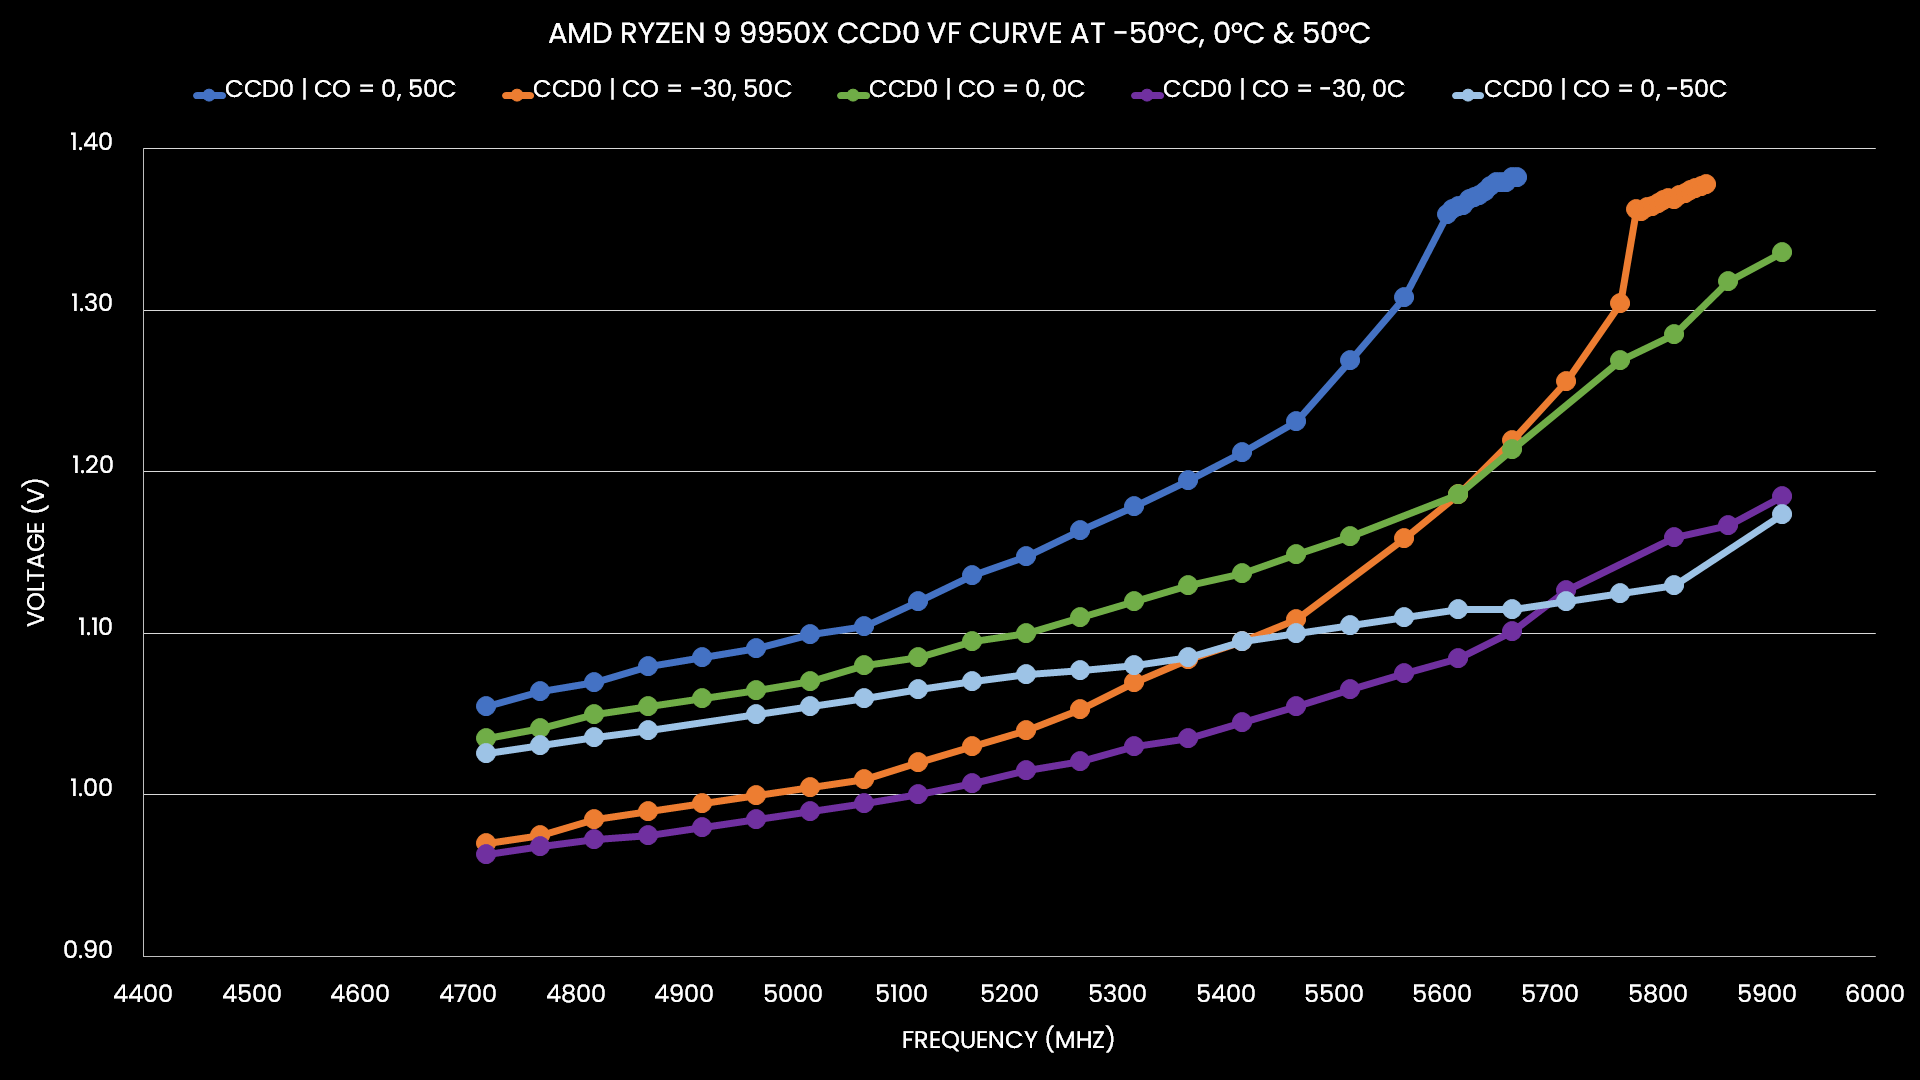
We can see that the Curve Optimized 0 degrees curve is, for the large part, achieving higher frequencies at lower voltages. It is only at around 5.7 GHz that our much cooler curve achieves slightly better frequencies.
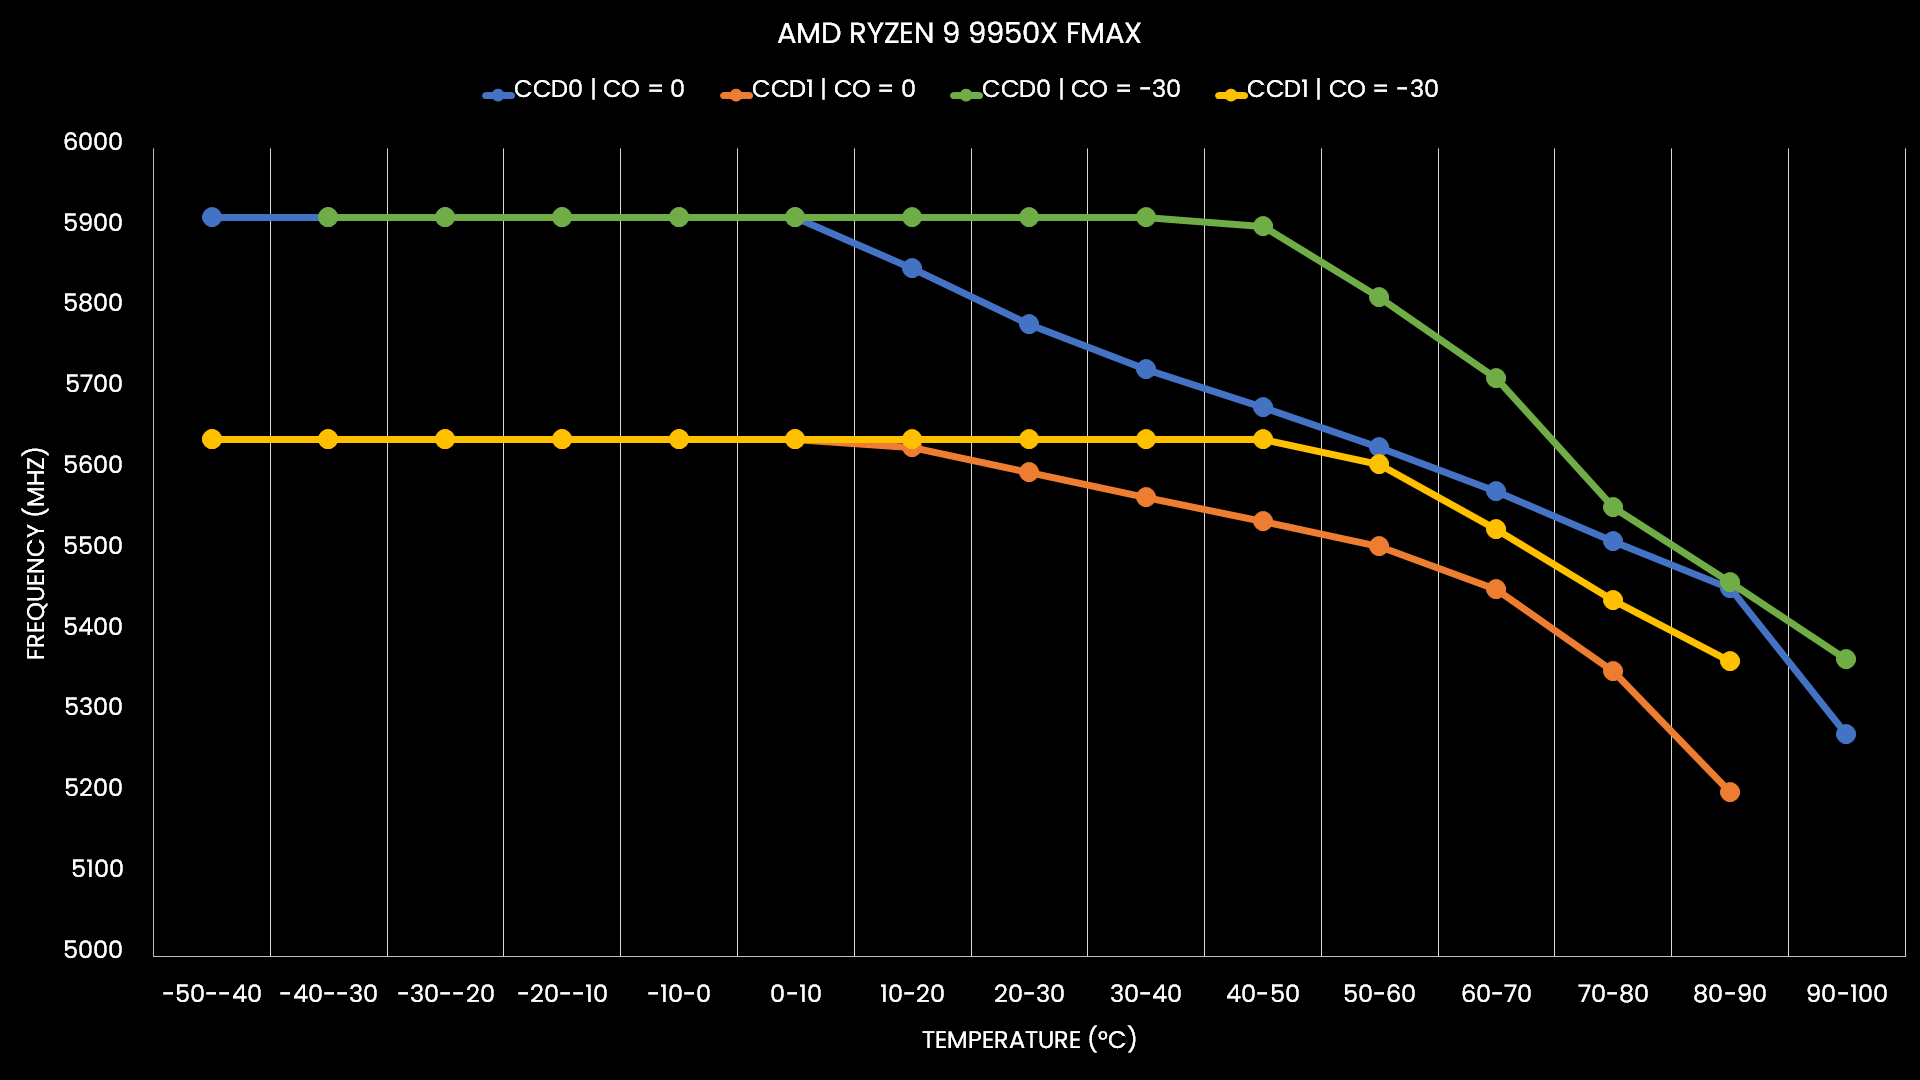
There’s another, perhaps more intuitive way to look at the behavior. This time, I track the CPU frequency in a light all-core workload starting from -50 degrees Celsius all the way up to 90 degrees Celsius.
At default, we find that CCD0 and CCD1 maintain their Fmax frequencies until about 10 degrees Celsius. Then, the maximum frequency drops gradually until about 80 degrees Celsius. There’s a much steeper drop near the TjMax (or maximum allowed temperature). After applying a negative 30 curve optimizer, both CCD0 and CCD1 can maintain the Fmax frequency for much longer. The initial frequency drop happens only around 40 degrees Celsius.
Now that we have the AMD Ryzen VFT-curve basics down, let’s bring Curve Shaper into the discussion.
Curve Shaper Undervolt
Curve Shaper is the newly announced tool of the Precision Boost Overdrive 2 toolkit. It was introduced alongside the Zen 5 Ryzen 9000 “Granite Ridge” processors. Let’s have a look at the feature in the BIOS.
Curve Shaper in Theory
In theory, it seems Curve Shaper is pretty straightforward: you get fifteen additional tunable points across the V/F curve. But the devil is in the details because AMD’s Precision Boost 2 technology doesn’t really work with V/F points. So, instead of getting a list of specific tunable V/F points, we get five regions and three temperatures:
Regions:
- Minimum frequency (“idle”)
- Low frequency (“background tasks”)
- Medium frequency (“high core count workloads”)
- High frequency (“gaming workloads”)
- Max frequency (“1T workloads”)
Temperatures:
- Low temperature (“idle”) = -5°C
- Medium temperature (“1T gaming workloads”) = 50°C
- High temperature (“stress test workloads”) = 90°C
The regions have a bit of a vague terminology and are not clearly defined. I talked at length about these regions in the previous Curve Shaper content piece where I laid out the idea of the Shaper Points.
Curve Shaper in Practice
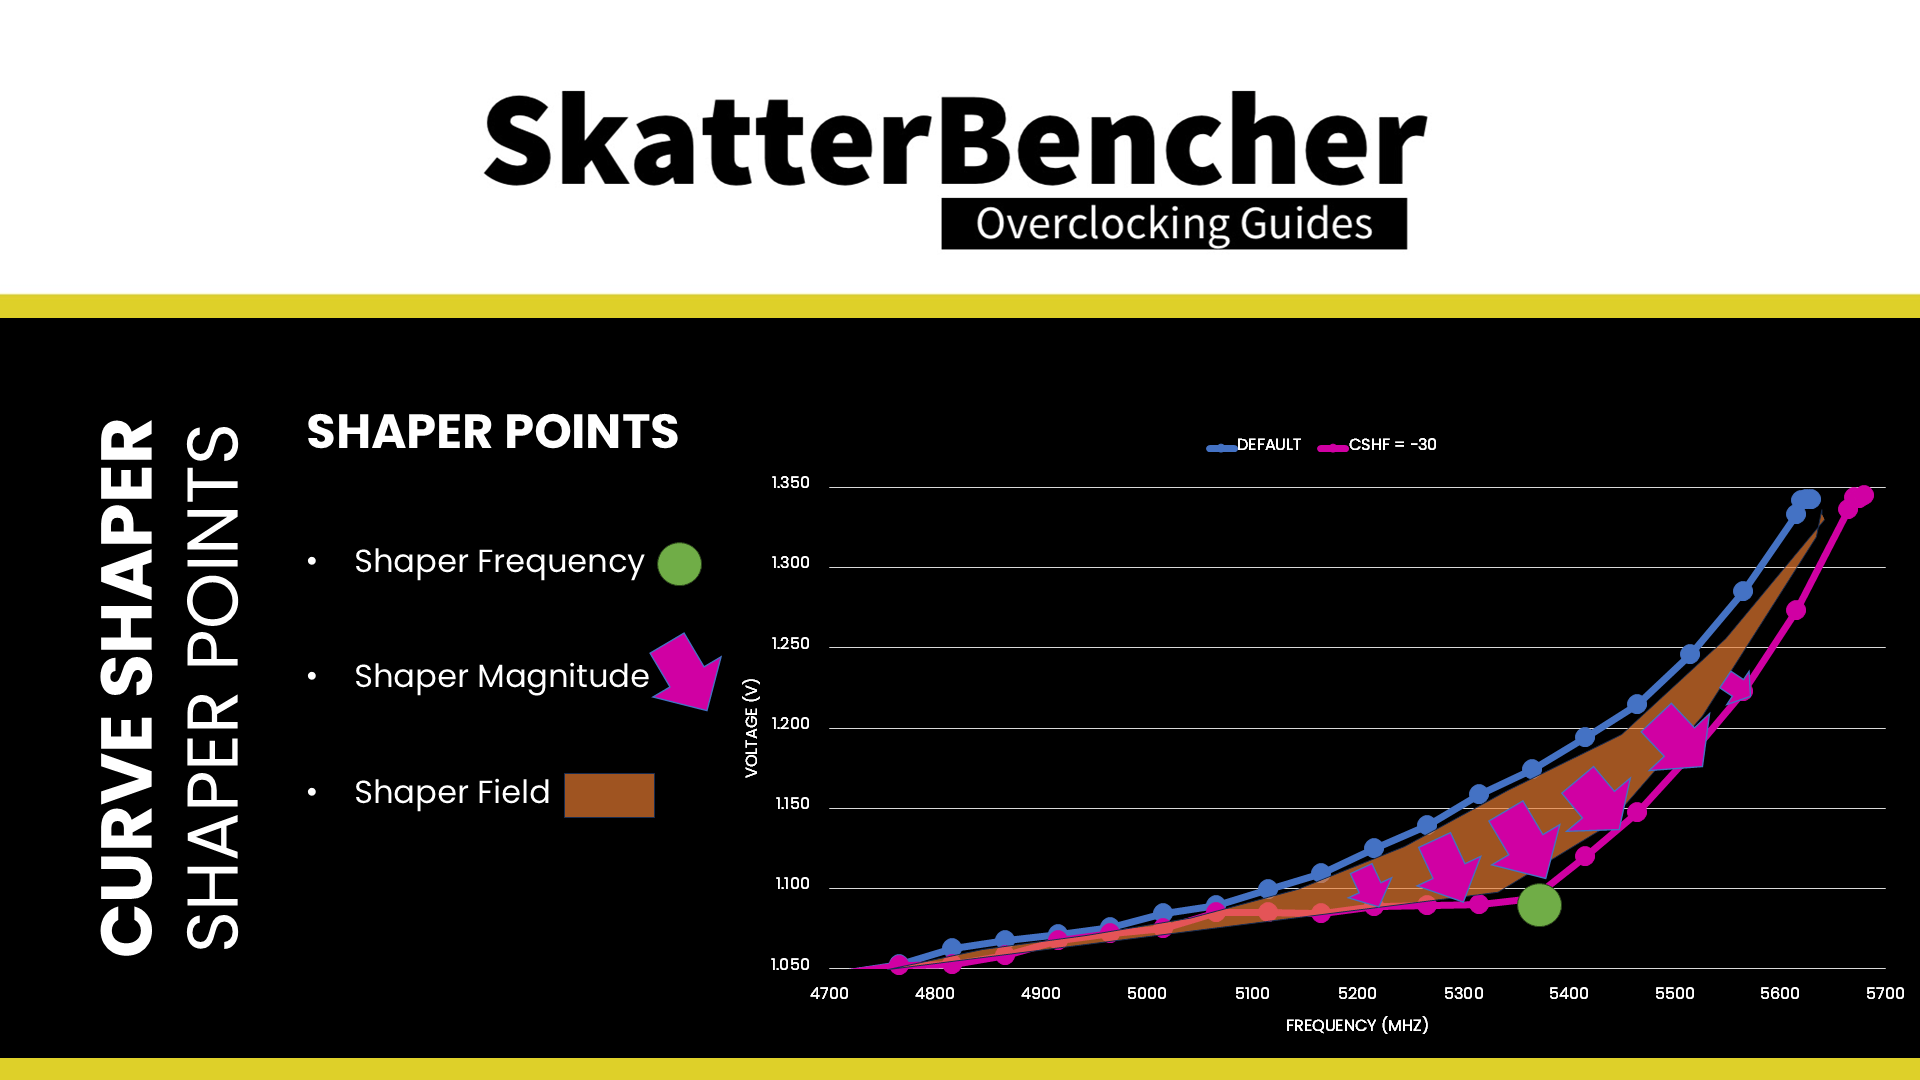
Shaper Points
Each of the regions is defined by what we call “Shaper Points.” A Shaper Point is defined by a Shaper frequency and a Shaper magnitude. The voltage for the frequencies around the Shaper Point behaves like they’re in a “gravitational” Shaper Field in the sense that, for frequencies within the Shaper Field, the closer to the Shaper Point, the larger the impact of the Shaper Magnitude.
The Shaper Points for the Ryzen 9 9950X CCD0, with a Fmax of 5750 MHz, are as follows:
- Min Frequency = 3600 MHz, affecting voltages between ? and 4200 MHz
- Low Frequency = 4200 MHz, affecting voltages between 3600 and 4800 MHz
- Med Frequency = 4800 MHz, affecting voltages between 4200 and 5300 MHz
- High Frequency = 5300 MHz, affecting voltages between 4800 and 5750 MHz
- Max Frequency = 5750 MHz, affecting voltages between 5300 and 5750 MHz
The Shaper Points behave independently, so we can come up with some very wonky V/F curves. For example, by setting the Med Freq point to -30, the High Freq point to 0, and the Max Freq point to +30 we can create a curve that undervolts below and overvolts above 5200 MHz.
In my previous Curve Shaper content, I ignored the temperature dimension of Curve Shaper. Let’s have a look at it today.
Shaper Temperatures
The idea is not that complicated: depending on the operating temperature, each Shaper Point can pull stronger or weaker. So, for example, we could say that we only want to undervolt the CPU when the temperature is really high. Let’s set up a test with CCD0 of the Ryzen 9 9950X. In this test, I configure the High Frequency Shaper Point with varying temperature configurations:
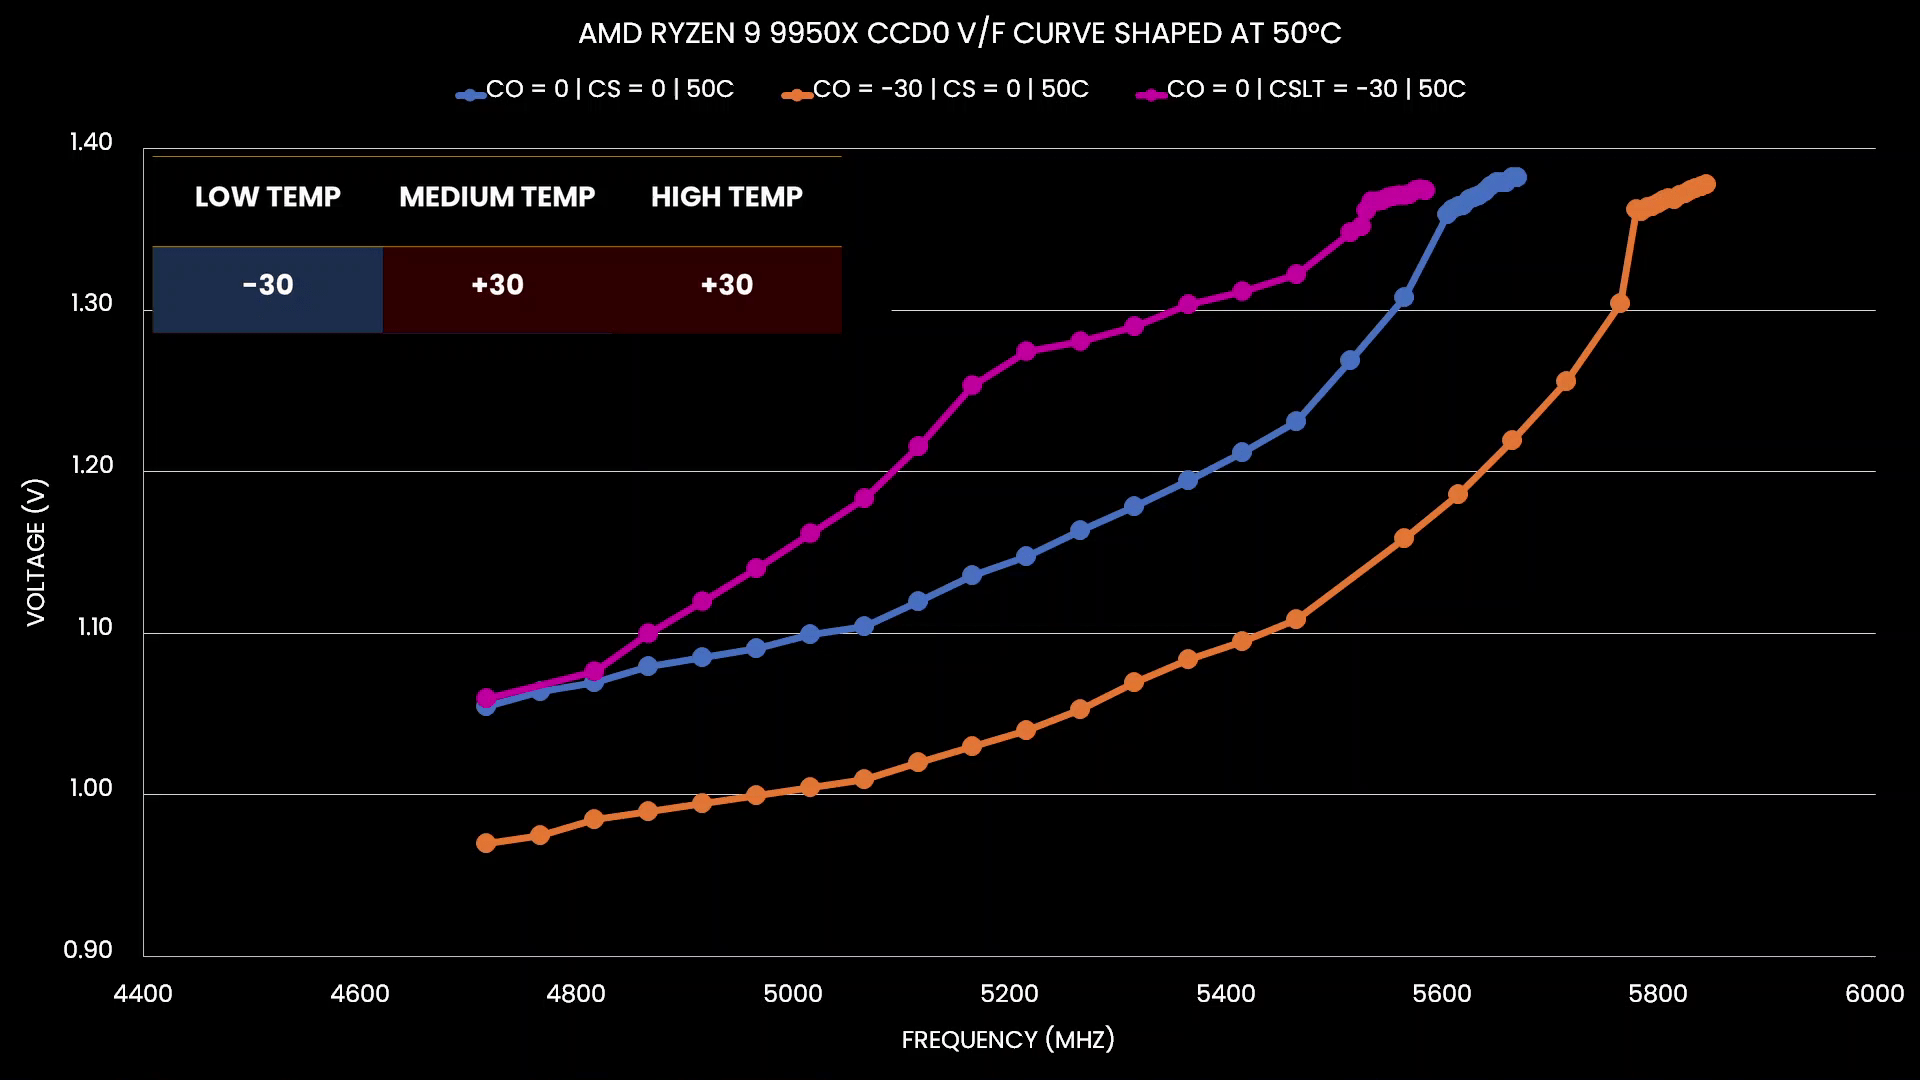
- Test 1: Low Temperature = -30, Medium/High Temperature = +30
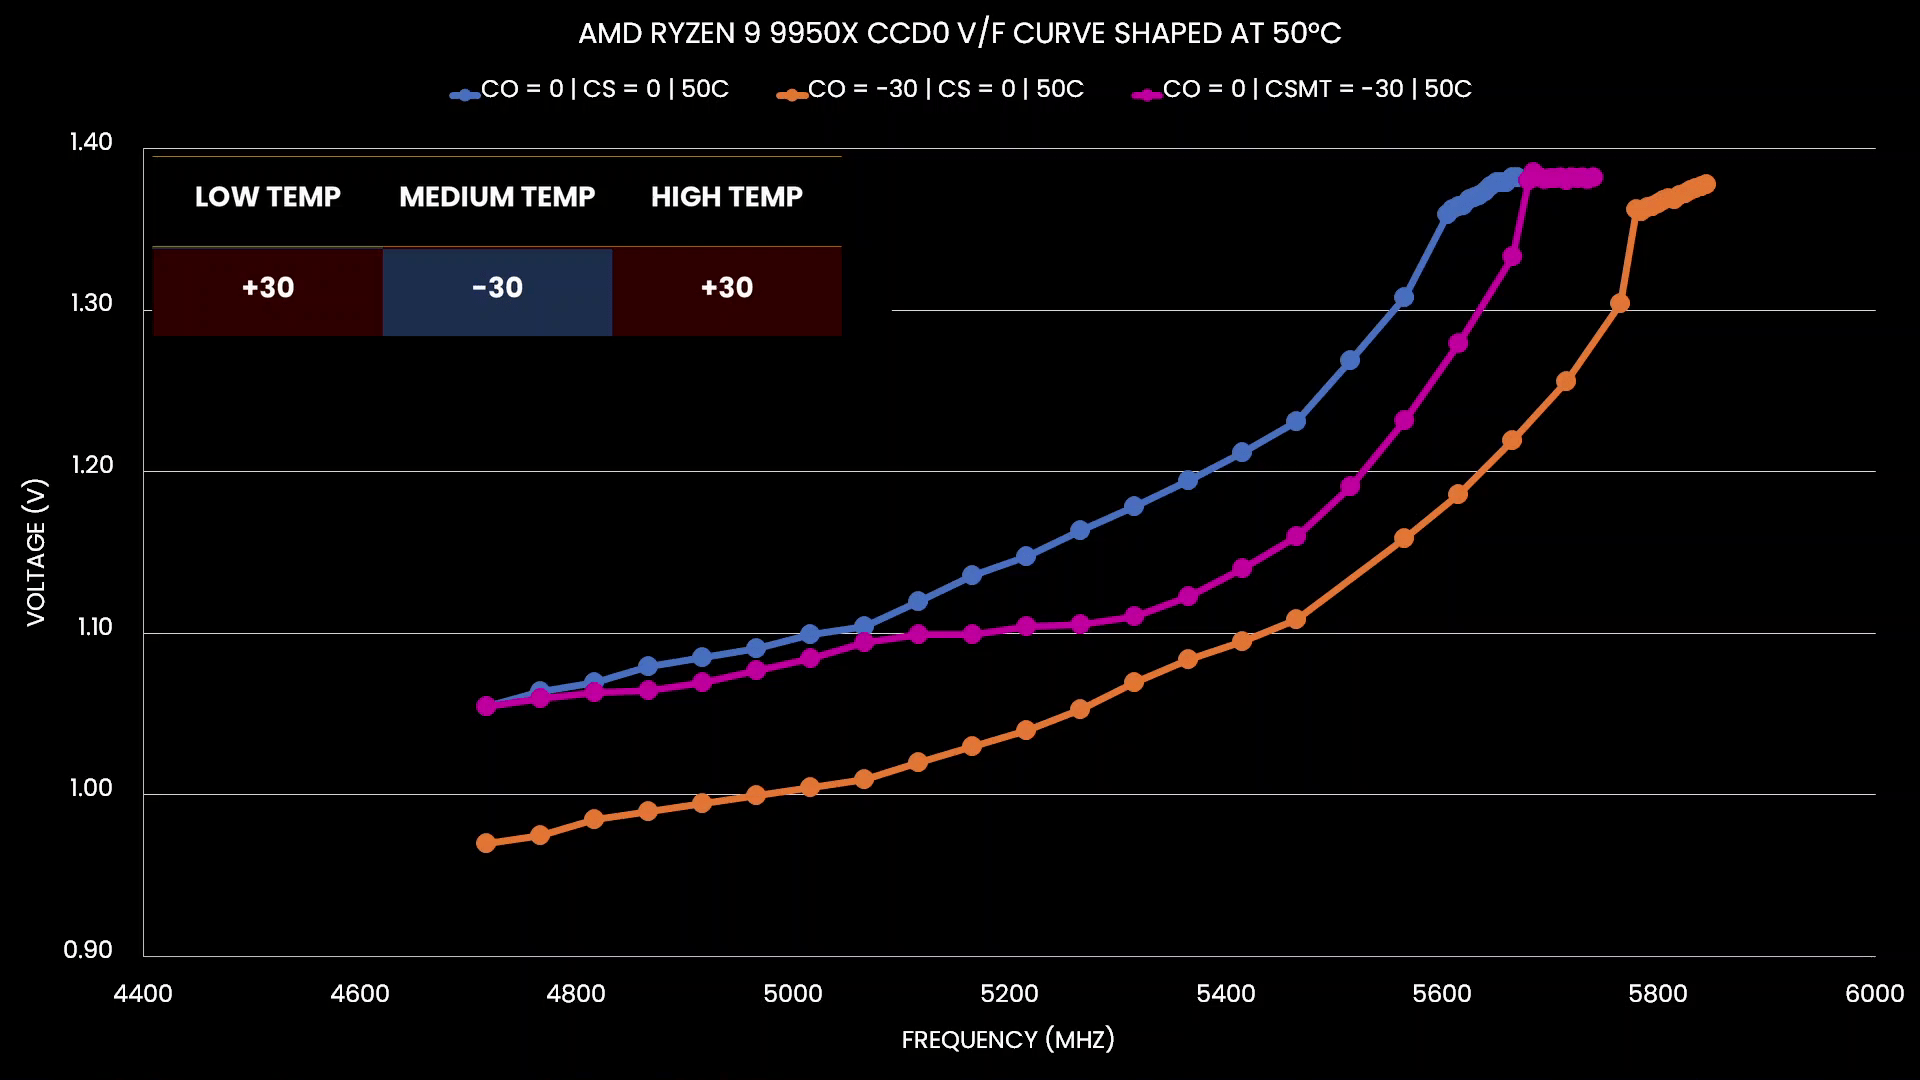
- Test 2: Medium Temperature = -30, Low/High Temperature = +30
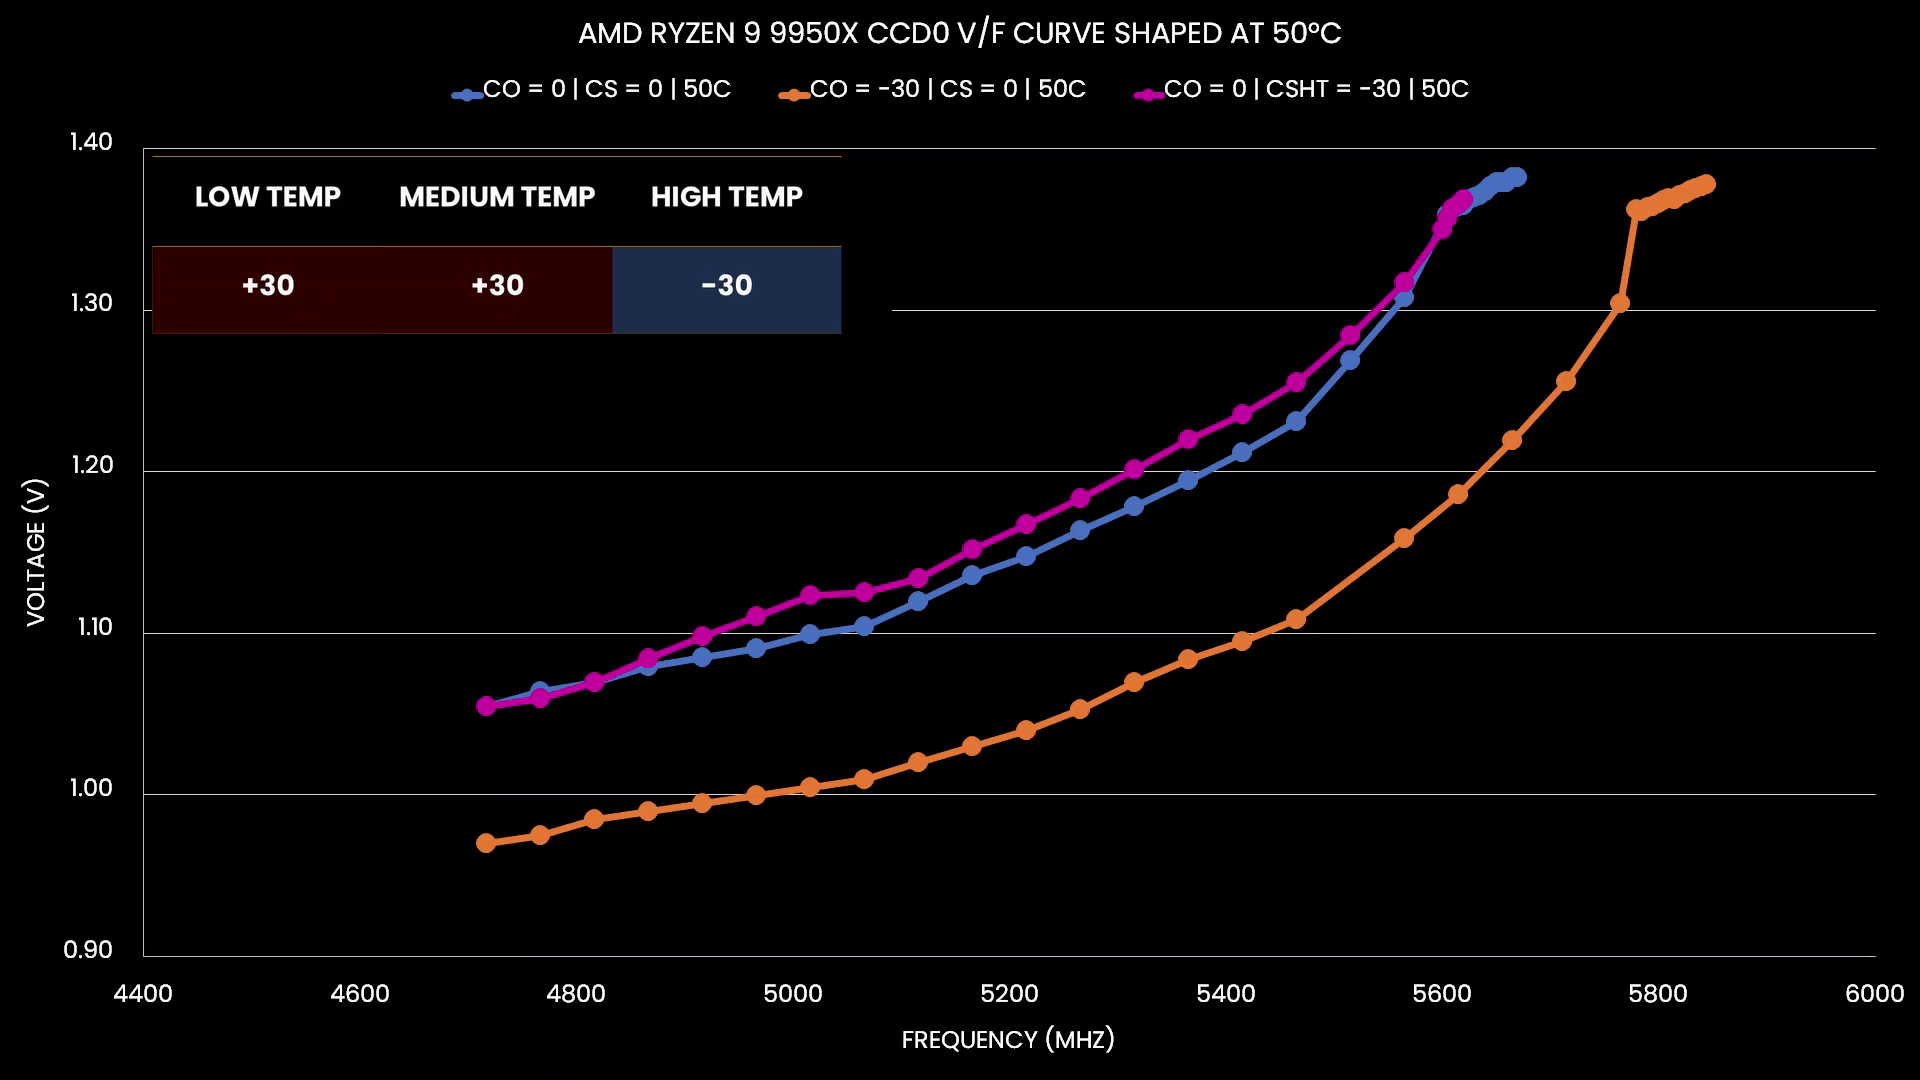
- Test 3: High Temperature = -30, Low/Medium Temperature = +30
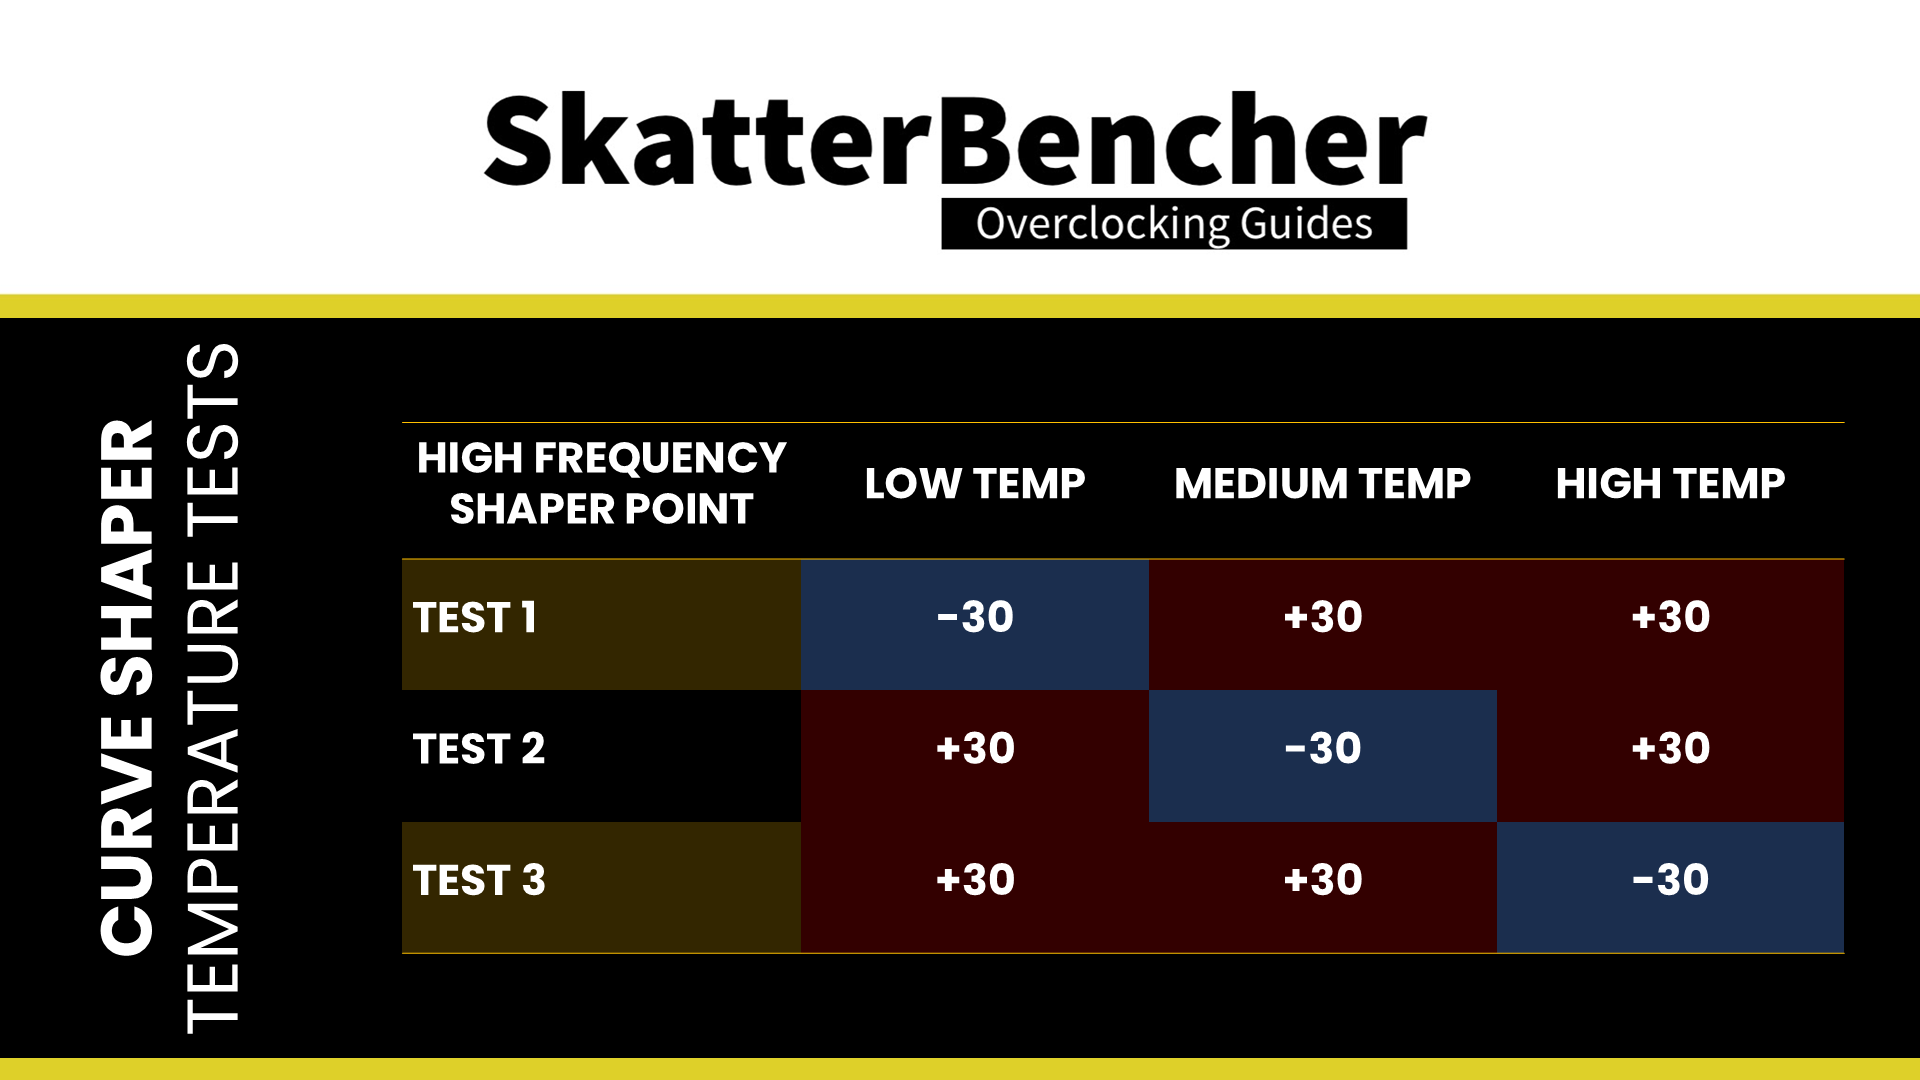
In Test 1, we undervolt at low temperatures and overvolt at medium and high temperatures. In Test 2, we undervolt at medium temperatures and overvolt at low and high temperatures. In Test 3, we undervolt at high temperatures and overvolt at low and medium temperatures.
Now, let’s look at the behavior of the V/F curve at 50 degrees Celsius. We start with two curves: the default curve and the curve with a -30 Curve Optimizer.
Now, let’s undervolt at a low temperature and overvolt at medium and high temperatures. We find that our V/F curve at 50 degrees Celsius overvolts significantly. That makes sense because we configured the High Frequency Shaper Point to significantly overvolt medium and high temperatures with their +30 magnitude.
Now, let’s undervolt at high temperatures and overvolt at low and medium temperatures. We find that our V/F curve at 50 degrees Celsius overvolts marginally compared to the default curve. That makes sense because we configured the Shaper Point to significantly overvolt low and medium temperatures with their +30 magnitude.
Now, let’s undervolt at medium temperature and overvolt at low and high temperatures. Now we find that our Curve Shaper configuration finally undervolts the curve! That makes sense because we have set an aggressive undervolt for medium temperatures like 50 degrees Celsius.
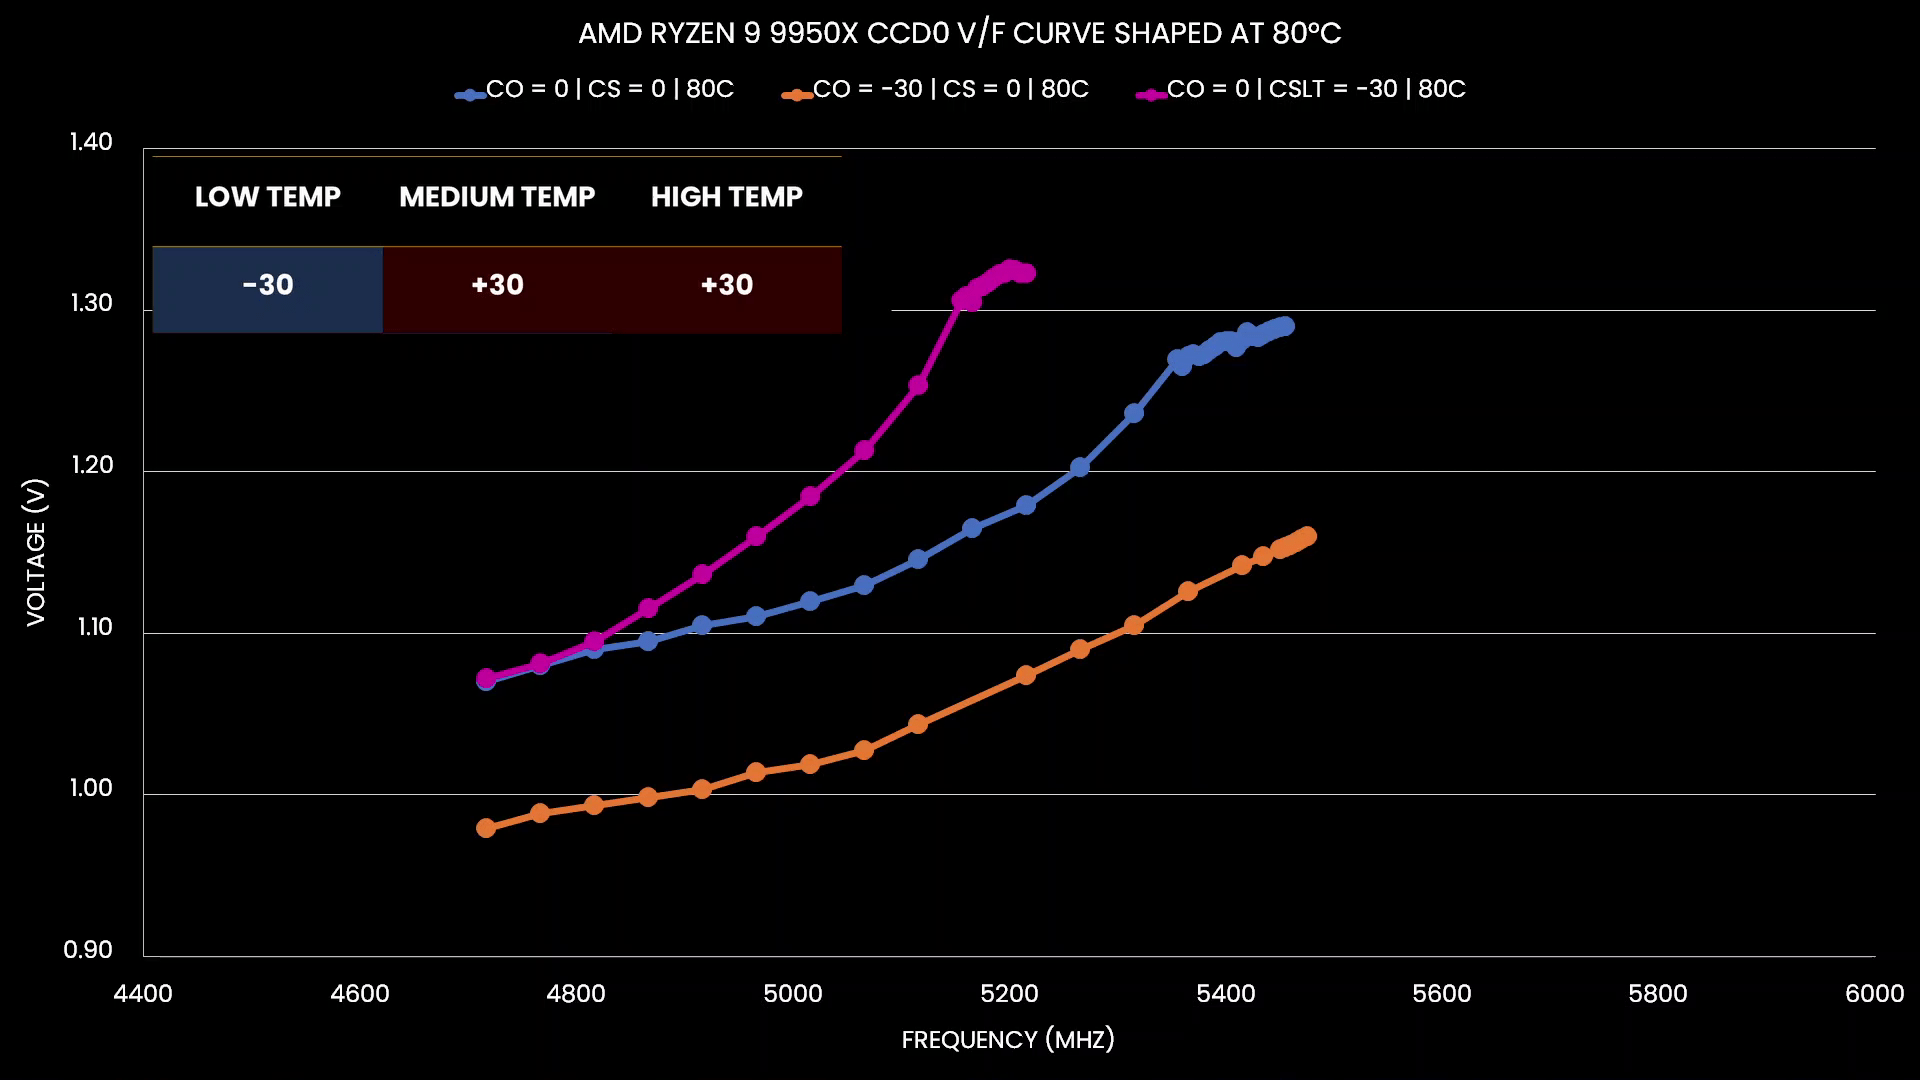
Let’s try this again but at 80 degrees Celsius. Again, we start with two curves: the default curve and the curve with a -30 Curve Optimizer.
First, let’s undervolt at low temperatures and overvolt at medium and high temperatures.We find that, indeed, the curve is significantly overvolted. That makes sense, because both the medium and high temperature range of the High Frequency shaper point is configured to overvolt, and 80 degrees Celsius is as high a temperature as you can get.
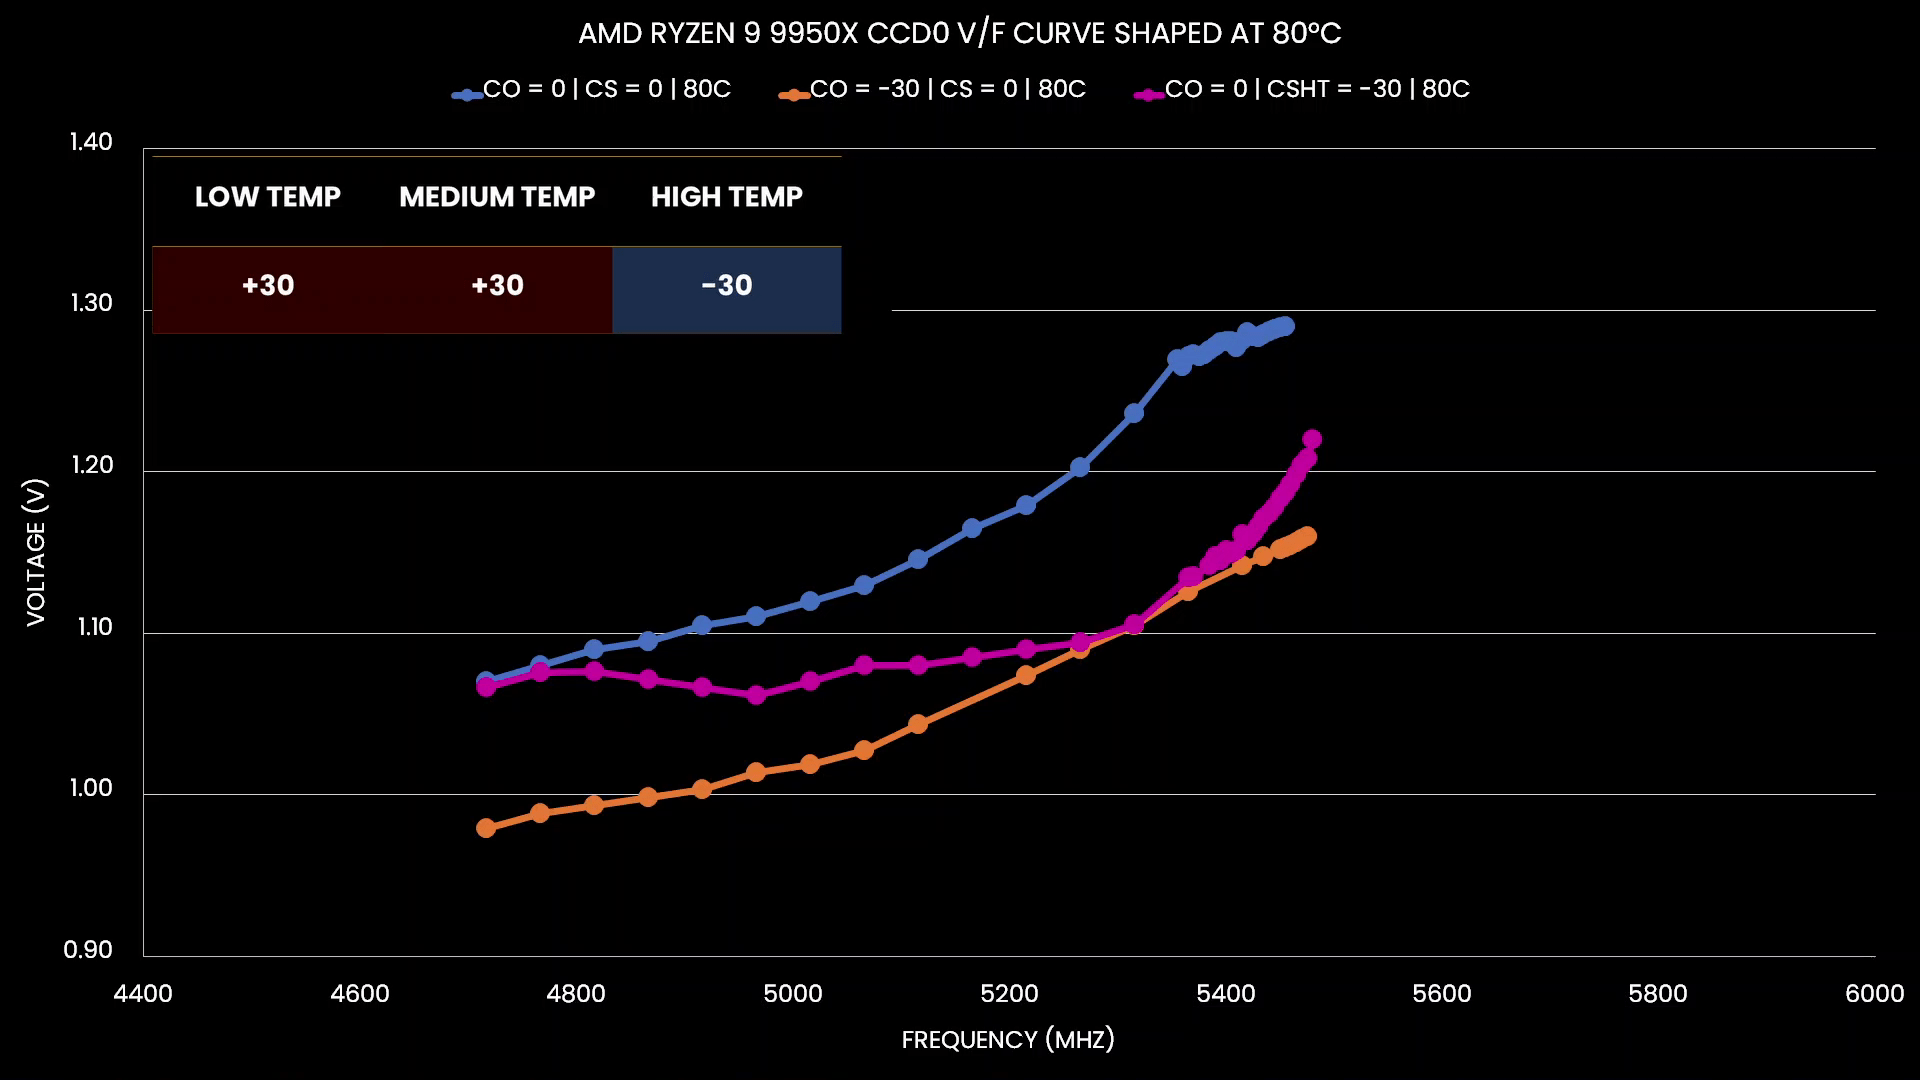
Now let’s do the opposite and undervolt at high temperatures and overvolt at low and medium temperatures. Now, we find the complete opposite is happening! Our V/F curve at 80 degrees Celsius is massively undervolted and at 5300 MHz it even matches the undervolt we Curve Optimizer.
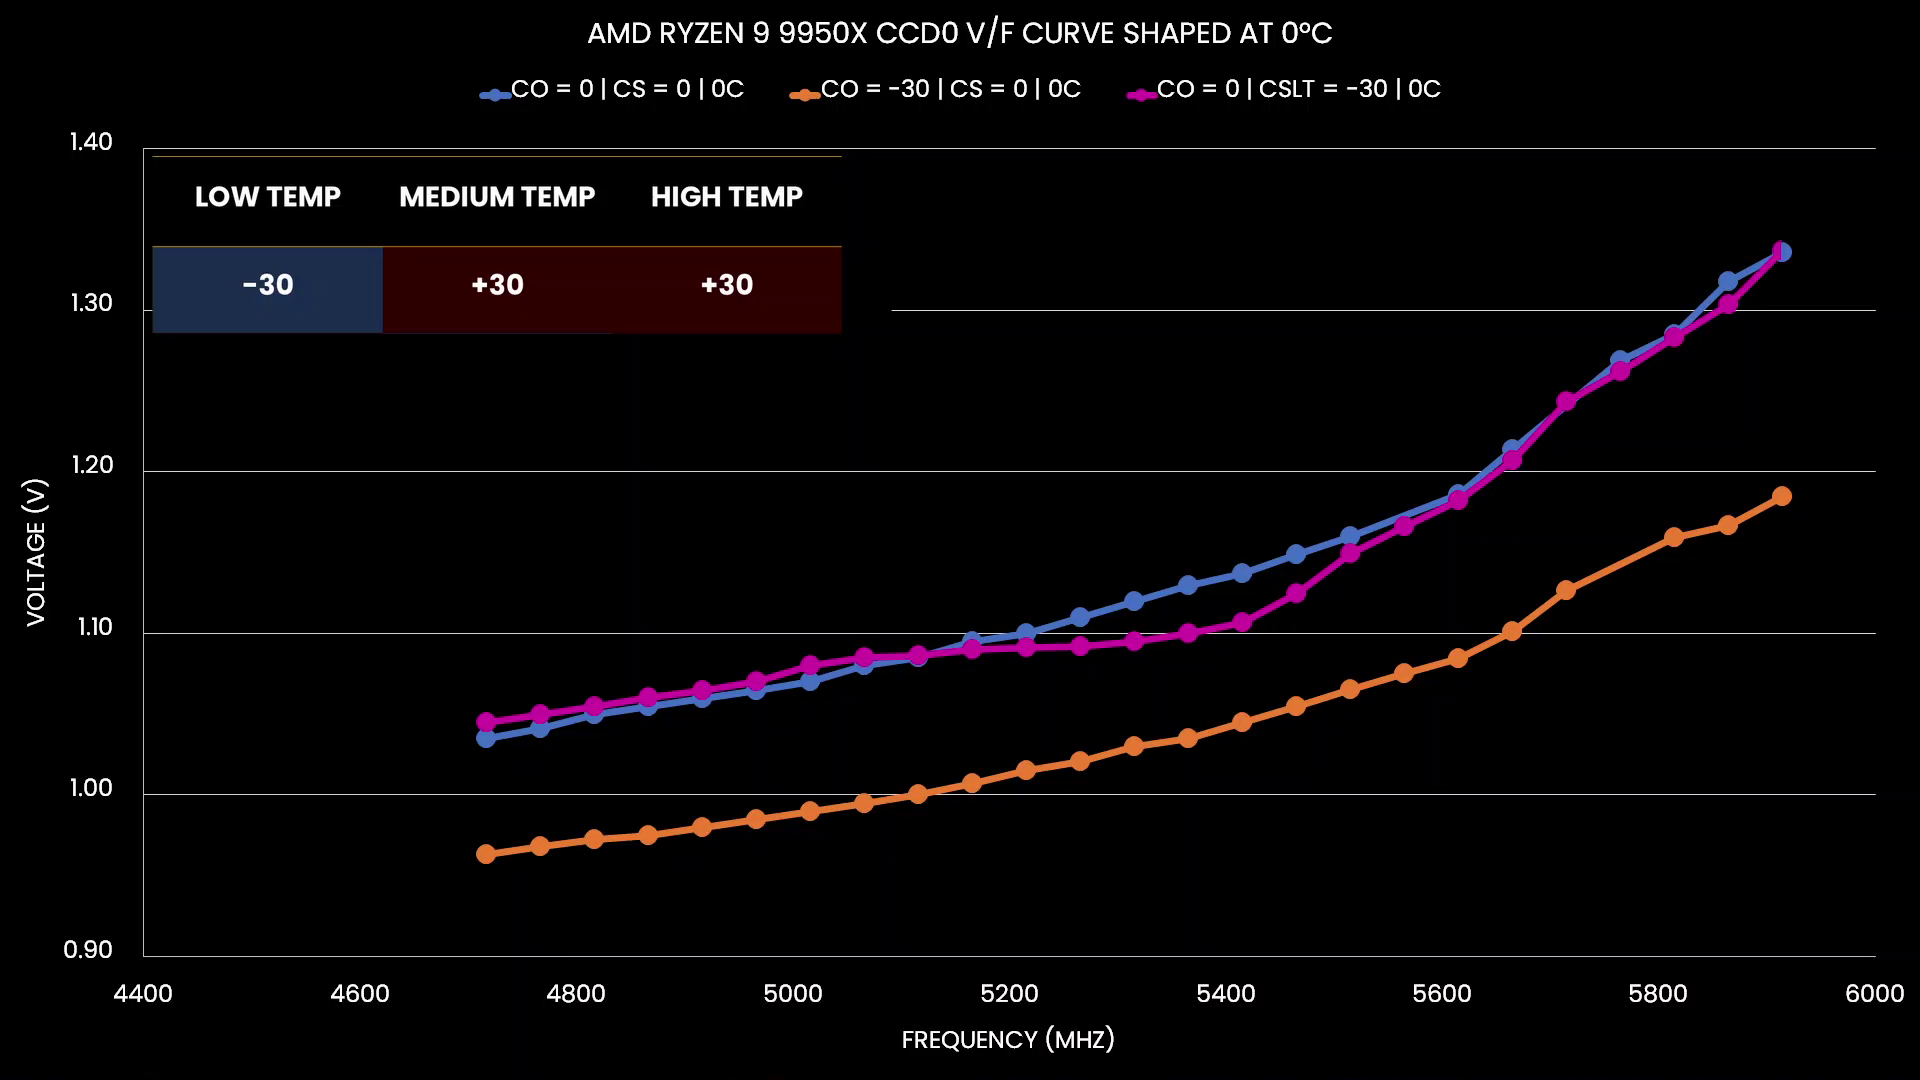
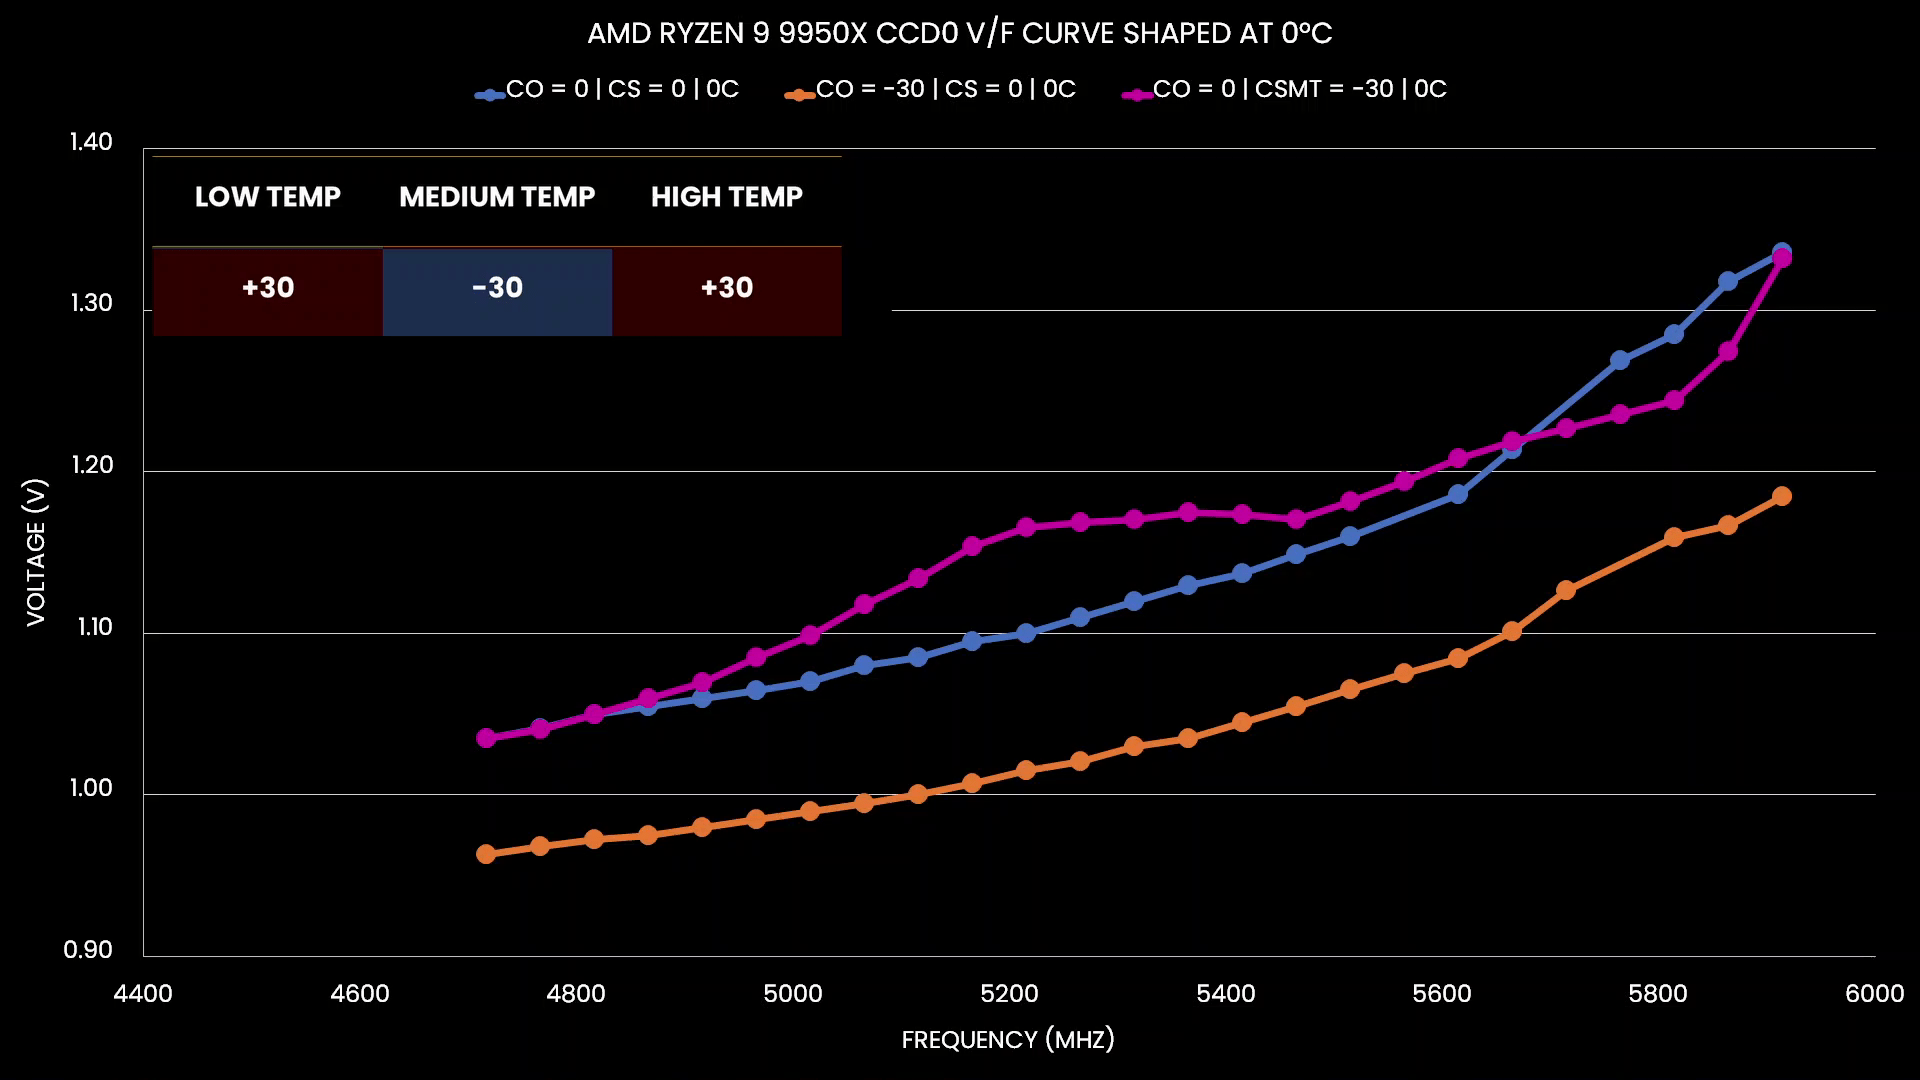
To round up our testing, let’s do the same for the curve at 0 degrees Celsius. We find that when we undervolt at low temperatures, we indeed see a slight undervolt for the 0-degree curve. When we undervolt at medium temperatures and overvolt and low and high temperatures, we find that our 0-degree curve indeed slightly overvolts.
Granite Ridge Undervolt Conclusion
This was again a very data and chart-heavy piece, just like my previous Curve Shaper content. If this is all a bit overwhelming, here are the three key things I want you to take away from this video.
- I showed that the Precision Boost technology has an important temperature dimension to it. By lowering the operating temperature, you effectively undervolt the CPU cores. That can create substantial headroom for boosting to higher frequencies, especially at the upper end of the V/F curve.
- Undervolting by lowering the temperature and undervolting with the Curve Optimizer and Curve Shaper tools work in tandem. In other words, you lower the voltage with a lower temperature, and you can further lower the voltage with Curve Optimizer or Curve Shaper.
- Curve Shaper provides us with much more precise tools to finetune the V/F curve than Curve Optimizer as it enables us to adjust the undervolt for specific temperature ranges.
How this works in a practical overclock, I’ll show in a future video with the Ryzen 7 9700X. So, stay tuned for that. I’d like to thank you for reading and my Patreon supporters for supporting my work. As usual, if you have any questions or comments, feel free to drop them in the comment section below.
See you next time!