Upgrading to BENCHLAB 2

I recently swapped out the BENCHLAB 1 on my Arrow Lake Core Ultra 7 270K test system for the new BENCHLAB 2.
Disclaimer: I’m part of the Open Benchtable team, which also makes me part of the BENCHLAB team. So, effectively I swapped my own BENCHLAB 1 for my own BENCHLAB 2. But I figured it was a good opportunity to show what my current test bench looks like and how I use it.
The BENCHLAB 2 PCB
We kept the original branding, so BENCHLAB 2 still sits under the BENCHLAB brand. The easiest way to tell the BL1 and BL2 apart is the small cutout for the USB Type-C connector in the upper left corner. On the back of the PCB you’ll also find the marking “benchlab2-01”, meaning this is the first PCB revision of the BENCHLAB 2.
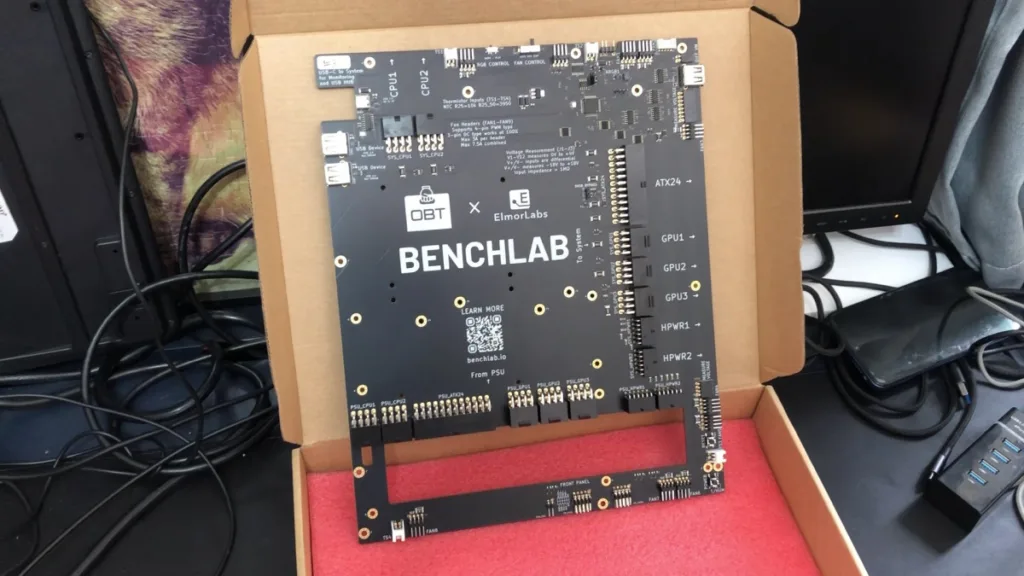
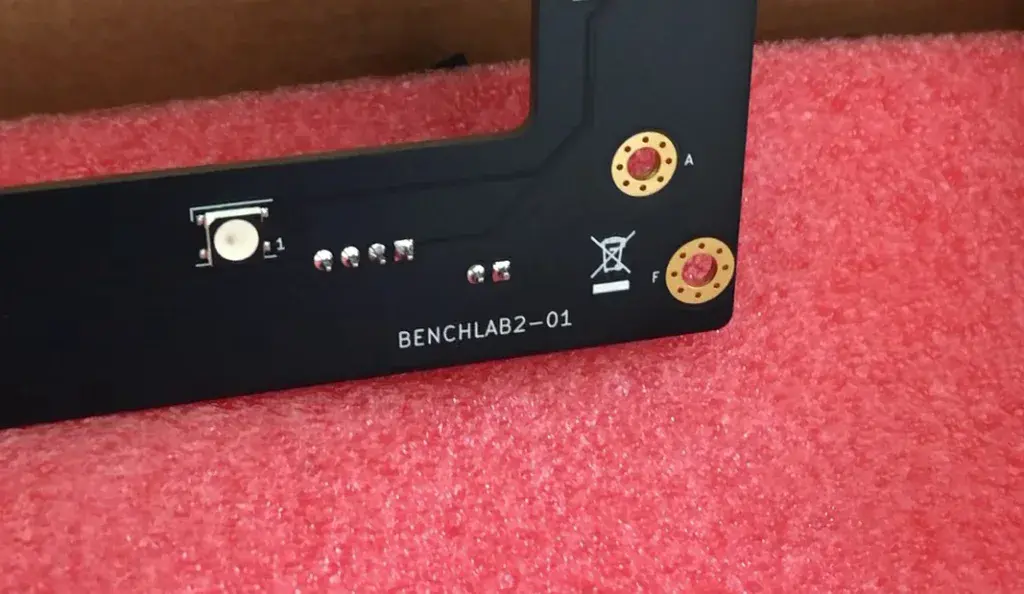
The board is pretty similar to the BENCHLAB 1, but a few changes are worth highlighting.
- Per-pin monitoring on the 12VHPWR connectors. This is the biggest hardware change. Both 12VHPWR now measure current and voltage per pin, so you can check the balance across the pins and spot an imbalance right away.
- Standard front panel layout for the power and reset buttons. The onboard power and reset buttons now follow the standard front panel (F_PANEL) pinout. You can connect the board to your motherboard’s front panel header, and if you mount it in a Corsair FRAME case, you can pass the front panel connections through to the case.
- Higher layer count. We increased the PCB layer count, although you can’t see that by looking at the board, but it helps improve some of the voltage rails.
Software: The Bigger Upgrade
I’d say the biggest difference between the original and BENCHLAB 2 is on the software side. We revamped the Windows Dashboard software, improved support for Linux and Python users, and put some work into widgets for those who want to mount it in a Corsair FRAME case and pair it with a Xeneon Edge display.
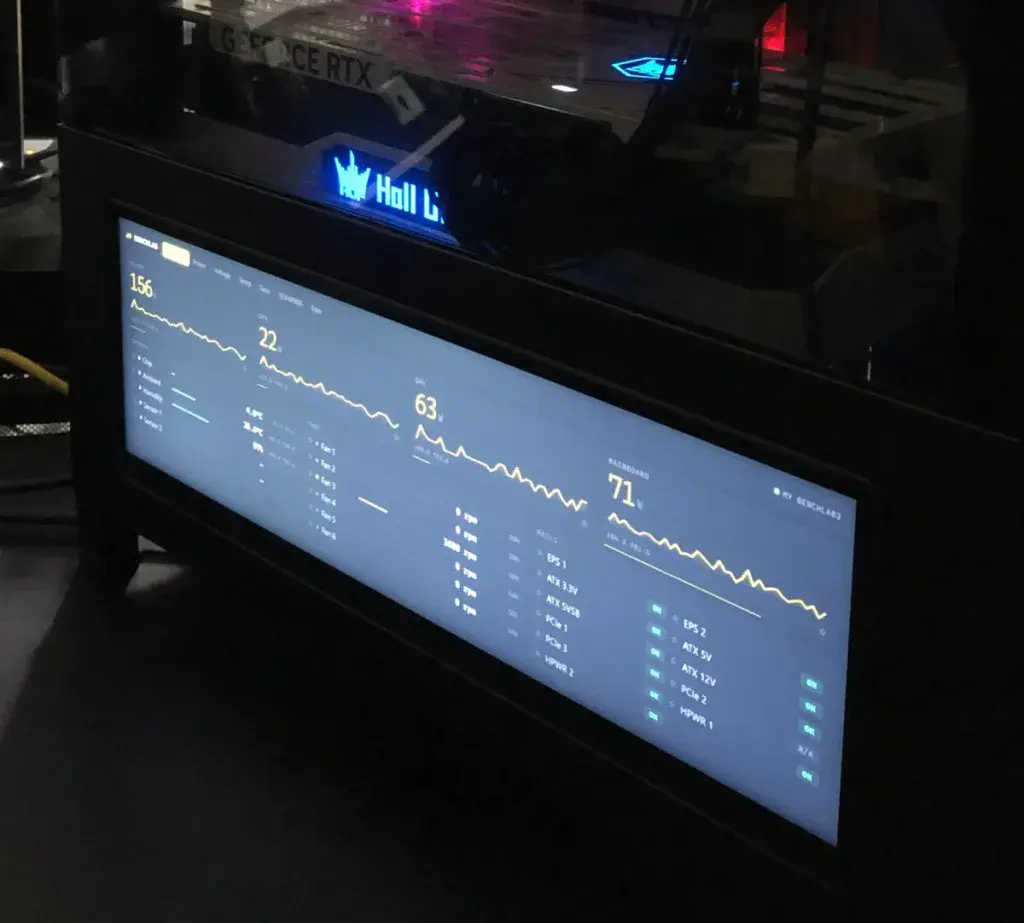
The Windows Dashboard
The main overview still shows all the telemetry you’re used to, just in a fancier package.
The most interesting view for most users is probably the 12VHPWR overview. Here you can see whether there is an imbalance across the pins of a connected. I fired up FurMark to put some load on the graphics card, and you can see that the dashboard doesn’t just measure each pin, it also flags an imbalance (and on one of my cables there is!).
Each 12VHPWR connector also has a temperature-in and temperature-out reading. Temperature-in is the power coming from the power supply into the BENCHLAB, and temperature-out is from the BENCHLAB to the graphics card.
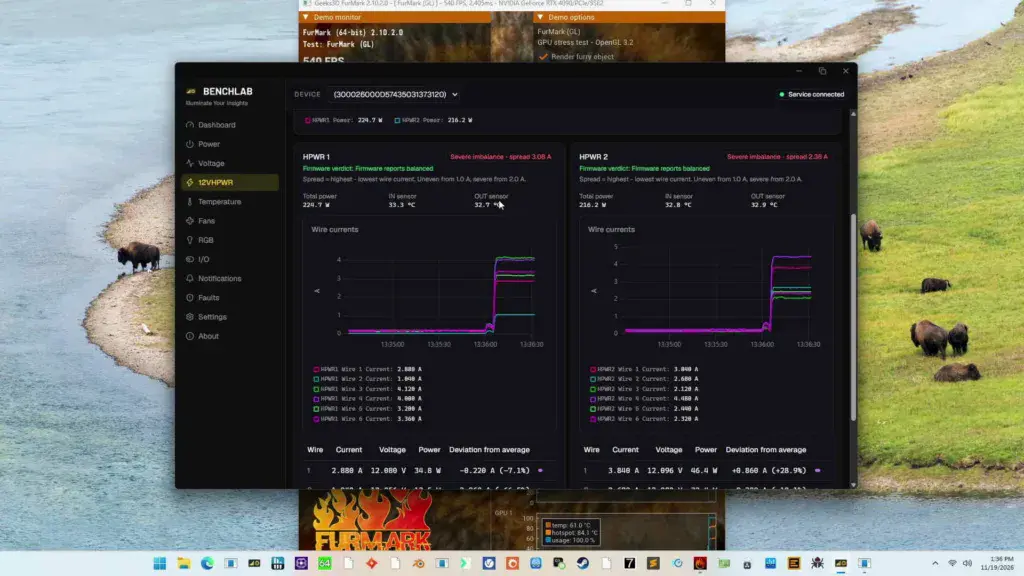
Temperature monitoring is otherwise unchanged: we still have four temperature sensors, plus ambient temperature and humidity. The new additions are the 12V high-power sensors mentioned above.
The New Fault System
Another important addition is a fault/protection system. Over-temperature (OTP) and over-current (OCP) events can now trigger a response: red LEDs light up, a rather loud buzzer sounds, and if you don’t deal with the problem quickly enough, the system shuts off.
The main reason we implemented this is that the BENCHLAB 2 can be mounted inside a case, the Corsair FRAME, and we wanted to protect the board if something goes wrong. The 12VHPWR are obviously a big part of that concern.
For Developers: Python and Linux
We also put a lot of effort into enabling developers. Everything is available on GitHub, and the Python tools are on PyPI, so they’re easy to install.
- benchlab-pycore is the library for talking to the BENCHLAB in Python.
- benchlab-pytools is a collection of ready-made utilities, so you can talk to the BENCHLAB using Python without doing any coding or integration yourself. It covers configuration, firmware flashing, logging to CSV, and graphing.
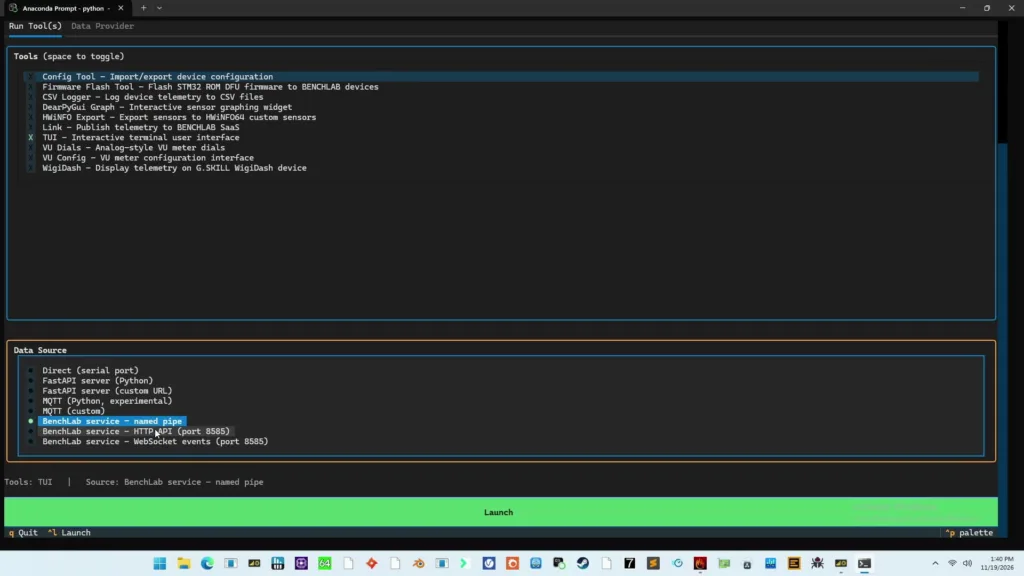
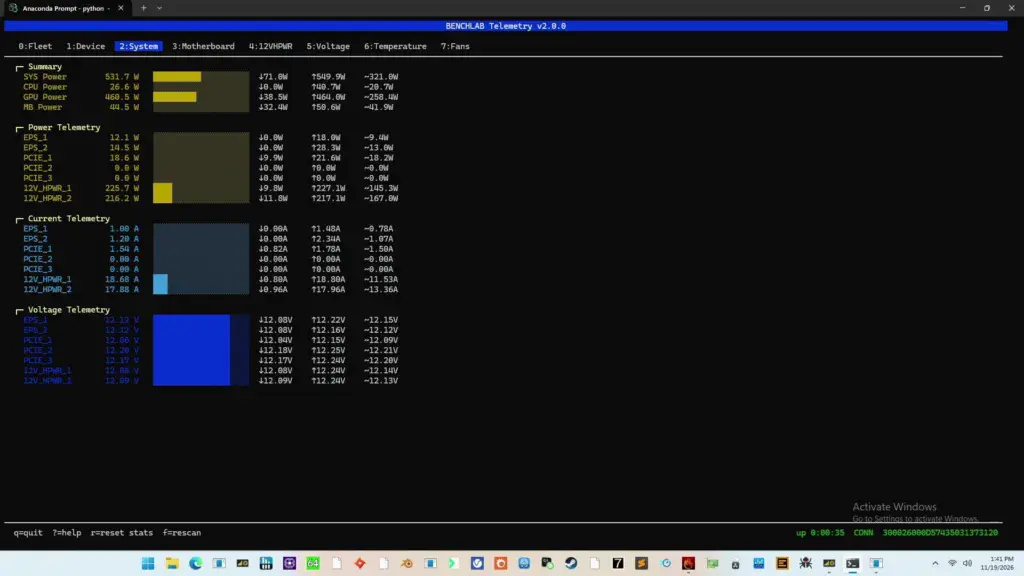
I use the TUI (text user interface) a lot, mainly to quickly check that readings are correct. The TUI supports several data sources. “Direct” gives the TUI direct access to the device, but that won’t work while the Dashboard is running, because the Dashboard relies on a service that owns the COM port. For that case, you can connect through the named pipe, which is the Windows service.
In my setup, the BenchLab 2 shows up on COM5 running firmware version 8, and I see the same telemetry as in the Dashboard.
Bonus: CTRL1 Header and Wi-Fi Telemetry
I missed this in the PCB overview, but it’s a cool little feature. The Control 1 header is present on both BENCHLABs. It was originally intended for a device we ended up not making, but it gives you I2C access to the board’s microcontroller. In theory, that means you can read the same values over I2C that you see in the Dashboard.
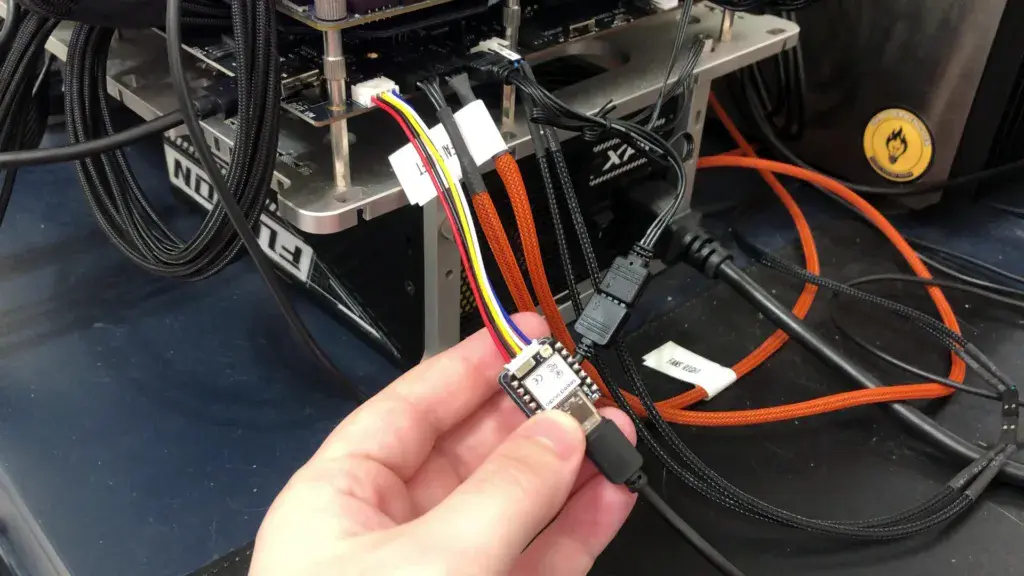
I attached a Seeed Studio XIAO ESP32C6 module with Wi-Fi and Bluetooth, mounted on a small controller board made by ElmorLabs (called “benchlab-ctrl-xiao-01”). This lets me broadcast the data over Wi-Fi. I wrote a small app that lets me access the data on a page hosted on the ESP32 via my local network. I can see everything the BENCHLAB is reporting on my phone, including that. really nasty-looking wire on one of the 12V high-power pins.
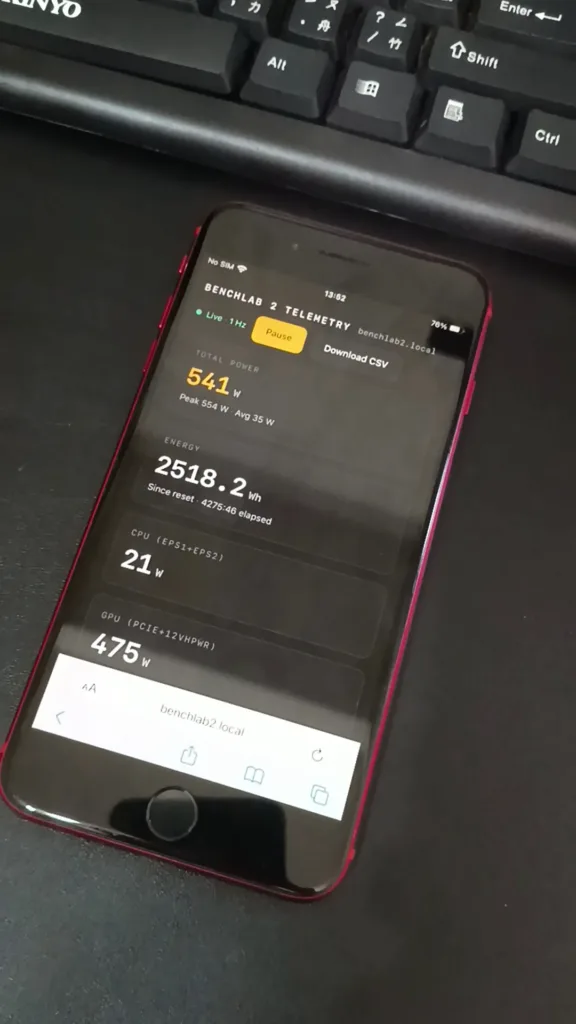
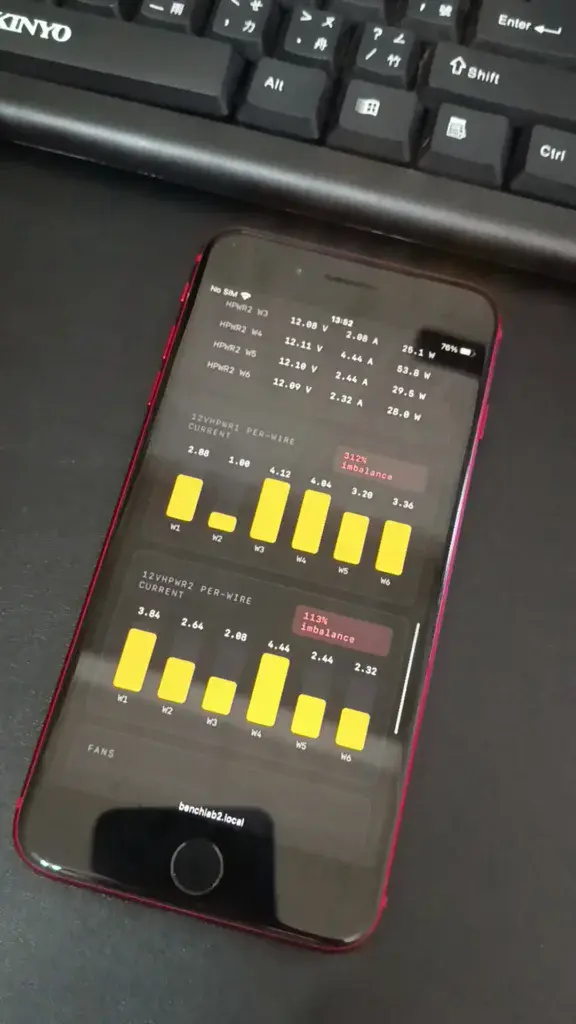
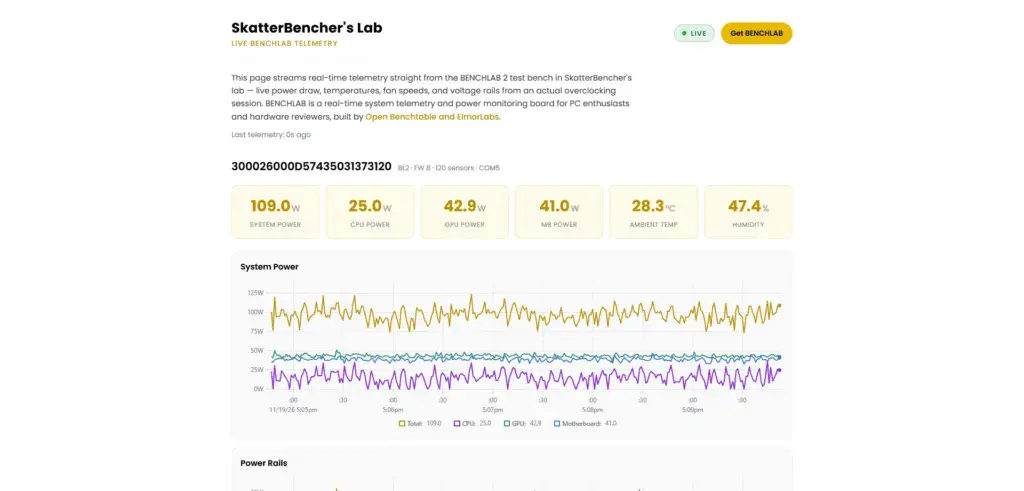
Once the telemetry is on your local network, you can also build widgets for your blog. I did exactly that: a little button on my site shows whether the lab is running. Start a test, and the page immediately reflects the load.
Maybe in the future you’ll be able to guess whether I’m running an unreleased CPU or GPU from the power numbers.
Wrapping Up
That’s a quick look at the upgrades to my test bench. I promise I’ll get back to making overclocking guides as soon as Intel and AMD start launching their new CPUs. That won’t happen before the end of the year, but I’ll come back hard in 2027.