SkatterBencher #54: AMD Ryzen 9 7900 Overclocked to 5616 MHz

We overclock the AMD Ryzen 9 7900 up to 5600 MHz with the GIGABYTE B650E Aorus Tachyon motherboard and EK-Quantum water cooling.
I will go over a variety of overclocking strategies starting from the most basic and ending with the most advanced tuning approach.
Alright, we have lots to cover, so let’s jump straight in.
AMD Ryzen 9 7900: Introduction
The AMD Ryzen 9 7900 processor is part of the Ryzen 7000 Zen 4 AM5 desktop product line-up.
The Zen 4 desktop CPUs codenamed Raphael launched on August 29, 2022, during an AMD Livestream. At launch, there were 4 SKUs available, all X processors. On January 14, 2023, following the CES announcement earlier that month, AMD launched three additional Zen 4 desktop non-X processors: the Ryzen 9 7900, Ryzen 7 7700, and Ryzen 5 7600.
Zen 4 Raphael is very similar to Zen 3 Vermeer, but there are some noteworthy differences. Most importantly, Raphael requires the new AM5 socket and supports DDR5 memory. The CCDs, featuring the Zen 4 CPU cores, is AMD’s first chip using TSMC N5 manufacturing technology. Raphael also introduces AVX-512 support and operates at significantly higher clock frequencies. The main difference between the X and non-X variants is the reduced TDP and lower base and boost clocks.
The Ryzen 9 7900 we’re overclocking today has twelve cores with 24 threads, a base frequency of 3.7 GHz, and a maximum listed boost frequency of 5.4 GHz. The TDP is 65W, and PPT is 88W.

In this guide, we will cover five overclocking strategies:
- First, we simply rely on AMD PBO and EXPO performance boost technologies
- Second, we rely on GIGABYTE’s Performance Bung technology
- Third, we tune Precision Boost Overdrive with Curve Optimizer
- Fourth, we tune Precision Boost Overdrive with asynchronous eCLK
- Lastly, we try to do a manual overclock

However, before we jump into overclocking, let us quickly review the hardware and benchmarks used in this guide.
AMD Ryzen 9 7900: Platform Overview
The system we’re overclocking today consists of the following hardware.
| Item | SKU | Price (USD) |
| CPU | AMD Ryzen 9 7900 | 450 |
| Motherboard | GIGABYTE B650E Aorus Tachyon | 599 |
| CPU Cooling | EK-Quantum Velocity2 EK-Quantum Power Kit Velocity² 360 | 137 686 |
| Fan Controller | ElmorLabs Easy Fan Controller ElmorLabs EVC2SX | 20 32 |
| Memory | G.SKILL Trident Z5 DDR5-6400 | 370 |
| Power Supply | Enermax MAXREVO 1500W | 370 |
| Graphics Card | ASUS ROG Strix RTX 2080 TI | 880 |
| Storage | AORUS RGB 512 GB M.2-2280 NVME | 120 |
| Chassis | Open Benchtable V2 | 200 |
ElmorLabs EFC & EVC2
I explained how I use ElmorLabs products in SkatterBencher #34. By connecting the EFC to the EVC2 device, I monitor the ambient temperature (EFC), water temperature (EFC), and fan duty cycle (EFC). I include the measurements in my Prime95 stability test results.
I also use the ElmorLabs EFC to map the radiator fan curve to the water temperature. Without going into too many details: I have attached an external temperature sensor from the water in the loop to the EFC. Then, I use the low/high setting to map the fan curve from 25 to 40 degrees water temperature. I use this configuration for all overclocking strategies.
The main takeaway from this configuration is that it gives us a good indicator of whether the cooling solution is saturated.

GIGABYTE B650E Aorus Tachyon
The B650E Aorus Tachyon motherboard is the 4th generation Tachyon. The Tachyon series are the spiritual successor of the GIGABYTE OC and SOC motherboards and first came to market with Z590 and Rocket Lake. In fact, I used the Z590 Aorus Tachyon to overclock the Core i9-11900K in SkatterBencher #21.
- Z590 Aorus Tachyon https://www.gigabyte.com/Motherboard/Z590-AORUS-TACHYON-rev-10#kf
- Z690 Aorus Tachyon https://www.gigabyte.com/Motherboard/Z690-AORUS-TACHYON-rev-10#kf
- Z790 Aorus Tachyon https://www.gigabyte.com/tw/Motherboard/Z790-AORUS-TACHYON-rev-10#kf
- B650E Aorus Tachyon https://www.gigabyte.com/Motherboard/B650E-AORUS-TACHYON-rev-10#kf

The B650E Aorus Tachyon is GIGABYTE’s first AMD Tachyon motherboard. It features the typical 2-DIMM memory layout and many of the overclocking-focused features you’d expect from an overclocking motherboard. The features include LIMP Mode, CPU Ratio Switch, OC Trigger Switch, and voltage measurement points.


If you want to learn more, I suggest you check the GIGABYTE product page.
AMD Ryzen 9 7900: Benchmark Software
We use Windows 11 and the following benchmark applications to measure performance and ensure system stability.
| BENCHMARK | LINK |
| SuperPI 4M | https://www.techpowerup.com/download/super-pi/ |
| Geekbench 5 | https://www.geekbench.com/ |
| Cinebench R23 | https://www.maxon.net/en/cinebench/ |
| CPU-Z | https://www.cpuid.com/softwares/cpu-z.html |
| V-Ray 5 | https://www.chaosgroup.com/vray/benchmark |
| AI-Benchmark | https://ai-benchmark.com/ |
| 3DMark CPU Profile | https://www.3dmark.com/ |
| 3DMark Night Raid | https://www.3dmark.com/ |
| CS:GO FPS Bench | https://steamcommunity.com/sharedfiles/filedetails/?id=500334237 |
| Shadow of the Tomb Raider | https://store.steampowered.com/app/750920/Shadow_of_the_Tomb_Raider_Definitive_Edition/ |
| Final Fantasy XV | http://benchmark.finalfantasyxv.com/na/ |
| Prime 95 | https://www.mersenne.org/download/ |
AMD Ryzen 9 7900: Stock Performance
Before starting overclocking, we must check the system performance at default settings. Note that on this motherboard, Precision Boost Overdrive is enabled by default.
So, to check the performance at default settings, you must enter the BIOS and
- Switch to Advanced Mode
- Enter the Advanced CPU Settings submenu
- Enter the Precision Boost Overdrive submenu
- Set Precision Boost Overdrive to Disabled
- Enter the Precision Boost Overdrive submenu
Then save and exit the BIOS.
Note that the Precision Boost 2 boosting algorithm is still active even though we disabled Precision Boost Overdrive. The standard parameters of the Precision Boost algorithm for the Ryzen 9 7900 are as follows:

Precision Boost C-State Boost Limiter
It would be remiss of me not to at least mention the impact of lesser known Precision Boost 2 C-State Limiter. I made a separate blog on this topic a while back, but it’s a pertinent limiter when talking about overclocking and improving performance.
The long story short is that since AGESA 1003, the Precision Boost C-State Boost Limiter prevents Zen 4 CPUs from boosting over 5.5 GHz when more than 4 cores are active. This particular motherboard BIOS has AGESA 1004 and I can illustrate this behavior using Y-Cruncher.
Since the Fmax of the Ryzen 9 7900 is 5450 MHz, I first increased the frequency ceiling by setting an Fmax override of +200 to increase the Fmax to 5650 MHz. Then I also enable Precision Boost Overdrive to enable higher power limits. Lastly, I use a negative Curve Optimizer to maximize the boost opportunity. I will talk more about these overclocking tools later in the guide.
Now we can illustrate the C-State boost limiter using the Y-Cruncher BKK component stress test workload. As we increase the number of active cores by setting Processor Affinity, we monitor the Core Effective Clock in HWiNFO. As you can see, the frequency is over 5500 MHz when 4 cores are active, but once we add an extra core the frequency is limited to 5500 MHz. In fact, as we keep increasing the active core count, the cores in CCD0 remain restricted to 5500 MHz.

This C-State limiter may affect the performance you can gain from overclocking as well as your overclocking strategy of choice. For more information, I’d refer you to my guide covering this specific topic.
Now back to the performance at stock settings.
Here is the benchmark performance at stock:
- SuperPI 4M: 30.756 seconds
- Geekbench 5 (single): 2,132 points
- Geekbench 5 (multi): 17,525 points
- Cinebench R23 Single: 1,934 points
- Cinebench R23 Multi: 26,119 points
- CPU-Z V17.01.64 Single: 769.7 points
- CPU-Z V17.01.64 Multi: 11,008.5 points
- V-Ray 5: 19,935 vsamples
- AI Benchmark: 5,368 points
- 3DMark Night Raid: 73,011 points
- CS:GO FPS Bench: 587.51 fps
- Tom Raider: 199 fps
- Final Fantasy XV: 200.27 fps

Here are the 3DMark CPU Profile scores at stock
- CPU Profile 1 Thread: 1,091
- CPU Profile 2 Threads: 2,146
- CPU Profile 4 Threads: 4,025
- CPU Profile 8 Threads: 7,388
- CPU Profile 16 Threads: 10,291
- CPU Profile Max Threads: 12,486

When running Prime 95 Small FFTs with AVX-512 enabled, the average CPU effective clock is 4028 MHz with 0.906 volts. The average CPU temperature is 47.1 degrees Celsius. The ambient and water temperature is 22.5 and 29.1 degrees Celsius. The average CPU package power is 90.2 watts.

When running Prime 95 Small FFTs with AVX disabled, the average CPU effective clock is 4213 MHz with 0.930 volts. The average CPU temperature is 49.0 degrees Celsius. The ambient and water temperature is 22.7 and 28.7 degrees Celsius. The average CPU package power is 90.2 watts.

Now, let us try our first overclocking strategy.
However, before we get going, make sure to locate the CMOS Clear button
Pressing the Clear CMOS button will reset all your BIOS settings to default which is helpful if you want to start your BIOS configuration from scratch. However, it does not delete any of the BIOS profiles previously saved. The Clear CMOS button is located at the bottom of the motherboard.
OC Strategy #1: PBO 2 + EXPO
In our first overclocking strategy, we take advantage of AMD exclusive features Precision Boost Overdrive 2 and Extended Profiles for Overclocking.
PBO 2 – Precision Boost Overdrive 2
With the launch of Zen 3, AMD introduced an improved version of the Precision Boost Overdrive toolkit, allowing for manual tuning of the parameters affecting the Precision Boost frequency boost algorithm.
Precision Boost Overdrive 2 builds on the PBO implementation of Zen 2. In addition to the platform overclocking knobs from Zen+ (PPT, TDC, EDC) and processor overclocking knobs from Zen 2 (Boost Override and Scalar), Precision Boost Overdrive 2 introduces Curve Optimizer.

There are essentially 3 levels of Precision Boost Overdrive
- AMD’s stock values, which can be set by disabling PBO
- The motherboard vendor values, which are programmed into the BIOS to match the motherboard VRM specification and can be set by enabling PBO
- Custom values, which can be programmed by the end-user
I explored the ins and outs of Precision Boost Overdrive 2 tuning in my AMD Raphael Overclocking launch article. If you want to learn more about the impact of each of these settings, I suggest you check out that article.
In this overclocking strategy, we’re just enabling Precision Boost Overdrive, whereas, in the following strategies, we’ll explore tuning the parameters. We rely on the motherboard pre-programmed PBO parameters by enabling Precision Boost Overdrive. We find that the following values have changed:

Notably, for the Ryzen 7000 X processors, the Precision Boost parameters are already very unconstraining. So enabling Precision Boost Overdrive yields minimal performance gains. However, the non-X processors are very constrained out of the box. So enabling Precision Boost Overdrive should yield a substantial performance uplift.
EXPO – Extended Profiles for Overclocking
EXPO stands for AMD Extended Profiles for Overclocking. It is an AMD technology that enables ubiquitous memory overclocking profiles for AMD platforms supporting DDR5 memory. EXPO allows memory vendors such as G.SKILL to program higher performance settings onto the memory sticks. If the motherboard supports EXPO, you can enable higher performance with a single BIOS setting. So, it saves you lots of manual configuration.

BIOS Settings & Benchmark Results
Upon entering the BIOS
- Click the XMP/EXPO Disabled button
- Switch to Advanced Mode
- Enter the Advanced CPU Settings submenu
- Enter the Precision Boost Overdrive submenu
- Set Precision Boost Overdrive to Enabled
- Enter the Precision Boost Overdrive submenu
Then save and exit the BIOS.
We re-ran the benchmarks and checked the performance increase compared to the default operation.
- SuperPI 4M: +2.89%
- Geekbench 5 (single): +1.69%
- Geekbench 5 (multi): +15.70%
- Cinebench R23 Single: +0.41%
- Cinebench R23 Multi: +11.61%
- CPU-Z V17.01.64 Single: +0.03%
- CPU-Z V17.01.64 Multi: +8.81%
- V-Ray 5: +12.44%
- AI Benchmark: +17.88%
- 3DMark Night Raid: +3.32%
- CS:GO FPS Bench: +0.07%
- Tomb Raider: +2.51%
- Final Fantasy XV: +0.83%

Here are the 3DMark CPU Profile scores
- CPU Profile 1 Thread: +0.27%
- CPU Profile 2 Threads: +0.14%
- CPU Profile 4 Threads: +0.82%
- CPU Profile 8 Threads: +0.09%
- CPU Profile 16 Threads: +12.78%
- CPU Profile Max Threads: +4.28%

As expected, enabling Precision Boost Overdrive significantly improves the system’s performance. After all, the Ryzen 9 7900 is very limited by the stock Precision Boost values. Unleashing Precision Boost together with enabling EXPO gets us a maximum performance improvement of +17.88% in AI Benchmark.
When running Prime 95 Small FFTs with AVX-512 enabled, the average CPU effective clock is 4971 MHz with 1.192 volts. The average CPU temperature is 91.2 degrees Celsius. The ambient and water temperature is 24.2 and 33.5 degrees Celsius. The average CPU package power is 219.8 watts.

When running Prime 95 Small FFTs with AVX disabled, the average CPU effective clock is 4993 MHz with 1.200 volts. The average CPU temperature is 90.8 degrees Celsius. The ambient and water temperature is 23.7 and 32.8 degrees Celsius. The average CPU package power is 204.0 watts.

OC Strategy #2: GIGABYTE Performance Bung
In our second overclocking strategy, we use the GIGABYTE Performance Bung feature integrated into the GIGABYTE BIOS.
GIGABYTE Performance Bung
Performance Bung is a new performance-oriented technology included in the GIGABYTE AM5 motherboard BIOSes. Essentially it’s a list of preset profiles to configure Precision Boost Overdrive. The profiles configure two things specifically:
- The maximum allowed temperature
- An all-core Curve Optimizer setting
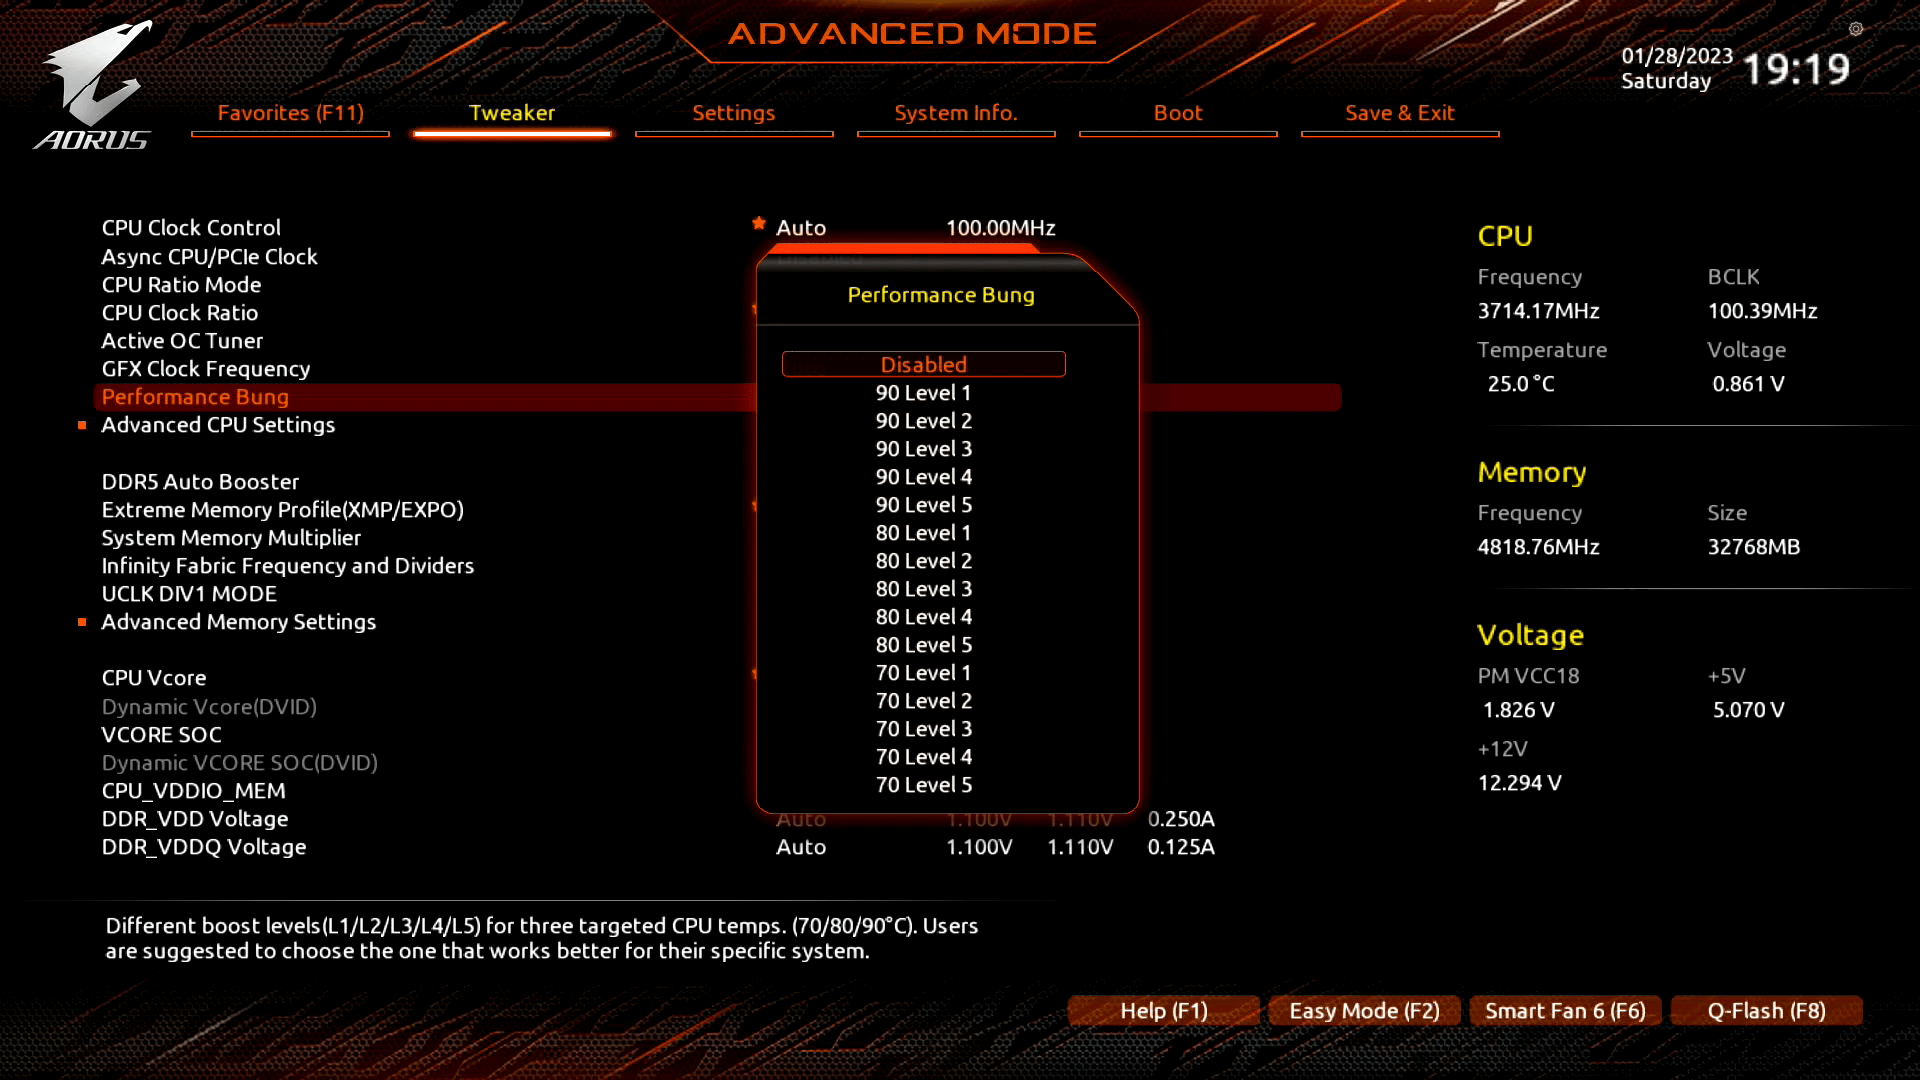
For example, the “90 Level 2” profile we’re using in this strategy will set the maximum temperature to 90 degrees Celsius, down from the default of 95 degrees Celsius, and an all-core Curve Optimizer of -20.

You can select your preferred profile based on the maximum temperature you’re comfortable with and how well your CPU can undervolt. Obviously, a lower maximum temperature will yield lower CPU frequency in all-core workloads and a higher negative Curve Optimizer will push the CPU frequency higher at similar voltage.
Note that Performance Bung does not adjust the Precision Boost power limits. So for a non-X CPU you want to make sure the PPT, TDC, and EDC are also set correctly to maximize the performance.
BIOS Settings & Benchmark Results
Upon entering the BIOS
- Switch to Advanced Mode
- Set Performance Bung to 90 Level 2
- Enter the Advanced CPU Settings submenu
- Enter the Precision Boost Overdrive submenu
- Set Precision Boost Overdrive to Advanced
- Set PBO Limits to Motherboard
- Leave the Precision Boost Overdrive submenu
- Enter the Precision Boost Overdrive submenu
- Leave the Advanced CPU Settings submenu
- Set Extreme Memory Profile(XMP/EXPO) to EXPO 1
Then save and exit the BIOS.
We re-ran the benchmarks and checked the performance increase compared to the default operation.
- SuperPI 4M: +0.88%
- Geekbench 5 (single): +1.92%
- Geekbench 5 (multi): +16.14%
- Cinebench R23 Single: +1.18%
- Cinebench R23 Multi: +14.82%
- CPU-Z V17.01.64 Single: +0.01%
- CPU-Z V17.01.64 Multi: +11.29%
- V-Ray 5: +13.84%
- AI Benchmark: +20.88%
- 3DMark Night Raid: +10.34%
- CS:GO FPS Bench: +4.61%
- Tomb Raider: +2.51%
- Final Fantasy XV: +0.98%

Here are the 3DMark CPU Profile scores
- CPU Profile 1 Thread: +0.09%
- CPU Profile 2 Threads: +0.28%
- CPU Profile 4 Threads: +0.89%
- CPU Profile 8 Threads: +6.02%
- CPU Profile 16 Threads: +14.72%
- CPU Profile Max Threads: +7.38%

While the Performance Bung setting technically does not overclock the processor, with the adjusted Curve Optimizer setting there’s still a performance uplift. We get a considerable improvement of up to 20.88% in AI Benchmark.
When running Prime 95 Small FFTs with AVX-512 enabled, the average CPU effective clock is 5087 MHz with 1.192 volts. The average CPU temperature is 89.9 degrees Celsius. The ambient and water temperature is 23.0 and 32.8 degrees Celsius. The average CPU package power is 223.9 watts.

When running Prime 95 Small FFTs with AVX disabled, the average CPU effective clock is 5106 MHz with 1.198 volts. The average CPU temperature is 90.2 degrees Celsius. The ambient and water temperature is 22.9 and 32.1 degrees Celsius. The average CPU package power is 209.1 watts.

OC Strategy #3: PBO Tuned with Curve Optimizer
In our third overclocking strategy, we will use the Curve Optimizer tool included in the Precision Boost Overdrive 2 overclocker’s toolkit.
PBO 2: Curve Optimizer
As I mentioned earlier in this guide, Curve Optimizer is an important new feature of Precision Boost Overdrive 2.
Curve Optimizer allows end-users to adjust the factory-fused VFT curve, or voltage-frequency-temperature curve, for each CPU core separately. The VFT curve is a unique curve for each core inside your CPU that defines the required voltage for a given frequency at a given temperature. Higher frequencies or higher operating temperatures require higher voltage.

Curve Optimizer adjusts the VFT curve by offsetting the voltages of the factory-fused VFT curve. By setting a positive offset, you increase the voltage point. Conversely, you decrease the voltage point by setting a negative offset.


You can offset the entire curve by up to 30 steps in a positive direction and up to 300 steps in a negative direction. Each step represents approximately 5mV.
The traditional overclocking approach for AMD Ryzen CPUs is to set a negative curve optimizer. Two things happen when you adjust the VFT curve with a negative point offset.
- First, you effectively tell the CPU that it needs less voltage for a given frequency. And, as a consequence, at a given voltage, it can apply a higher frequency. So, when the Precision Boost 2 algorithm determines sufficient power and temperature headroom to use 1.35V, with the negative point offset, it will target a higher frequency.
- Second, the CPU temperature will be lower because you use less voltage at a given frequency. That extra thermal headroom will also encourage the Precision Boost algorithm to target higher voltages and frequencies.
In my AMD Raphael overclocking launch article, I explored the ins and outs of Curve Optimizing with Precision Boost Overdrive 2. If you want to learn more about the impact of Curve Optimizer, I suggest you check out that article.
As I mentioned already, Curve Optimizer is available on a per-core basis. Like in the past, per-core tuning offers a real benefit as it provides some cores with a lot more frequency headroom.
Curve Optimizer Tuning Process
The manual tuning process for Curve Optimizer can become quite convoluted since it affects the CPU core voltage in all scenarios ranging from very light single-threaded workloads to heavy all-core workloads.
My Curve Optimizer process for this Ryzen 9 7900 was as follows.
First, I use a broad tuning approach to get a big-picture understanding of the tuning opportunity. Then, I narrow down the per-core curve optimizer settings to achieve stability in a light workload. Then, I verify the stability in all-core multi-threaded workloads. Lastly, I run through all my benchmarks to validate stability in a wide range of test scenarios.
The broad tuning process includes:
- Using SuperPI 32M with affinity to a specific thread to check the maximum effective clock frequency
- Gradually increasing an all-core negative curve optimizer until the point of instability
- Gradually increasing Fmax Boost Override in case the boost frequency is hitting the frequency ceiling
The narrow tuning process includes:
- Using SuperPI 32M with affinity to a specific thread to check the maximum effective clock frequency
- Gradually increasing the per core negative curve optimizer until the point of instability for each core
- Gradually increasing Fmax Boost Override in case the boost frequency is hitting the frequency ceiling
The all-core stability process includes running Prime 95 Small FFTs with both AVX enabled and disabled.
The benchmark validation process includes completing all the benchmarks I’ve included in this guide. If a benchmark is unstable, I increase every core’s per-core curve optimizer value by 2 until I reach stability.

In my case, I used an all-core Curve Optimizer of -25 for CCD0 (except -15 for Core 0) and -40 for CCD1 (except -30 for Core 11), and a Fmax boost override of +125 MHz. The main limiting factor for my overclock was stability in Prime95 Small FFTs with AVX2 enabled which caused instability issues both in single and multi threaded configurations with more aggressive Curve Optimizer and Fmax override settings.

I will show you the BIOS configuration in a minute. But first, please note that the curve optimizer settings are CPU-specific, and the optimal values of your CPU may differ substantially. I also want to emphasize that this particular CPU is a fantastic overclocker. I’ve seen CPUs that struggle to stably run even -5 curve optimizer.
The following table shows the boost profile for this specific CPU.

We can make a couple of interesting observations.
As with most dual-CCD Ryzen 7000 processors, we find two different CCDs. While each core in CCD0 can boost to the Fmax limit of 5450 MHz, none of the cores in CCD1 can. In fact, the worst core in CCD1 can only boost to 5300 MHz.
After Curve Optimizing, we can see a substantial frequency uplift across the board. Unsurprisingly the biggest uplift is on CCD1 where we could use a much more aggressive Curve Optimizer setting. Furthermore, we have a much more equal maximum frequency across all cores.
From the data, we can also see that no core actually reaches the new Fmax of 5575 MHz. This tells us that further increasing the Fmax won’t help much unless we’d be able to further improve the Curve Optimizer setting as well.
On average, the 1T boost frequency increases 150 MHz from 5408 MHz to 5559 MHz.

BIOS Settings & Benchmark Results
Upon entering the BIOS.
- Switch to Advanced Mode
- Enter the Advanced CPU Settings submenu
- Enter the Precision Boost Overdrive submenu
- Set Precision Boost Overdrive to Advanced
- Set PBO Limits to Motherboard
- Set CPU Boost Clock Override to Enabled (Positive)
- Set Max CPU Boost Clock Override(+) to 125
- Enter the Curve Optimizer submenu
- Set Curve Optimizer to Per Core
- For every core, set Curve Optimizer Sign to Negative
- For Core 0, set Curve Optimizer Magnitude to 15
- For Cores 1, 2, 3, 4, and 5, set Curve Optimizer Magnitude to 25
- For Cores 6, 7, 8, 9, and 10, set Curve Optimizer Magnitude to 40
- For Core 11, set Curve Optimizer Magnitude to 30
- Leave the Curve Optimizer submenu
- Leave the Precision Boost Overdrive submenu
- Enter the Precision Boost Overdrive submenu
- Leave the Advanced CPU Settings submenu
- Set Extreme Memory Profile(XMP/EXPO) to EXPO 1
Then save and exit the BIOS.
We re-ran the benchmarks and checked the performance increase compared to the default operation.
- SuperPI 4M: +4.48%
- Geekbench 5 (single): +3.89%
- Geekbench 5 (multi): +17.89%
- Cinebench R23 Single: +2.93%
- Cinebench R23 Multi: +15.66%
- CPU-Z V17.01.64 Single: +2.00%
- CPU-Z V17.01.64 Multi: +14.14%
- V-Ray 5: +17.96%
- AI Benchmark: +24.01%
- 3DMark Night Raid: +10.60%
- CS:GO FPS Bench: +4.74%
- Tomb Raider: +2.51%
- Final Fantasy XV: +1.60%

Here are the 3DMark CPU Profile scores:
- CPU Profile 1 Thread: +1.65%
- CPU Profile 2 Threads: +0.05%
- CPU Profile 4 Threads: +1.91%
- CPU Profile 8 Threads: +5.96%
- CPU Profile 16 Threads: +16.29%
- CPU Profile Max Threads: +8.36%

With Curve Optimizer we finally get around increasing the clock frequencies of our processor. While we are able to increase the frequency a little over stock, the overall frequency increase is limited due to the CPU silicon quality. We see the biggest performance improvement of +24.01% in AI Benchmark
When running Prime 95 Small FFTs with AVX-512 enabled, the average CPU effective clock is 5136 MHz with 1.198 volts. The average CPU temperature is 90.2 degrees Celsius. The ambient and water temperature is 20.3 and 31.9 degrees Celsius. The average CPU package power is 229.1 watts.

When running Prime 95 Small FFTs with AVX disabled, the average CPU effective clock is 5140 MHz with 1.201 volts. The average CPU temperature is 89.9 degrees Celsius. The ambient and water temperature is 19.7 and 30.8 degrees Celsius. The average CPU package power is 212.5 watts.

OC Strategy #4: PB Supercharged with ECLK
In our fourth overclocking strategy, we take advantage of the return of the ECLK mode. ECLK stands for external clock and is precisely what the term suggests: an external clock generator. It was previously available on Ryzen 2000 Pinnacle Ridge processors but was removed afterward.
Raphael ECLK Overview
The standard Raphael platform has a 48 MHz crystal input to the integrated CGPLL clock generator. The CGPLL then generates a 48 MHz clock for the USB PLL and a 100 MHz reference clock for the FCH, which contains the CCLK PLL for the CPU cores and several SOC PLLs.

In addition to the standard internal CGPLL, Raphael supports up to two external clock modes. They’re called eCLK0 Mode and eCLK1 Mode.
In eCLK0 Mode, an external 100MHz reference clock is used for both the CPU and SOC PLLs. In other words, it’s a reference clock that affects the CPU core clocks and the PCIe and SATA clocks. The USB PLL is still driven by the 48 MHz crystal via the CGPLL.

In eCLK1 Mode, there are two distinct external 100MHz reference clocks. One clock provides the 100MHz input for the CPU PLL, and another provides the 100MHz reference clock for the SOC PLLs. AMD suggests up to 140 MHz can be expected for the CPU core reference clock, but your mileage may vary. The USB PLL is still driven by the 48 MHz crystal via the CGPLL.

In previous SkatterBencher articles, I referred to the technique of overclocking the reference clock as “supercharging PBO.” Unlike previous Ryzen CPUs, overclocking the reference clock is very well supported and provides a viable path to overclocking.
The overclocking strategy with ECLK is the polar opposite of what we’re used to with Ryzen CPUs. Typically, as shown in OC Strategy #3, Ryzen overclocking consists of using curve optimizer to add a negative voltage offset to the CPU core VFT curve. By doing so, the CPU will boost to higher frequencies.
With ECLK, we still build on the factory-fused VFT curve but adjust the frequency by adjusting the reference clock. For example, if the Precision Boost has a VFT point for 5000 MHz at 1.25V at 50C, with an ECLK of 105 MHz, the actual point will be 5250 MHz at 1.25V at 50C.

Obviously, the default voltage for this VFT point won’t suffice for stable operation. So, counter-intuitively, we use a positive curve optimizer to increase the voltages of the VFT point. For example, a +30 curve optimizer may increase the voltage by 150mV. Thus, the resulting VFT point will be 5250 MHz at 1.40V at 50C.
Suppose Curve Optimizer doesn’t provide you with sufficient additional voltage. In that case, you can always add a voltage offset via the VRM controller configuration.
One more important point: ECLK also affects the maximum frequency ceiling. With an ECLK of 105 MHz, the new programmed Fmax for the Ryzen 9 7900 is 5450 MHz x 1.05 = 5722 MHz. That’s way too high for this CPU. Luckily, we can use a negative Fmax boost override to fix this.

ECLK Tuning Process
The manual tuning process for eCLK tuning can become quite convoluted since it affects the CPU core stability in all scenarios ranging from very light single-threaded workloads to heavy all-core workloads.
My ECLK tuning process for this Ryzen 9 7900 was as follows.
First, I use a broad tuning approach to get a big-picture understanding of the tuning opportunity. Then, I narrow down the per-core curve optimizer settings to achieve stability in a light workload. Then, I verify the stability in all-core multi-threaded workloads. Lastly, I run through all my benchmarks to validate stability in a wide range of test scenarios.
The broad tuning process includes:
- Using SuperPI 32M with affinity to a specific thread to check the maximum effective clock frequency
- Gradually increasing an all-core negative curve optimizer until the point of instability
- Gradually increasing Fmax Boost Override in case the boost frequency is hitting the frequency ceiling
The narrow tuning process includes:
- Using SuperPI 32M with affinity to a specific thread to check the maximum effective clock frequency
- Gradually increasing the per core negative curve optimizer until the point of instability for each core
- Gradually increasing Fmax Boost Override in case the boost frequency is hitting the frequency ceiling
The all-core stability process includes running Prime 95 Small FFTs with both AVX enabled and disabled.
The benchmark validation process includes completing all the benchmarks I’ve included in this guide. If a benchmark is unstable, I increase every core’s per-core curve optimizer value by 2 until I reach stability.

In my case, I used an ECLK of 104.00 MHz, a Fmax boost override of -50, and a per-core Curve Optimizer ranging from +30 on Core 0 to +0 on Core 3, 5, 10, and 11. I will show you the BIOS configuration in a minute. First, please note that these settings, especially the curve optimizer, are CPU-specific, and the optimal values of your CPU may differ substantially.

As in the previous OC Strategy, the main limiting factor for my overclock was stability in Prime95 Small FFTs with AVX2 enabled which caused instability issues both in single and multi threaded applications with more aggressive Curve Optimizer and Fmax override settings.
The following table shows the boost profile for this specific CPU.

We can make a couple of interesting observations.
Tuning with eCLK provides interesting results. We manage to further improve the maximum 1T boost clock to over 5.6G. However, while we get higher per core boost frequencies on most cores in CCD0, we don’t quite see that on CCD1. The cores in CCD1 still boost higher than stock, they don’t boost as high as with an aggressive Curve Optimizer.
Overall, the eCLK strategy typically provides an avenue to slightly higher frequencies at the cost of slightly higher voltages. While this offers better performance in light workloads, the higher voltages will push the CPU quicker to the thermal limit. Thus, in heavy workloads, strictly using the Curve Optimizer tool for undervolting yields slightly better results.

BIOS Settings & Benchmark Results
Upon entering the BIOS
- Switch to Advanced Mode
- Set CPU Clock Control to 104.00MHz
- Set Async CPU/PCIe Clock to Enabled
- Enter the Advanced CPU Settings submenu
- Enter the Precision Boost Overdrive submenu
- Set Precision Boost Overdrive to Advanced
- Set PBO Limits to Motherboard
- Set CPU Boost Clock Override to Enabled (Negative)
- Set Max CPU Boost Clock Override(-) to 50
- Enter the Curve Optimizer submenu
- Set Curve Optimizer to Per Core
- For every core, set Curve Optimizer Sign to Positive
- For Core 0, set Curve Optimizer Magnitude to 30
- For Cores 1, 2, 4, and 6, set Curve Optimizer Magnitude to 20
- For Cores 3, 5, 10, and 11, set Curve Optimizer Magnitude to 0
- For Cores 7 and 9, set Curve Optimizer Magnitude to 10
- For Core 8, set Curve Optimizer Magnitude to 10
- Leave the Curve Optimizer submenu
- Leave the Precision Boost Overdrive submenu
- Enter the Precision Boost Overdrive submenu
- Leave the Advanced CPU Settings submenu
- Set Extreme Memory Profile(XMP/EXPO) to EXPO 1
Then save and exit the BIOS.
We re-ran the benchmarks and checked the performance increase compared to the default operation.
- SuperPI 4M: +6.32%
- Geekbench 5 (single): +4.60%
- Geekbench 5 (multi): +17.46%
- Cinebench R23 Single: +4.01%
- Cinebench R23 Multi: +13.01%
- CPU-Z V17.01.64 Single: +0.39%
- CPU-Z V17.01.64 Multi: +10.64%
- V-Ray 5: +13.84%
- AI Benchmark: +22.71%
- 3DMark Night Raid: +11.90%
- CS:GO FPS Bench: +5.36%
- Tomb Raider: +2.51%
- Final Fantasy XV: +1.10%

Here are the 3DMark CPU Profile scores:
- CPU Profile 1 Thread: +3.48%
- CPU Profile 2 Threads: +4.01%
- CPU Profile 4 Threads: +6.09%
- CPU Profile 8 Threads: +8.80%
- CPU Profile 16 Threads: +15.92%
- CPU Profile Max Threads: +6.17%

While the overclocking approach with ECLK helps us gain performance in lighter single-threaded workloads compared to using Curve Optimizer, in all-core heavy workloads the impact of a positive Curve Optimizer is noticeable. While we still improve the performance substantially over stock, it’s not as good as when using negative Curve Optimizer. We see the highest performance improvement of +22.71% in AI Benchmark.
When running Prime 95 Small FFTs with AVX-512 enabled, the average CPU effective clock is 4989 MHz with 1.201 volts. The average CPU temperature is 89.4 degrees Celsius. The ambient and water temperature is 21.1 and 31.7 degrees Celsius. The average CPU package power is 225.3 watts.

When running Prime 95 Small FFTs with AVX disabled, the average CPU effective clock is 5033 MHz with 1.208 volts. The average CPU temperature is 89.3 degrees Celsius. The ambient and water temperature is 21.1 and 32.4 degrees Celsius. The average CPU package power is 210.7 watts.

OC Strategy #5: Manual Overclock
In our fifth overclocking strategy, we will pursue a manual overclock.
One could question the use-case for manual overclocking an AMD Ryzen CPU. Just like with all past Ryzen processors, the major downside of manual overclocking is that you lose the benefits of Precision Boost technology in low-threaded benchmark applications. So, whereas this Ryzen 9 7900 can boost up to 5450 MHz with Precision Boost, it will be limited to your set fixed frequency when manually overclocking.
However, manual overclocking is not all negative and even has some benefits.
- First, automatic overclocking and frequency boosting technologies leave a little margin on the table. We can exploit this margin and fine-tune it for application stability when manually overclocking with our specific hardware configuration.
- Second, on AMD Ryzen CPUs, you can set the frequency for each CCX separately. So, we can exploit the fact that some CCXs may overclock better than others.
- Thirdly, by setting a fixed voltage, we avoid the CPU dynamically and rapidly updating its VID requests to the VRM controller. This alleviates stress on the VRM and typically yields lower temperatures.
To better understand the performance tuning opportunities embedded in the Ryzen 9 7900 processor, let’s look at its clocking and voltage topology in more detail.
CPU Core Clocking Topology
The clocking of AMD Raphael is similar to the previous generation of Zen 3 Vermeer desktop CPUs.
The standard Raphael platform has a 48 MHz crystal input to the integrated CGPLL clock generator. The CGPLL then generates a 48 MHz clock for the USB PLL and a 100 MHz reference clock for the FCH, which contains the CCLK PLL for the CPU cores and several SOC PLLs.
The CCLK PLL 100MHz reference clock drives the 200 MHz VCO, which is then multiplied by an FID and divided by a DID. As a whole, this provides CPU clock frequency granularity of 25 MHz.
As with Vermeer, each CCX has its own PLL, with the cores within that CCX running at the same frequency. In a typical operation, all cores within a CCX will run at the same frequency. The effective clock will differ if the core is in a different P-state.
The SOC PLLs include a wide range of PLLs present on the IO die. The ones most relevant for overclocking are:
- FCLK for the data fabric
- UCLK for the memory controller
- MCLK for the system memory
- GFXCLK for the integrated graphics
The SOC PLLs are not particularly relevant for manual CPU Core overclocking.

As I mentioned in OC Strategy #4, in addition to the standard internal CGPLL, Raphael supports up to two external clock modes. However, we won’t be using Eclk in this overclocking strategy.
CPU Core Voltage Topology
From the voltage topology perspective, there are a few minor changes. Like Vermeer, the processor still relies on an internal and external power supply to generate the processor voltages.
There are four primary power supplies from the motherboard VRM to the processor: VDDCR, VDDCR_SOC, VDDCR_MISC, and VDDIO_MEM_S3. I have covered the details extensively in my Raphael overclocking launch article.
The VDDCR voltage rail provides the external power for two internal voltage regulators: VDDCR_CPU and VDDCR_VDDM.
VDDCR_CPU provides the voltage for the CPU cores in CCX. On CPUs with multiple CCXs, each CCX has its own VDDCR_CPU voltage rail, but the voltage will be identical. The voltage rails can work in either regular or bypass mode, but on Raphael, it is always in bypass mode. That means the voltage is always equal to the VDDCR external voltage.
VDDCR_VDDM provides the voltage for the L2, L3, and, if present, 3D V-Cache on a CCX. On CPUs where there are multiple CCXs, each CCX has its own VDDCR_VDDM voltage rail. This rail cannot work in bypass mode; therefore, it is internally regulated from the VDDCR external voltage rail. The default VDDM voltage is 0.95V
The VDDCR voltage rail can be directly controlled via the SVI3 interface. VDDCR_VDDM cannot be controlled by the end-user.

Choosing the proper manual voltage is always a matter of finding a suitable trade-off between increased overclocking potential, the thermal challenges that come with increased voltage, and of course, consideration of CPU lifespan.
CCX Frequency Tuning Process
With that last thought, we kick off our manual overclocking process.
Our limiting factor will ultimately be the cooling solution as power consumption increases exponentially with operating voltage and temperature scales (somewhat) linearly with power consumption.
The maximum voltage will be determined by the application we’re tuning for. So, the first step in our tuning process would be deciding on the stress test representing our worst-case scenario. In this case, I pick the 30 min Prime95 Small FFTs non-AVX stress test.
The next step is to set a fixed CPU ratio and check the maximum temperature when running our workload. If there’s thermal headroom left, increase the operating voltage.
Once we know the maximum voltage, we can tune the CCX ratio. Simply increase the CPU ratio until the application shows instability, then back off. This approach will give you the maximum stable per-CCX frequency for a given voltage.
In our case, we end up with a CPU ratio of 54.25X for CCD0, 53.50X for CCD1, and a Core VID of 1.235V. During our stress test, this yields a CPU voltage of 1.2V and a CPU temperature of 94.8 degrees Celsius.

BIOS Settings & Benchmark Results
Upon entering the BIOS
- Switch to Advanced Mode
- Set CPU Ratio Mode to Per CCX
- Set CCD0 CCX0 Ratio to 54.25
- Set CCD1 CCX0 Ratio to 53.50
- Set Extreme Memory Profile(XMP/EXPO) to EXPO 1
- Set CPU Vcore to 1.235
Then save and exit the BIOS.
We re-ran the benchmarks and checked the performance increase compared to the default operation.
- SuperPI 4M: +2.13%
- Geekbench 5 (single): -4.03%
- Geekbench 5 (multi): +15.63%
- Cinebench R23 Single: +0.77%
- Cinebench R23 Multi: +18.24%
- CPU-Z V17.01.64 Single: -0.94%
- CPU-Z V17.01.64 Multi: +13.38%
- V-Ray 5: +18.51%
- AI Benchmark: +24.57%
- 3DMark Night Raid: +9.71%
- CS:GO FPS Bench: +2.10%
- Tomb Raider: +2.01%
- Final Fantasy XV: +0.45%

Here are the 3DMark CPU Profile scores
- CPU Profile 1 Thread: +0.82%
- CPU Profile 2 Threads: +1.96%
- CPU Profile 4 Threads: +7.40%
- CPU Profile 8 Threads: +10.17%
- CPU Profile 16 Threads: +20.17%
- CPU Profile Max Threads: +8.30%

As expected, we see a performance deficit against stock performance in some benchmarks as manual overclocking doesn’t benefit from the Precision Boost 1T frequency. However, the performance deficit is not as bad as I had expected. In multi-threaded applications, however, we see a nice performance uplift across the board up to +24.57% in AI Benchmark.
When running Prime 95 Small FFTs with AVX-512 enabled, unfortunately, the CPU is not stable. This is a deliberate choice on our side as we decided that Prime95 with AVX512 enabled is not a representative worst-case workload for our system.
When running Prime 95 Small FFTs with AVX disabled, the average CPU effective clock is 5379 MHz with 1.199 volts. The average CPU temperature is 94.8 degrees Celsius. The ambient and water temperature is 23.5 and 32.8 degrees Celsius. The average CPU package power is 215.8 watts.

AMD Ryzen 9 7900: Conclusion
Alright, let us wrap this up.
I would say overclocking the Ryzen 9 7900 was a mixed experience. On the one hand, it’s great to see there’s a good chunk of performance left to be unlocked for those who are willing to dig into the details. On the other hand, unfortunately, I didn’t win the silicon lottery with this CPU and the increase in maximum frequency is pretty limited.
The overclocking process of the non-X processors is pretty much identical to that of their -X counterparts. The simplest path to performance improvement is enabling Precision Boost Overdrive, enabling EXPO, increasing the Fmax boost override, and finetuning with Curve Optimizer.
As I mentioned in previous Ryzen 7000 SkatterBencher guides, it’s always cool when new avenues and strategies for overclocking open up. The re-introduction of eCLK mode provides a viable path for overclocking, as shown in this guide. While it’s not a straightforward best choice in all scenarios, it’s definitely an approach worth including in your tuning repertoire.
The GIGABYTE B650E Aorus Tachyon also has Active OC Tuner which you can use to leverage the benefits of both Precision Boost Overdrive and manual overclocking. If you want to learn how to use AOCT, feel free to check out SkatterBencher #45 where I used it on the X670E Aorus Master and Ryzen 9 7950X.
Anyway, that’s all for today!
I want to thank my Patreon supporters for supporting my work. As per usual, if you have any questions or comments, feel free to drop them in the comment section below.
See you next time!
5 Minute Overclock: AMD Ryzen 9 7900 to 5580 MHz - 5 Minute Overclock
[…] I’ll speed-run you through the BIOS settings and provide some notes and tips along the way. Please note that this is for entertainment purposes only and not the whole picture. Please don’t outright copy these settings and apply them to your system. If you want to learn how to overclock this system, please check out the longer SkatterBencher article. […]